A Computational System for the Heuristic Forecasting of Fire Risk
Mariano Cabrero-Canosa, Eduardo Mosqueira-Rey, Vicente Moret-Bonillo
Department of Computer Science, University of A Coruña
A Coruña, 15071, Spain
E. Carballo, M.Piñeiro
Department of Applied Physics, University of Vigo, Spain
S.Kolev
National Institute of Meteorology, Sophia, Bulgaria
A.V. Galiñares, M.J. Paz-Andrade
Department of Applied Physics, University of Santiago de Compostela, Spain
T. Carballas
Instituto de Investigaciones Agrobiológicas de Galicia, CSIC, Spain
ABSTRACT
This article describes a computational system which forecasts the potential risk of forest fires, by processing a set of meteorological variables so as to produce a fire weather risk index. The system also studies a set of area characteristics, which provides us with long-term static information on potential fire risk. This area-specific information constitutes the interpretation context and can be used to refine the results computed from the weather index.
Keywords: Fire Risk Forecasting; Heuristics; Artificial Intelligence.
1. INTRODUCTION
Each year and in many countries, forest fires cause important ecological damage, financial losses and frequently, the loss of human life [1]. It is hardly surprising that governments tend to allocate ever-greater material and human resources to the prevention of fires in the first place, and when a fire occurs, to the optimal management of the resources available for extinguishing the fire.
Effective management of resources in the forest-fire context involves tasks in the following areas:
• Prediction of the annual burning seasons
• Classification of the fire risk by areas
• Optimal management of resources when fires occur.
This is the background to our present research, which will show how computational systems can be effective predictors of forest fire risks in any concrete,cartographically documented area.
Our proposed system, which forms part of a larger integrated system [2], calculates a daily potential fire-risk index for a specific area based on weather conditions. Once this index has been obtained certain characteristics specific to the area in question (the interpretation context) are taken into consideration so as to refine the said index and ultimately quantify the potential risk of a forest fire.
2. GENERAL APPROACH
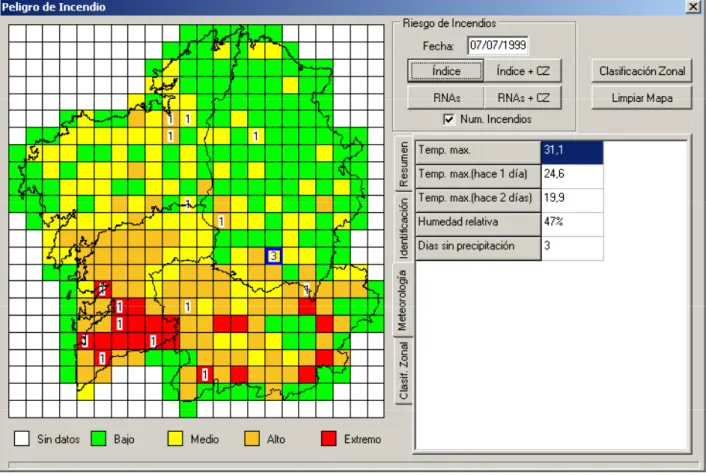
In order to obtain the daily risk index by area, for each 10 km x 10 km area the system requires the following five meteorological parameters [3]: maximum predicted temperature for the day in question (MPT); maximum temperature for the previous day (MT-1); maximum temperature for the day before yesterday (MT-2); number of days without rain (DWR); and finally, relative humidity (RH). Once the values corresponding to each area have been weighted, an index is obtained of the meteorological risk. In accordance with established standards this risk is classified as: low weather risk, average weather risk, high weather risk and extreme weather risk (Figure 1).
Figure 1. Map showing the meteorological fire risk
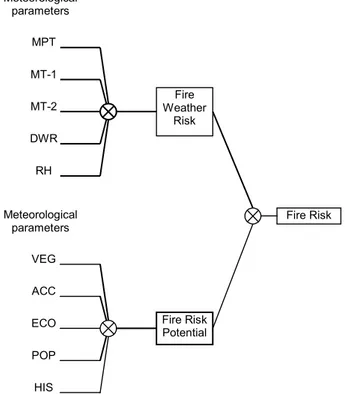
Both characteristics, weather risk and risk potential, are heuristically processed in order to obtain a final classification of fire risk which, in accordance with the established standards could be: low fire risk, average fire risk, high fire risk or extreme fire risk (Figure 3).
Fire Risk Fire Weather Risk Meteorological parameters MPT MT-1 MT-2 DWR RH Fire Risk Potential Meteorological parameters VEG ACC ECO POP HIS
Figure 3. final classification of fire risk obtained heuristically from fire weather risk and fire risk potential.
3. IMPORTANCE OF CLASSIFICATION BY AREA
Experience has shown that a forest fire forecast based exclusively on weather conditions is not very effective. In this regard, certain area characteristics have an important influence on the actual formation of a fire. Put another way, no matter how extreme the weather conditions may be, a fire will be not develop if there is nothing to burn. Likewise, many forest fires are started deliberately, which means that the affected area must be near a populated area or relatively accessible. These are just a few examples of area characteristics that have a bearing on the possible outbreak of a fire.
In our study, we consider that the following area characteristics have a potential impact on fire risk forecasting: vegetation, economic activity, accessibility, population and past records.
Of these, vegetation is the most important condition affecting classification by area. To evaluate the impact of the vegetation in each quadrat or cell of the map, we defined categories as follows: pastureland, scrubland and wooded areas. We consider that the ‘vegetation’ condition favours fire outbreaks if the combined scrubland and wooded surface area (as a percentage) is greater than 40% of the total surface area of the quadrat, excluding areas occupied by water (sea, reservoirs, lakes, etc).
Any lower percentage is considered as not increasing the risk of fire.
The impact of economic activity, accessibility and population on potential fire risk is assigned heuristically using cartographic data.
Another important contextual condition is the previous fire record for a quadrat. This takes into account fire frequency in quadrats which would not be assessed as particularly prone to outbreaks of fire on the basis of area characteristics, but where, nevertheless, fires occur.
4. HEURISTIC EVALUATION AND ESTABLISHMENT OF POTENTIAL FIRE RISK
For each 10 x 10 quadrat, if:
Veg = Vegetation (1 in favour of, 0 against fire risk)
Eco = Economic activity (1 in favour of, 0 against fire risk)
Acc = Accessibility (1 in favour of, 0 against fire risk)
Pob = Population (1 in favour of, 0 against fire risk)
His = Previous fire record – history of the quadrat (1 in favour of, 0 against fire risk)
The potential fire risk index of the quadrat (Iz) is obtained from the following equation:
Iz = 3Veg + Eco + Acc + Pop + His
As can be seen, this equation gives greater importance to the vegetation condition than to the other area characteristics.
This result must be normalised in order to adapt it to a classification system containing four categories, which results in a normalised area index (IzN) taking the following values:
IzN = 0 Low Potential Fire Risk
IzN = 1 Low Potential Fire Risk
IzN = 2 Average Potential Fire Risk
IzN = 3 High Potential Fire Risk
IzN = 4 Extremely High Potential Fire Risk
5. CONTEXTUAL EVALUATION OF FIRE RISK
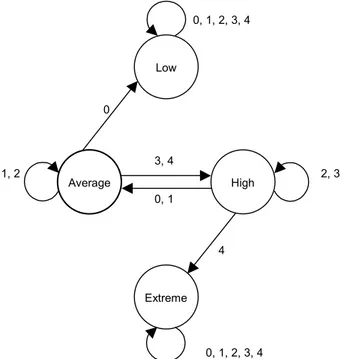
The normalised area index and the weather index are combined in the transition graph of Figure 4.
This heuristic processing results in a forecasted low, average, high or extremely high fire risk that attaches more weight to weather data than area data in extreme situations.
The heuristic combination of both weather risk and potential risk factors takes into account the following restrictions:
• Risk potential is used to refine weather risk
• In the extremely low and extremely high weather risk situations, the meteorological situation overrules the area classification.
Once the final classification has been made, the results are presented to the user in graph and text format so that the inferential process applied by the system can be clearly seen (see Figure 5).
Low
Average High
Extreme
0, 1, 2, 3, 4
0
1, 2 3, 4
0, 1
2, 3
4
0, 1, 2, 3, 4
Figure 4. Transition graph for the computation of fire risk. The nodes represent the weather risk and the arcs show how the area
classification corrects the weather risk to produce fire risk.
6. VALIDATION AND RESULTS
A database with meteorological data and area information for Galicia (north-west Spain) [4][5] was employed in order to evaluate system performance. This database covered the years 1999, 2000 and 2001, and included daily meteorological information for each 10 km x 10 km area. Analysed in total were 1095 days, 1971000 data items and 2160 contextual area characteristics. The meteorological forecasts of fire risk were compared to the actual fires that had occurred in each zone. The same study was repeated but this time taking into consideration the characteristics of each 10 km x 10 km area. The results obtained clearly show that the utilisation of contextual area information results in a better relation of sensibility and specificity agreement ratios [6] for the prediction of fire risk, and always within the limits for a prediction of this kind.
7. ACKNOWLEDGEMENTS
This research has been funded by the CICYT-FEDER 1FD97-1122-C06-01 project.
8. REFERENCES
[1] García-Díez, A., Rivas-Soriano, L., De Pablo-Dávila, F., and García-Díez, E.L., “Incendios Forestales: Modelo Predictivo”, Investigación y Ciencia, pp. 32-34, 2001.
[2] Alonso-Betanzos, A., Fontenla-Romero, O., Guijarro-Berdiñas, B., Hernández-Pereira, E., Canda, J., Jiménez, E., Legido, J.L., Muñiz, S, Andrade, C. and Paz-Andrade, M.I. “A Neural Network Approach for Forestal Fire Risk Estimation”, ECAI, 2002
[3] Galiñanes, A.V., Alonso, A., Carballas, T., Carballo, E., Jiménez, E., Kolev, S., Legido, J.L., Mato, M.M., Moret, V., Muñiz, S., Paz-Andrade, C. and Paz-Andrade, M.I. “Local forest fire weather occurrence index for Galicia (Spain)”, International Conference of Forest Fire Research, 2002.
[4] Bermúdez, J. and Touza, M., “2000: Las Cifras del Tercer Inventario Forestal en Galicia y Su Incidencia en la Industria de Transformación de la Madera”: CIS-Madera, Nº 4, 1st Qtr, 2000.
[5] Prada, A. “Montes e Industria. O Circuito da Madeira en Galicia”. Serie de Estudios Sectoriales. Fundación Caixa Galicia, 1991.