PRESSURE AND VIBRATION AIRBORNE TWO-WAYS SOUND
INSULATION RATINGS COMPARISON
PACS: 43.55.Rg
San Millán-Castillo, Roberto1; De Luis José, Javier1; Goya Esteban, Rebeca1; Morgado Reyes,
Eduardo1
1 E.T.S.I. Telecomunicación – Universidad Rey Juan Carlos, Camino del Molino, s/n - 28943
Fuenlabrada (Madrid, Spain). [email protected]
Keywords: insulation, airborne sound, transmission, vibration.
ABSTRACT.
When dealing with several sound insulation ratings, results are quite different as they depend on algorithm variables. Dn, DnT, and R´ values do not converge usually although they are all
transmission lost estimators. Firstly, it is assessed how new ISO 16283-1 standard influences the difference among ratings versus previous ISO 140-4, when testing both possible ways at a University classroom. Besides, those pressure procedures are compared with one based on vibration measurements, Solidnoise™. Both methods are analysed and a more sustainable use proposal is suggested.
RESUMEN.
Cuando se trabaja con diferentes índices de aislamiento acústico los resultados son diferentes, pues dependen de las variables de sus fórmulas de cálculo. Los valores Dn, DnT, y R´ no
INTRODUCTION
One of the most basic and popular test in building acoustics is field measurements of airborne sound insulation between rooms. Along many years, ISO 140-4 standard depicted the procedure to perform the standard [1]. This standard was replaced by new ISO 16283-1 standard [2], with similar concept line, but it brings some changes in the measurement procedure to improve it [3]. However, both methodologies coexist in some cases, as in Spanish market [4]. Sound pressure level is the main parameter in both standards.
Some other methods mix classical pressure ones with vibration measurements [5,6,7,8]. Vibration data provide information regarding flanking contribution, and the same airborne sound insulation test provide typical insulation ratings.
Besides, standardized procedures with acoustical intensity as main parameter are available, as ISO 15186 standard [9]. Alternatively, p-u probes intensity estimation techniques, instead of p-p classical probes start being developed and used in building acoustics. [10]. Anyway, these intensity options are not in this paper scope.
When testing airborne sound insulation, it is quite common not having values in agreement regarding ratings, because of the different parameters used in those rating value estimations. [1,2]. Nevertheless, when having different standards with different procedures working at the same time, it is interesting assess those differences. Traditionally, that disagreement is linked to the difficulty of low frequency insulation values estimation [11,12], and reverberation time uncertainty as a sound pressure weighting variable regarding to room transmitted sound power [13,14].
More popular insulation ratings, Dn, DnT, y R´, are compared using explained procedures, in a
standard frequency range. In spite of similar experiments [15,16], this paper provides a comparison among two classical pressure methods, and one that adds vibration measurements. An insulation ratings assessment in the two possible testing ways is also included. High complexity testing is considered, influenced by a real environment and with two rooms with a very different reverberation time.
This paper shows results from some airborne sound insulation testing in a Universidad Rey Juan Carlos classroom, with a particular layout. Once different insulation ratings are worked-out from different procedures, a sustainable methodology use proposal is suggested, along with some future research lines. “Sustainable” is understood as the efficient use of resources and results.
PROBLEM STATEMENT
There are several ways to assess airborne sound insulation between rooms, so this fact could be confusing when comparing results. Since, they are not equivalent methodologies, those comparisons should not be straight in general terms.
The main problem set out is: the typical airborne sound insulation ratings between rooms (Dn, DnT,
and R´) estimation convergence study, when performed under different procedure. The issues to deal with are the following ones:
• Sustainable ratings and procedures assessment, analysis, and use proposal suggestion.
• Improvements and future research lines proposal in order to increase useful information, data convergence, and sustainability in airborne sound insulation testing.
METHODS AND MATERIALS
Testing was carried out in Universidad Rey Juan Carlos facilities, in Fuenlabrada Campus (Madrid, Spain). The biggest room, V classroom = 299.5m3, is a practice classroom. The adjacent room is a
small hall, V hall = 57.6m3. The separating element consists of a wall and a door with a small
window, S separating = 12.3m2. Both rooms can be defined in an acoustic way by their reverberation
[image:3.595.90.505.315.424.2]times, estimated by a 20dB decay (RT20). It is remarkable that volume and RT20 do not correlate in the regular way, and the biggest room is more damped although materials on walls are the same, Figure 2. The reason is that there are many equipment and obstacles, while the hall is completely empty.
Figure 1. Classroom photograph, on left. Hall and separating element, on right.
Testing are performed according to each applied standard requirements, ISO 140-4 and ISO 16283-1[1,2], to get Engineering precision in the standard frequency range, from 100Hz to 3,15kHz. Differences in requirements [3] and results between both standards have been widely assessed [15,16]. The “regular way” is the one recommended in the standards, the bigger room is the source room. The “opposite way” does not comply with the former layout, and the source room is the smallest one. However, regarding only to rooms RT20, the source and receiving roles might be swapped. From measurements data and supposing no obstacles and the same hall absorption area, the biggest room equivalent volume changes to around 50[m3]. Therefore, it
becomes smaller than the hall.So, one can look at the opposite way as an equivalent situation where the receiving room is highly damped. No background noise level corrections were needed.
Vibration velocity levels measurements were performed according to Solidnoise™ method [5]. More measurements points than in previous cases are required. Space sampling takes place in all rooms walls: signal is acquired every 10m2 roughly, depending on boundary conditions. 126
points are managed in the classroom, and 42 points in the hall, instead of 20 points (10 microphone positions x 2 source positions) chosen in sound insulation tests in each room.The devices employed are professional and high precision ones:
• Sound source and power amplifier, Qohm and Qam type, from Qsources.
• Frequency analyser, Soundbook type, from Sinus.
• Omnidirectional condenser microphones, 40AF type, from GRAS.
• Microphone preamplifiers, 26AK type, from GRAS.
Figure 2. Two rooms studied reverberation time (RT20) comparison.
RESULTS AND DISCUSSION
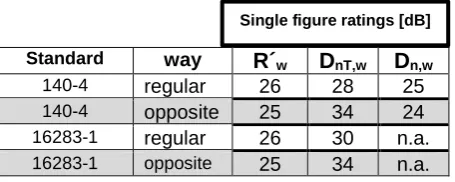
Firstly, single figure ratings calculated from measurements performed according to different standards and ways are, see Table 1:
Standard way
R´w
DnT,w
Dn,w
140-4 regular 26 28 25
140-4 opposite 25 34 24
16283-1 regular 26 30 n.a.
16283-1 opposite 25 34 n.a.
Table 1. Sound insulation single figure ratings within a 100Hz – 3150Hz frequency range.
There is a 4dB maximum difference between single figure ratings, R´w and DnT,w, when ISO
16283-1 is carried out in regular way. The rest keep that difference in a smaller range; even R´w
remain the same with both standards. When it comes to the opposite way, very similar results come from R´w and Dn w, in both ways, nevertheless a remarkable change it is shown with DnT,w;
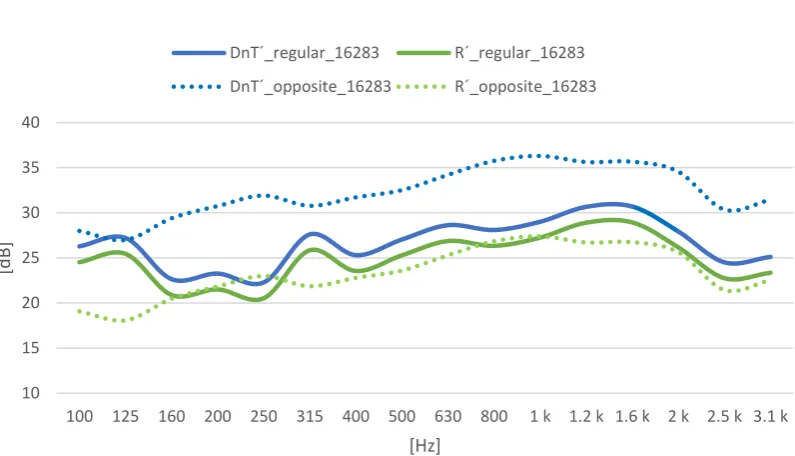
up to 4dB of difference regarding other indexes, and up to 9dB when calculating the opposite way. The analysis in one-third octave bands provides underlined differences, see Figures 3 y 4. Now, insulation indexes change in almost every single frequency band. There is a remarkable similarity between Dn and R´ values in both ways for ISO 140-4, although they remain slightly different
between ways. However, DnT index over-estimates sound insulation regarding the rest, mainly in
the opposite way with a large divergence. Comparing new ISO 16283, the general behaviour is like the previous standard. Remarkably, R´ and DnT are in slightly closer agreement when applying
new procedure, in the regular way in all the frequency range.
When working on Solidnoise™ method, it requires vibration measurements and a sound insulation test according to ISO 140-4 or ISO 16283-1 standards as well. This way, sound insulation curves and single figure ratings fully agree with classical pressure methods, in this case
Single figure ratings [dB]
0,0 0,2 0,4 0,6 0,8 1,0 1,2 1,4
100 125 160 200 250 315 400 500 630 800 1 k 1.2 k 1.6 k 2 k 2.5 k 3.1 k
[s]
[Hz]
[image:4.595.186.414.435.526.2]it used ISO 140-4. This vibration method adds every single wall contribution estimation to sound pressure level transmission from one room to another one, see Figure 5. More influential wall groups to sound transmission can be identified by verifying their lower sound insulation. So, side walls and the door are the more relevant elements radiating sound power, while the ceiling, for instance is not that important. Figure 5 shows group of walls in order to clarify data translation, but the method provides how every single element in a group contribute, linked to surface velocity vibration levels.
Figure 3. Airborne sound insulation ratings comparison, according to ISO 140-4, both ways.
Experiments environment was not the easiest one and even an unusual situation, regarding those ones included in the standard, has been forced. The test way is the more crucial one according to results. Although standards usually recommend the largest room as the source room, sometimes that requirement is relaxed to let tests be performed contrary to the regular way: a test way change is allowed when the smaller room has a more regular size. Moreover, an increased damping in a room recommends a virtual volume reduction for calculation because of excess in pressure level attenuation. In this case, in RT20 terms, the largest room is equivalent to a smallest one. All these circumstances make that reverberation time can have relevant changes that involve results depending on the way data is processed; mostly D´nT. Considering that RT20 links sound
pressure and sound power regarding the sound insulation tests described, it is clear that one might obtain results biased by the way calculations are worked out and not only by the sound transmission loss phenomenon itself.
DnT disagrees vastly with the other ratings. Main reasons are: difference between rooms
reverberation times, their lack of a perfect diffuse sound field, an RT20 estimation uncertainty. Non-perfect diffuse rooms are a very usual feature in real world rooms, and it should be borne in mind when interpreting testing results. It has been verified sound insulation over estimation depending on rating and testing way chosen. Between these two analysed rooms there are important differences in RT20, although wall materials are very similar, because of furniture and equipment indoors in one of them; volumes are different as well. DnT sensitivity to those RT20
changes in these circumstances is much higher than R´ o Dn ones, since the latter are using more
stable and robust variables in their calculation algorithm as wall area (Equivalent absorption area, A with Dn and R´), and separating element area (R´).
10,0 15,0 20,0 25,0 30,0 35,0 40,0
100 125 160 200 250 315 400 500 630 800 1 k 1.2 k 1.6 k 2 k 2.5 k 3.1 k 4 k 5 k
[d
B]
[Hz]
DnT´_regular_140 Dn´_regular_140 R´_regular_140
DnT´_opposite_140 Dn´_opposite_140 R´_opposite_140
10,00 15,00 20,00 25,00 30,00 35,00 40,00
100 125 160 200 250 315 400 500 630 800 1 k 1.2 k 1.6 k 2 k 2.5 k 3.1 k
[d
B]
[Hz]
DnT´_regular_140 Dn´_regular_140 R´_regular_140
Figure 4. Airborne sound insulation ratings comparison, according to ISO 16283-1, both ways.
Figure 5. Walls sound transmission lost contribution comparison by Solidnoise® method, and its software Noiselab®, regular way.
Besides, this kind of insulation test aim to provide with separating element airborne sound insulation but it really shows the room insulation. That means, far from having one element transmission lost, all flanking elements sound transmission contribution influence the ratings and are considered. Working with sustainable insulation design requires knowledge about every direct and flanking contribution. This target was achieved in this study through SolidNoise™ method, acquiring both pressure and vibration signals. Nevertheless, vibration procedure checking indicates a standout increase in, regarding classical pressure methods: number of measurements,
10 15 20 25 30 35 40
100 125 160 200 250 315 400 500 630 800 1 k 1.2 k 1.6 k 2 k 2.5 k 3.1 k
[d
B
]
[Hz]
DnT´_regular_16283 R´_regular_16283
[image:6.595.90.544.451.628.2]processed and analysed; and, some extra equipment. All those drawbacks may cause a less moderate test talking about resources, despite the fact of the crucial progress in proper and efficient solution designs.
So, after all the previous discussion, a sustainable proposal could be the following ones:
• Certification tests: use of ISO 16283, with R´.
o Certification and building legal codes verification.
o Diffuse sound fields.
o Rooms layout cases included in standards.
• Design tests: use of SolidNoise™ and ISO 16283, with R´.
o Efficient solution design.
o Uncertain diffuse sound fields.
o Complex rooms layouts.
Anyway, it is decisive the need of a wide and deep knowledge of standards features and theory facts that support them by engineers who carry out with testing. To know restrictions and behaviour about methods, let us consider proper experiments and obtain right results. It is not enough to learn procedures steps by heart.
CONCLUSIONS
Agreement among sound insulation single figure rating and in one-third octave bands have been quantified by experiments results. Differences among them are quite clear, so a straight comparison could lead to confusing and even wrong conclusions. In sustainability terms, classical pressure methods present some hesitations. The results range dependent on a wide range of variables, often out of control, let indexes comparison be biased. The alternative vibration based method provides additional relevant data in an efficient design framework, at the expense of spending more resources; but It does not solve all pressure procedures drawbacks.
Regarding a reasonable industry testing and resources use, it is necessary to study more robust methods proposals. Sound pressure level measurements in non-perfect diffuse sound fields lead to divergent results among classical procedures: to obtain representative reverberation times, and even source/receiving levels can be a complex task sometimes. Besides, that drawback is underlined in low frequency range, exactly where sound insulation problems use to be more serious. From 50Hz to 100Hz, not in the scope of this study, diffusivity problems are expected to be even greater. Vibration signals are confirmed as very valuable ones in building acoustics, in spite of resources use increase. Some further future research lines are suggested supported by results obtained through this paper. The main idea is try achieving data convergence and sound insulation tests sustainability:
• To study or review methods and their accuracy when estimating airborne sound insulation only by vibrations signal means, without any pressure measurement.
• To analyse the chances of decreasing remarkably resources devoted to vibration measurements to determine relevant partitions features:
o Spatial and time sampling reduction.
o Accelerometer probes use.
REFERENCES
[1] ISO 140 - Acoustics - Measurement of sound insulation in buildings and of building elements -(parts 1- 18). n.d 1998-2006. International Standardisation Body;
[2] ISO 16283-1:2014 Acoustics—Field measurement of sound insulation in buildings and of building elements—Part 1: Airborne sound insulation. International Organization for Standardization; 2014.
[3] Rosao, V. et alt. “ISO 16283 versus ISO 140-4”. EuroRegio2016, Porto/Portugal; 2016 [4] Ministerio de Fomento, Gobierno de España. Código Técnico de la edificación (CTE). Documento básico HR, Protección frente al ruido (DB-HR); 2009.
[5] Aniorte Pérez, José Antonio y Domingo Bets, Salvador. “Método matricial para la ingeniería de aislamiento acústico”. 41º Spanish Congress on Acoustics, Tecniacústica León; 2010.
[6] Rosao, V. et Carreira, A. “Use of vibration measurements to determine the most suitable locations to improve sound insulation in buildings”. The 21st Congress on Sound and Vibration
(ICSV), Beijing/China; 2014.
[7] San Millán-Castillo, Roberto; Domingo Bets, Salvador; Pavón García, Ignacio. “Evolución de una sonda de vibraciones para simplificar la evaluación de transmisión sonora por flancos entre recintos”. 46º Spanish Congress on Acoustics, Tecniacústica Valencia; 2015.
[8] Patil, Nikhilesh, Andy Moorhouse, and Andy S. Elliott. "Blocked pressure based Transfer Path
Analysis (TPA) method to diagnose airborne sound transfer through building partitions." The
Journal of the Acoustical Society of America141.5 (2017): 3596-3596.
[9] ISO 15186 - Acoustics—Measurement of sound insulation in buildings and of building elements using sound intensity - Parts 1 to 3 - 2000-2003.
[10] Rodríguez Fernández, Cástor; San Millán-Castillo, Roberto; Fernández-Comesaña, Daniel. “On the use of acoustic particle velocity to face airborne sound insulation”. 48º Spanish Congress on Acoustics, Tecniacústica A Coruña; 2017.
[11] Hopkins, Carl, and P. Turner. “Field measurement of airborne sound insulation between
rooms with non-diffuse sound fields at low frequencies.” Applied Acoustics 66.12 (2005):
1339-1382
[12] Prato, Andrea, Federico Casassa, and Alessandro Schiavi. “Reverberation time measurements in non-diffuse acoustic field by the modal reverberation time.” Applied Acoustics 110 (2016): 160-169.
[
13] Harvie-Clark, Jack, Nicholas Dobinson, and Richard Hinton. “Acoustic response in non-diffuse rooms.” Proc. Euronoise. 2012.[14] Mašović, Draško, and Mete Öğüç. “Analysis of reverberation time field measurement results in building acoustics.” Telfor Journal 5.2 (2013): 145-150.
[15] Rosao, V. et alt. “Comparing results of using ISO 140-4:1998 to ISO 16283-1:2014”. The 21st
Congress on Sound and Vibration (ICSV), Florence/Italy; 2015