COUPLING EFFECTS IN CHRISTIAN CHURCHES: PRELIMINARY
ANALYSIS BASED ON A SIMPLE THEORETICAL MODEL AND SOME
EXPERIMENTAL RESULTS
PACS: 43.55.+p
A. Magrini* P. Ricciardi**
*
Dipartimento di Ingegneria Idraulica ed Ambientale
,Facoltà di Ingegneria, Università
di Pavia
Via Ferrata 1 27100 Pavia Italy
Tel: ++390382505321 Fax: ++390382505589 magrini@unipv.it
**Laboratoire Ondes et Acoustique, E.S.P.C.I.,
10 Rue Vauqueline75231 Paris France
Tel: ++33(0)140794692 Fax: ++33(0)140794468 paola.ricciardi@loa.espci.fr
ABSTRACT
Ancient worship buildings usually present articulated environments, such as lateral chapels, where the effect of acoustic coupling rooms can influence the sound field. In the acoustically coupled rooms, reverberation times are fairly different from the ones measured without mutual power flow interactions through coupling areas.
A preliminary investigation on the presence of coupling effects has been performed. Experimental values, measured in the lateral chapels of 3 Italian churches (XI-XVI sec) and in the corresponding coupled volumes of the selected environments, have been considered and compared with computed data given by a simple theoretical SEA (Statistical Energy Analysis) model. Application conditions and limitation of the model are discussed.
INTRODUCTION
Two rooms can be considered ‘acoustically coupled’ when reverberation times of the two environments with an opening connecting area are fairly different from independently measured ones without any coupling area.
application of the detection of “coupling phenomena” is represented by the possibility to modify the main acoustic field by closing or making more absorbent these lateral ”coupled” chapels.
The study has been carried out on the basis of experimental results and by applying a SEA model suitable for acoustically coupled rooms, in order to verify the effect of coupling on the variation of acoustic field in the environment. The aim of this work is the application and validation of a SEA model in order to develop a useful tool to theoretically put in evidence the possibility of coupling effects, especially for the energy decay curve predictions (reverberation times).
THE SELECTED CHURCHES
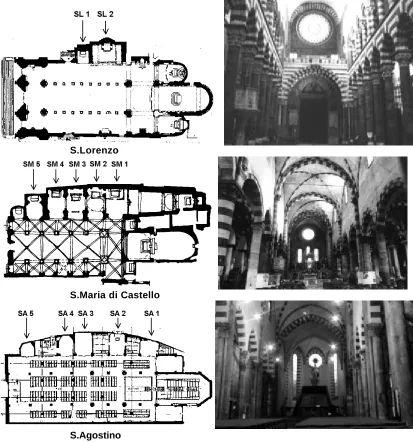
The present investigation is based on the experimental analysis of the main acoustical parameters in the three churches shown in figure 1.
S.Lorenzo
S.Maria di Castello
[image:2.596.86.499.246.688.2]S.Agostino
Figure 1 – Plans and interior pictures of the examined churches. Lateral chapels are indicated on each plan.
S. Lorenzo is the Cathedral of the city of Genova: the first nucleus was built in 1118, in XIII century the building was transformed from Romanesque to Gothic style.
S.M. di Castello was founded before 1130 and even though it was mutated in various centuries till the XX century, the Romanesque style is prevalent.
S. Agostino is of the XI- XII century in Romanesque-Gothic style and recently converted into auditorium.
As indicated in figure 1, the lateral chapels are differently positioned: S.Lorenzo has only two chapels (SL1, SL2). The other two churches, S.Maria di Castello and S. Agostino, are characterised by lateral chapels, distributed all on the left side: in S.Agostino three of them are closed (respectively, SM1 ÷ SM5, SA1 ÷ SA5).
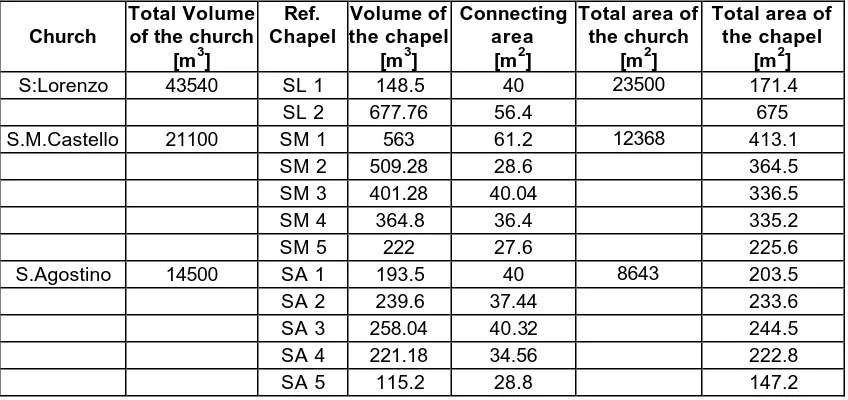
[image:3.596.86.510.223.423.2]Dimensional parameters of the churches and the considered chapels are shown in Table 1.
Church
Total Volume of the church
[m3]
Ref. Chapel
Volume of the chapel
[m3]
Connecting area
[m2]
Total area of the church
[m2]
Total area of the chapel
[m2]
S:Lorenzo 43540 SL 1 148.5 40 23500 171.4
SL 2 677.76 56.4 675
S.M.Castello 21100 SM 1 563 61.2 12368 413.1
SM 2 509.28 28.6 364.5
SM 3 401.28 40.04 336.5
SM 4 364.8 36.4 335.2
SM 5 222 27.6 225.6
S.Agostino 14500 SA 1 193.5 40 8643 203.5
SA 2 239.6 37.44 233.6
SA 3 258.04 40.32 244.5
SA 4 221.18 34.56 222.8
SA 5 115.2 28.8 147.2
Table 1 - Geometrical characteristics of the considered environments
MEASUREMENTS
The measurement technique has already been described in former works [5, 6, 7].
In order to detect the presence of coupling effects, reverberation times of the whole selected churches (mean values among the various measurements points) have been compared with the ones of the different chapels. For the lateral chapels, the measurement points are positioned in the centre of each one, indicated in Figure 1. The coupled room effect has been assumed for a minimum difference of 0.4-0.5 s between the experimental values measured in the chapels and the ones that characterise the whole environment. The range of frequencies from 63 to 8000 Hz has been investigated.
The coupling effect seems more significant in the field of the low frequencies, up to 500 Hz, and related to the EDT (Early Decay Time) rather than the TR20 (Reverberation Times calculated on the decay of the first 20 dB). This is a confirmation of scientific works on the topic [3,4] which put in evidence that the main coupling effects especially affect the very first instances of the decay curve (50-100 ms), when the first reflections are important.
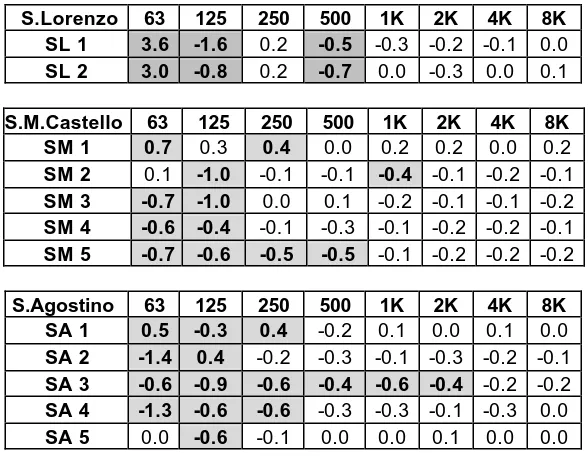
In the Table 2 the differences between EDT of the main body of the church and the one measured in the chapels are indicated for the frequencies examined.
S.Lorenzo 63 125 250 500 1K 2K 4K 8K SL 1 3.6 -1.6 0.2 -0.5 -0.3 -0.2 -0.1 0.0 SL 2 3.0 -0.8 0.2 -0.7 0.0 -0.3 0.0 0.1
S.M.Castello 63 125 250 500 1K 2K 4K 8K SM 1 0.7 0.3 0.4 0.0 0.2 0.2 0.0 0.2 SM 2 0.1 -1.0 -0.1 -0.1 -0.4 -0.1 -0.2 -0.1 SM 3 -0.7 -1.0 0.0 0.1 -0.2 -0.1 -0.1 -0.2 SM 4 -0.6 -0.4 -0.1 -0.3 -0.1 -0.2 -0.2 -0.1 SM 5 -0.7 -0.6 -0.5 -0.5 -0.1 -0.2 -0.2 -0.2
[image:4.596.150.444.69.297.2]S.Agostino 63 125 250 500 1K 2K 4K 8K SA 1 0.5 -0.3 0.4 -0.2 0.1 0.0 0.1 0.0 SA 2 -1.4 0.4 -0.2 -0.3 -0.1 -0.3 -0.2 -0.1 SA 3 -0.6 -0.9 -0.6 -0.4 -0.6 -0.4 -0.2 -0.2 SA 4 -1.3 -0.6 -0.6 -0.3 -0.3 -0.1 -0.3 0.0 SA 5 0.0 -0.6 -0.1 0.0 0.0 0.1 0.0 0.0
Table 2 – EDT: difference between mean and local values as function of frequencies. Differences higher than 0.3 are highlighted.
THE SEA MODEL
The phenomenon of acoustically coupling rooms has been widely investigated by some authors [3, 4], using the Statistical Energy Analysis (SEA) model. The developed mathematical model is based on approximations and numerical integration of corresponding systems of ordinary first order differential equations; it is based on the assumption of a diffusive field.
S.Lorenzo 63 125 250 500 1K
SL (medium values) 0.039 0.047 0.044 0.045 0.051 SL 1 0.035 0.018 0.021 0.020 0.023 SL 2 0.035 0.023 0.024 0.022 0.027
S.M.Castello 63 125 250 500 1K SM (medium values) 0.098 0.071 0.059 0.055 0.057
SM 1 0.102 0.062 0.051 0.045 0.047 SM 2 0.084 0.047 0.047 0.044 0.043 SM 3 0.055 0.040 0.041 0.040 0.038 SM 4 0.051 0.042 0.036 0.033 0.036 SM 5 0.045 0.036 0.031 0.029 0.033
S.Agostino 63 125 250 500 1K
[image:4.596.152.445.434.699.2]SA (medium values) 0.068 0.077 0.086 0.098 0.097 SA 1 0.045 0.040 0.056 0.052 0.057 SA 2 0.031 0.054 0.049 0.054 0.056 SA 3 0.037 0.038 0.046 0.054 0.050 SA 4 0.031 0.039 0.042 0.053 0.052 SA 5 0.031 0.030 0.039 0.046 0.045
Table 3 – The absorption coefficients αexp, calculated from experimental Reverberation Time by
The model has been applied to the examined churches, having 12 chapels in total, in order to obtain a first confirmation on the accuracy of the simulation of reverberation times in these particular kind of environments.
The input data needed for this simulation are the following ones: volumes of the two coupled rooms (main body of the church and chapel), connecting surfaces, opening surfaces, transmission coefficients of the connecting and opening surfaces and the absorption coefficients for the considered frequencies. The output is the energy decay curve of both the rooms in each case. In particular, the connecting surface is the area which connects the two rooms and the opening surface is usually an arch; the absorption coefficients αexp have been obtained by the
application of the Sabine formula, on the hypotheses of a diffusive sound field, by means of the measured values of reverberation times. Table 3 shows the calculated input data.
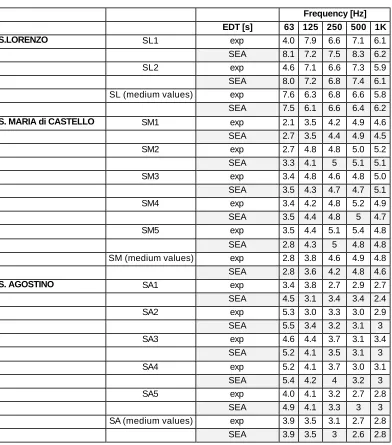
COMPARISON BETWEEN MEASURED AND COMPUTED DATA
In order to validate the reliability of the model, the simulation and the experimental results are compared. The results are shown in Table 4 and a good agreement between simulated and measured data can be observed; in some cases, results of the chapels more distant from the source are less reliable.
Frequency [Hz] EDT [s] 63 125 250 500 1K S.LORENZO SL1 exp 4.0 7.9 6.6 7.1 6.1
SEA 8.1 7.2 7.5 8.3 6.2
SL2 exp 4.6 7.1 6.6 7.3 5.9
SEA 8.0 7.2 6.8 7.4 6.1 SL (medium values) exp 7.6 6.3 6.8 6.6 5.8
SEA 7.5 6.1 6.6 6.4 6.2
S. MARIA di CASTELLO SM1 exp 2.1 3.5 4.2 4.9 4.6
SEA 2.7 3.5 4.4 4.9 4.5
SM2 exp 2.7 4.8 4.8 5.0 5.2
SEA 3.3 4.1 5 5.1 5.1
SM3 exp 3.4 4.8 4.6 4.8 5.0
SEA 3.5 4.3 4.7 4.7 5.1
SM4 exp 3.4 4.2 4.8 5.2 4.9
SEA 3.5 4.4 4.8 5 4.7
SM5 exp 3.5 4.4 5.1 5.4 4.8
SEA 2.8 4.3 5 4.8 4.8
SM (medium values) exp 2.8 3.8 4.6 4.9 4.8
SEA 2.8 3.6 4.2 4.8 4.6
S. AGOSTINO SA1 exp 3.4 3.8 2.7 2.9 2.7
SEA 4.5 3.1 3.4 3.4 2.4
SA2 exp 5.3 3.0 3.3 3.0 2.9
SEA 5.5 3.4 3.2 3.1 3
SA3 exp 4.6 4.4 3.7 3.1 3.4
SEA 5.2 4.1 3.5 3.1 3
SA4 exp 5.2 4.1 3.7 3.0 3.1
SEA 5.4 4.2 4 3.2 3
SA5 exp 4.0 4.1 3.2 2.7 2.8
SEA 4.9 4.1 3.3 3 3
SA (medium values) exp 3.9 3.5 3.1 2.7 2.8
[image:5.596.103.495.287.732.2]SEA 3.9 3.5 3 2.6 2.8
In addition, a further development has been carried out in order to estimate the applicability of the SEA model when the αexp is not available: in such a case a theoretical α is
considered as input data.
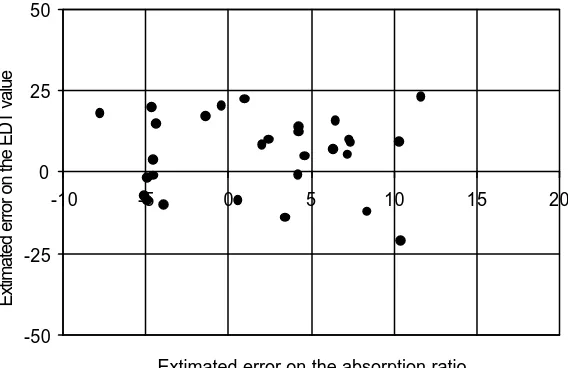
The estimation of the error (Ea) has been evaluated taking into account the
experimental (Re) and assumed (Ra) ratio between the absorption coefficients of the two
coupled rooms: Ea = (Re-Ra)/Re. In Figure 2 the relationship between the estimated error on the
absorption ratio (Ea) and the one referred to the corresponding EDT values (Ev= (EDTe-EDTa)/
EDTe) is shown. For an error –10%<Ea<+15% the matching EDT error is –25%<Ev<+25%.
-50 -25 0 25 50
-10 -5 0 5 10 15 20
Extimated error on the absorption ratio
[image:6.596.156.440.178.362.2]Extimated error on the EDT value
Figure 2 - Relationship between the estimated error on the absorption ratio (Ea in %) and the
one referred to the corresponding EDT values (Ev in %)
CONCLUSIONS
The SEA model used in this analysis can be useful tool for a preliminary investigation on the presence of coupling effects in lateral chapels of a church. In such a case, during a design phase or for the acoustical restoration of the environment, it could be useful to consider the more convenient means to reduce or to amplify the sound in these areas. Introducing more or less absorbent materials in a lateral chapel the whole acoustic response of the whole church can vary. Therefore this type of solution can be verified by means of the SEA model here applied. A deeper research is currently under development to reach useful information that can correlate the style of construction and the more appropriate absorbing coefficients.
REFERENCES
[1] D. Faggiani, ‘L’assorbimento acustico delle cavità durante il decremento’, Convegno Fisici
Tecnici, Italy, 1936.
[2] L. Cremer, H. A. Muller, T. J. Schultz, Principles and application of Rooms acoustics, Applied Science Publishers London and New York, 1982.
[3] M. Ohta, H. Yamada, H. Iwashige, Journal Acoust. Soc. Jpn. (E) 16, 137-145, (1995). [4] J. S. Anderson, M. B. Anderson, Journal of Sound and Vibrations, 208, 313-329, (1997). [5] A.Magrini, P.Ricciardi “Preliminary investigation on acoustical parameters in churches",
7°Internation Congress Sound&Vibration, Garmisch-Partenkirchen, Germany (2000).
[6] A.Magrini, P.Ricciardi “Acoustical parameters distribution in historical buildings with a complex geometry” InterNoise 2000, Nizza, France, (2000).