Fast growth involves high dependence on stored resources for shoot growth in Mediterranean evergreen trees
42
0
0
Texto completo
(2) Fast growth involves greater use of stored resources for seedling spring shoot growth in Mediterranean evergreen trees Mercedes Uscola 1,2*; Pedro Villar-Salvador 1; Patrick Gross 3; Pascale Maillard 3. 1 Forest Ecology and Restoration Group, Departamento de Ciencias de la Vida, U.D. 11 Ecología, Apdo.. 20, Universidad de Alcalá, E-28805, Alcalá de Henares, Madrid, Spain 2. Current address: Department of Forestry and Natural Resources, Pfendler Hall of 13 Agriculture, 126,. Purdue University, West Lafayette, IN 47907-2061, USA 3. UMR INRA-UHP 1137 Ecologie et Ecophysiologie Forestières, IFR 110. "Génomique, Ecophysiologie Forestière et Ecologie Fonctionnelle", Centre de Nancy 16. Lorraine,. France. *Author for correspondence [email: [email protected]] Submitted to Annals of Botany on 24 November, 2014 Text pages 30, 1 Table, and 4 Figures Supplementary material: 1 Table and 2 Figures. 24. Abstract. 25. •Background and Aims The carbon (C) and nitrogen (N) needed for plant growth can either come from. 26. soil N and current photosynthesis or through remobilization of stored resources. The contribution of. 27. remobilization to new organ growth on a whole plant basis is quite well known in deciduous woody. 1.
(3) 28. plants and evergreen conifers but this information is very limited in broadleaf evergreen trees. We. 29. compared the contribution of remobilized C and N to the construction of new organs in spring, and the. 30. importance of different organs as C and N sources in one-year-old potted seedlings of four ecologically. 31. distinct evergreen Mediterranean trees: Quercus ilex, Q. coccifera, Olea europaea and Pinus. 32. hapelensis.. 33. •Methods We used a dual 13C and 15N isotope labeling, to disentangle the contribution of currently taken. 34. up and stored C and N to new growth. Stored C was labeled under simulated winter conditions.. 35. •Key results Oaks allocated most C assimilated under simulated winter conditions in coarse roots while. 36. O. europaea and P. halepensis allocated it in the leaves. Remobilization was the main N source (>. 37. 74%) for new fine root growth in early spring but by mid spring, soil supplied most of N required for. 38. new growth (> 64%). Current photosynthesis supplied > 60% of the C in new fine roots by mid spring. 39. in most species. Across species, the proportion of remobilized C and N in new shoots increased with. 40. relative growth rate. Quercus species, the slowest growing trees, primarily used currently acquired. 41. resources while P. halepensis, the fastest growing species, mainly used reserves. Increase in the amount. 42. of stored N increased N remobilization, which fostered absolute growth both within and across species.. 43. Old leaves were major sources of remobilized C and N but stems and roots also supplied considerable. 44. amounts of both compounds in all species except in P. halepensis, which mainly relied on foliage. 45. formed in the previous growing season to supply stored resources.. 46. • Conclusions Seedlings of Mediterranean evergreen trees have distinct C and N storage physiology. 47. with growth speed driving the contribution of remobilized resources to new growth.. 48. Key words: 13C; labeling; 15N; Olea europaea; Pinus halepensis; Quercus ilex; Quercus coccifera;. 49. remobilization; reserves.. 2.
(4) 50. 1. Introduction. 51. Growth and reproduction in trees consume considerable amounts of carbon (C) and nitrogen (N), which. 52. are derived from photosynthesis and soil N absorption and/or the remobilization of internal reserves. 53. (Chapin III et al. 1990; Nambiar and Fife 1991; Körner 2003; Millard and Grelet 2010; Brüggemann et. 54. al. 2011). Although C and N metabolism are interrelated, storage physiology of both nutrients has. 55. important differences. For instance, woody plants store nonstructural C in all organs and remobilization. 56. of C reserves is controlled by sink strength. In contrast, storage of N tends to be concentrated in specific. 57. organs and N remobilization mainly is source-driven, i.e. it depends upon the amount of stored N. 58. (Millett et al. 2005; Millard and Grelet 2010).. 59. Storage of C and N is related to leaf habit. Evergreens allocate higher amounts of mobile C to. 60. the leaves than do deciduous plants (Chapin III et al. 1990; Cerasoli et al. 2004; Palacio, Millard, et al.. 61. 2007), and can assimilate C in winter that contributes to C stores (Hansen et al. 1996; Cerasoli et al.. 62. 2004; Kuptz et al. 2011). Conversely, deciduous species tend to store N in woody organs (Millard and. 63. Proe 1991; Millard 1996; Silla and Escudero 2003) while leaves, especially the youngest ones, are. 64. major N storage sites in evergreen species (Nambiar and Fife 1991; Silla and Escudero 2003).. 65. Resprouting ability also affects C and N storage patterns: resprouters generally allocate more C and N. 66. to the roots than do nonsprouting species (Palacio, Maestro, et al. 2007).. 67. Studies on the contribution of remobilization to new growth at a whole plant scale have mostly. 68. focused on deciduous broadleaf woody species and evergreen conifers (see review by Millard and. 69. Grelet 2010 and Brüggemann et al. 2011). Little information exists for evergreen broadleaf species (see. 70. Cerasoli et al., 2004; Grelet et al., 2001; Silla and Escudero, 2003), even though they are major. 71. components of several forests ecosystems worldwide, such as the Mediterranean and tropical biome. 72. (Archibold 1995). Overall, remobilization of stored resources is often coupled to plant phenology (Hoch. 73. et al. 2003; Körner 2003; Milla et al. 2005) and it also depends upon plant age, life form, growth pattern,. 3.
(5) 74. climatic conditions, competition and depredation (Chapin III et al. 1990; Maillard et al. 2001; Salifu. 75. and Timmer 2003; Millett et al. 2005; Palacio et al. 2014). Plants with a continuous shoot elongation. 76. pattern may adjust their resource demand to the acquisition of external resources. In contrast, plants. 77. with an episodic shoot growth pattern would depend more on reserves as resource demand is strongly. 78. concentrated in a short period (Canham et al. 1999; Salifu et al. 2009). The remobilization of C reserves. 79. seems to be more dependent on foliar habit than N remobilization. Specifically, deciduous woody plants. 80. seem to greatly rely on C remobilization for early shoot and root growth (Dickson et al. 1990; Sloan. 81. and Jacobs 2008; Vizoso et al. 2008; Keel and Schädel 2010). For conifers, however, current. 82. photosynthesis seems to be the main C source that fuels early root and shoot growth and stored C. 83. becomes more important when current photosynthesis is suppressed (Philipson 1988; van den Driessche. 84. 1991; Atzmon et al. 1994; Hansen et al. 1996; Brüggemann et al. 2011). However, differences in C. 85. remobilization between evergreen and deciduous species may be smaller than initially expected and. 86. overridden by inter-species variability (Keel and Schädel 2010; Brüggemann et al. 2011). As. 87. comparative studies on C and N remobilization carried out under similar growth conditions and at the. 88. whole-plant scale are scarce (Millard et al. 2001; Grelet et al. 2001; Silla and Escudero 2003; Palacio. 89. et al. 2014) this makes difficult to draw general ecological patterns on storage physiology.. 90. Several studies have addressed the remobilization of stored resources in Mediterranean woody. 91. plants (Cherbuy et al. 2001; Silla and Escudero 2003; Milla et al. 2005). However, most of these studies. 92. have analyzed remobilization at the branch or leaf level or did not use labeled C or N. This prevents. 93. knowing the relative importance of the different plant organs as sources of remobilized C and N and. 94. disentangling the contribution of remobilized and current N and C uptake to new growth (Millard 1996).. 95. We compared the importance of C and N remobilization for spring growth in the seedlings of. 96. four evergreen woody species that coexist in Mediterranean forests and exhibit important functional. 97. and ecological differences: Quercus ilex subsp. ballota (Desf.) Samp. (holm oak), Quercus coccifera. 4.
(6) 98. L. (kermes oak), Olea europaea L. (olive) and Pinus hapelensis Mill. (Aleppo pine). Specifically, we. 99. investigated whether these species differed in: (1) the allocation pattern of winter-assimilated C; (2) the. 100. relative contribution to early growth of new roots and shoots of stored C and N vs. current. 101. photosynthesis and N uptake; and (3) the importance of different organs as sources of C and N. Three. 102. species are shade tolerant broadleaves with resprouting capacity: Q. ilex is a late-successional tree that. 103. dominates many forest communities in the Mediterranean basin; Q. coccifera is a slow growing shrub. 104. or small tree common in holm oak and Aleppo pine forests and is a main component of mature plant. 105. communities on semiarid sites; O. europaea is a mid-successional species and is quite common in holm. 106. and cork oak forests on mild winter sites. Finally, P. halepensis is a fast-growing, shade-intolerant. 107. pioneer non-resprouting conifer, and is very common in disturbed and shallow soils on dry sites in the. 108. Mediterranean basin (Blanco et al. 1998). Quercus species have strong tap roots that store large amounts. 109. of resources and their shoot growth pattern is episodic, while O. europaea and P. halepensis lack strong. 110. tap roots and show a polycyclic shoot elongation pattern (Sánchez-Gómez et al. 2006; Willaume and. 111. Pagès 2006; Girard et al. 2010). We hypothesized that Quercus species would be highly dependent on. 112. remobilized resources to support new growth in spring, and would preferentially use C and N stored in. 113. the roots. We assumed that P. halepensis and O. europaea would rely more on currently acquired. 114. resources. To test these hypotheses, we performed an experiment where seedling C reserves and soil N. 115. were labeled with 13C and 15N, respectively. This allowed us to identify and follow through development. 116. stage the contribution to the growth of new organs of remobilized C and N, and of current. 117. photosynthesis and N uptake.. 5.
(7) 118. 2. Material and methods. 119. 2.1. Plant material. 120. We used one-year-old seedlings, as this development stage is the most critical for plant population. 121. dynamics (Pulido and Díaz 2005). Plants were grown for one year in the nursery of the Centro Nacional. 122. de Recursos Genéticos Forestales "El Serranillo" in Guadalajara. 123. (Spain). Seeding was done in early spring 2003 and the first year cultivation ended in late fall 2003. All. 124. plants were cultivated in ®Forest Pot containers (Nuevos Sistemas de Cultivo S.L., Girona, Spain) that. 125. has 50 cavities of 300 ml, which were filled with unfertilized peat moss (Kekkilä B0, Kekkilä Oyi,. 126. Finland). Seedlings were fertilized weekly for five months from early May 2003 with a 20:3:16, N-P-. 127. K water-soluble fertilizer and irrigated every 2–4 days. Most of the cultivation was carried outdoors. 128. under full sun conditions but to avoid spring frosts, seedlings were cultivated in a greenhouse until mid. 129. May 2003. When seedlings were 11 months old (early January 2004), 60 plants per species were moved. 130. to the INRA Institute (Champenoux, France) and placed for 1 month in a controlled environmental. 131. chamber (Dagard, Chambres froides modulables, 23600 Boussac, France) for winter acclimation. Day. 132. and night chamber temperatures were 8 and 3 °C, respectively, similar to temperatures at many inland. 133. Iberian Peninsula locations during winter. The photoperiod was 8h, relative humidity 50–95% and the. 134. photosynthetic photon flux density (PPF) was 250 μmol m−2 s−1. Seedlings were kept well watered and. 135. were not fertilized during this stage. As contribution of the C and N reserves for the new growth was. 136. assessed in the second year, we confidently consider that results were not affected by seed carry over. 137. effects (Lehmeier et al.. 138. 2005; Villar-Salvador et al. 2010).. 139. 2.2. Labeling procedure. 140. Fifty-six seedlings per species, homogeneous in size, were chosen for the experiment. Carbon reserves. 141. were 13C-labeled by subjecting the seedlings to an enriched 13CO2 atmosphere under simulated winter 6.
(8) 142. temperature conditions. We 13C-labeled seedlings under simulated winter conditions because we aimed. 143. to assess if winter is a high C storage period in evergreen woody species growing under typical. 144. Mediterranean continental winter conditions, and because labeling under typical spring conditions has. 145. more logistic limitations than performing it under simulated winter conditions. As seedlings showed no. 146. growth symptoms both in shoots and roots under simulated winter conditions, we assumed that. 147. assimilated C was mostly stored as mobile C rather than transformed into structural carbohydrates.. 148. Thirty-six seedlings per species were submitted to four. 149. March 2004 in a controlled environment chamber (VTPH 5/1 000, Vötsch Industrie-technik GmbH,. 150. Reiskirchen-Lindenstruth, Germany) operating as a semi-closed system (for a full description see Vivin. 151. et al. 1995), and exposed to 13CO2-enriched air (4.4 atom% 13C) at a constant CO2 concentration of 500. 152. ppm. Each labeling cycle took 4 days, and each species was labeled for. 153. 24 h. The roots were kept isolated from the shoots to prevent any dilution of the enriched 13CO2. 154. atmosphere through root respiration. Chamber temperature, relative humidity and PPF were 8±1 °C,. 155. 77% and 500 μmol m−2 s−1, respectively. Between labeling cycles, the saplings were returned to the. 156. growth chamber, under the simulated winter conditions described above.. 157. The remaining unselected seedlings were not labeled and were kept under the same simulated winter. 158. conditions in a different growth chamber.. 13. C labeling cycles from 9th February to 11th. 159. On March 15 2004, seedlings were transplanted into 3L pots (one seedling per pot) filled with. 160. perlite and transferred to a ventilated transparent greenhouse (INRA, Champenoux, France) to promote. 161. growth. Plants were arranged in four blocks of eight labeled and three unlabeled seedlings per species.. 162. We supplied seedlings with a high fertilization regime to maximize growth. Conversely, soil fertility. 163. has little influence on N remobilization (Grelet et al. 2003; Villar-Salvador et al. 2010). From March. 164. 24 to the end of the experiment on May 2004, each seedling was fertilized daily with 40-80 ml of a. 165. complete nutrient solution (Le Blevennec 1986). The nutrient solution contained (mg l-1): KNO3 (101);. 7.
(9) 166. Ca(NO)2 (345); K2HPO4 (75); H2KPO4 (96); MgSO4 7H20 (270); NaCl (10), Mn (0.2), Zn (0.10), Cu. 167. (0.012), B (0.10), Mo (0.025) and Fe (2.5). At the end of the experiment, fertilization supplied. 168. approximately 12.5 g N m-2. Labeled seedlings were fertilized with the same solution labeled at 2. 169. atom%. 170. Columbia, USA).. 171. 2.3. Sampling. 172. The plants were harvested at three developmental stages:. 173. t0: Before transplanting to the 3L pots and 15N labeling, seedlings showed no growth as they remained. 174. 15. N (K15NO3,. 15. N > 98 atom%, Spectra Stable Isotopes, Division of Spectra Gases Inc.,. under cool conditions.. 175. t1: Seedlings had not yet started shoot elongation but had produced significant amounts of new roots,. 176. most of which had protruded the plug into the perlite. Most P. halepensis, O. europaea, Q. ilex, and. 177. Q. coccifera seedlings reached this stage 21, 23, 26 and 31 days after transplanting, respectively.. 178. t2: First shoot flush of growth had ceased and most leaves were completely unfolded and mature. Most. 179. seedlings in P. halepensis, O. europaea and Q. ilex reached this stage 44 days after transplanting. 180. (t0), while Q. coccifera plants reached this stage 59 days after transplanting.. 181. Minimum and maximum average temperatures were 11 and 23ºC, respectively at t1, and 14 and. 182. 28 °C, respectively at t2. At each development stage, 10 labeled and four unlabeled seedlings per species. 183. were harvested and their roots were carefully washed in tap water to eliminate growing medium, and. 184. then rinsed with de-ionized water. Roots were separated into coarse and fine roots. Coarse roots (≥ 2. 185. mm in diameter) were only found inside the plugs. Fine roots (< 2 mm in diameter) were classified as. 186. protruding fine roots, when they grew out of the plug into the surrounding growing medium and plug. 187. fine roots, when they appeared inside the plug. All protruding fine roots were originated during the. 188. experiment. Most of the plug fine roots originated during the previous growing season in the nursery. 189. but a small fraction of the plug fine roots were formed during the experiment (Figure 1). Shoots were. 8.
(10) 190. divided into two parts: stems and leaves that originated in the previous growing season (hereafter stems. 191. and old leaves) and stems and leaves that were formed during the experiment, which we considered as. 192. a unit (hereafter new shoots). For simplicity, we named the new shoots and new fine roots protruding. 193. the plug as new organs, while the rest of the organs were termed old organs because they originated in. 194. the previous growing season, although part of their growth occurred during the current growing season.. 195. All organs were immediately frozen in liquid N and stored in a freezer at -80 °C, then freeze-dried,. 196. weighed and ground in a ball mill (Sodemi, St Ouen L´Aumône, France) for C and N analyses.. 197. 2.4. Isotopic analyses and calculations. 198. Total C and N concentrations, and 13C/12C and 15N/14N isotopic ratios were measured with an elemental. 199. analyzer (NA 1500 NCS, Carlo Erba, Milan, Italy) coupled to a Delta-S isotopic ratio mass. 200. spectrometer (Finnigan–Mat, Thermoquest Corp., San Jose, CA) at the Plateforme Technique. 201. d’Ecologie Fonctionnelle (OC 081, INRA, Champenoux, France).. 202. The contribution of both currently assimilated C under simulated winter conditions (hereafter. 203. winter C) to reserves and C from reserves and soil N to seedling growth in spring conditions was. 204. calculated with isotopic dilution equations in two different steps (Deléens et al. 1994). It can be. 205. expected that a fraction of C and N found in an organ comes from currently assimilated C and N taken. 206. up from the fertilizer (X), respectively, while the reminder C and N derives from remobilized. 207. compounds (Y) that were stored before t0, which in our case are labeled C and unlabeled N, respectively.. 208. For either C or N, X+Y=1, where (X) can be calculated in each organ from:. 209. A% organ = X × (A% new ) + Y × (A% old ). (1). 210 211 212. A%organ - A%old X=. 213. A%new are the 13C abundance of unlabeled plants at t0 and of the 13CO2-enriched air (4.4 atom% 13C). (2) A%new - A%old where, firstly to calculate the fraction of winter C in an organ at t 0, A%reserves and. 9.
(11) 214. used in the labeling chamber, respectively. Secondly, to calculate the contribution of C and N reserves. 215. for new growth, A%organ is either 13C (or 15N) abundance in the organ at a specific developmental stage. 216. and A%old is the 13C abundance at t0 of the 13C-labeled organ (or the 15N abundance of the unlabeled. 217. organ). We assumed that A%old of an organ corresponded to compounds from reserves (C or N) and. 218. that the values were equal to A% of the bulk plant material (Cerasoli et al. 2004). For C, A%new is 13C. 219. abundance of the organ in unlabeled seedlings at a specific developmental stage. For N, A% new is the. 220. 15. 221. fertilizer.. N abundance of the labeled. 222. The new C and N content of each seedling organ were calculated as the product of X (XC for C. 223. and XN for N) and the C or N content of the organ (organ mass × N or C concentration). The old C and. 224. N content of each organ was calculated as the difference between its total C or N content and its new C. 225. or N content, respectively.. 226. 245. 227. 246. 228. 247. Relative growth rate (RGR) between t0 and t1 or t2 was calculated as:. 248. where ti is either t1 or t2. Partitioning of new C (PC new) and new N (PN new) into the organs. Plant N uptake rate (Nu) between consecutive developmental stages was calculated as:. 229. 230 231 232. at 250 each sampling date was determined as:. 233. 251. 234. 252. Plant respiration was estimated as the difference between the reduction in old C 10.
(12) 235. 253. 236. content in old organs (coarse roots, plug fine roots, stems and old leaves) between t0 and t2 254 and the amount of old C in the new organs (new shoots and protruding fine roots) at t2.. 237. 255. 2.5. Statistical analyses. 238. 256. Preliminary analyses showed that the block was not statistically significant in any case so for. 239. 257. simplicity it was excluded from subsequent analyses. We used a one-way ANOVA to assess. 240. 258. species effect on the content of labeled C recovered after labeling at t0. The effect of species. 241. 259. and development stage on plant organ mass, XC, XN, new and old C and N content were 260. 242. assessed by two-way ANOVA for each plant organ separately.. 243. 261 To assess if a given species favored specific plant organs for winter C storage, we. 244. 262 quantified both the absolute (observed winter C) and the relative amount of winter C in an. 245. 263 organ after 13C labeling. The null hypothesis was that organ sink strength for winter C is. 246. 264 directly proportional to its mass. If an organ is a priority site for storage it would have higher. 247. 265 amount of winter C than predicted by its mass. Thus, to quantify the relative amount of winter. 248. 266 C we compared the observed winter C content with the predicted winter C content in an 267. 249. organ, assuming that the allocation of currently fixed winter C was proportional to the mass of. 250. 268. the organ. Predicted winter C content of an organ i after labeling was calculated as:. 251. 267. 252. 269. For winter C content we performed an ANOVA test for each species with plant organ. 253. 270. and the interaction between plant organ and observed/predicted factors in the model. Fisher’s. 254. 271. Least Significant Difference test was used to identify differences between observed and. 255. 272. predicted means in each plant organ. For all our analyses, data homocedasticity was checked. 256. 273. with the Levene test. When ANOVA assumptions were not met, data were transformed.. 11.
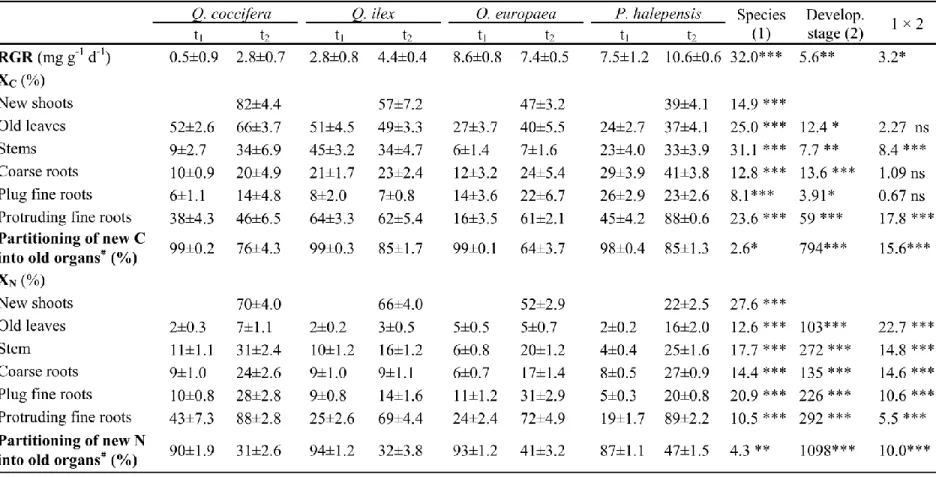
(13) 257. 274. Relationships between variables were analyzed with the Pearson correlation or the Kendall. 258. 275. Tau correlation when relationships were nonlinear. Statistical analyses were conducted with. 259. 277 the STATISTICA 7.0 software (StatSoft, Inc, Tulsa, USA).. 260. 278. 3. Results. 261. 279. 3.1. Growth 1. 262. 280. At t0, P. halepensis seedlings were the smallest and Q. ilex seedlings were the largest. 263. 281. seedlings, while O. europaea and Q. coccifera seedlings were intermediate in size (Figure 1).. 264. 282. Coarse roots in both oaks were larger than in O. europaea and P. halepensis, which. 265. 283. proportionally had more mass in old leaves and stems than Quercus species. At t2, O.. 266. 284. europaea had the highest and Q. coccifera the lowest absolute growth (59±9.9 and 24±3.8 mg. 267. 285. for O. europaea and Q. coccifera, respectively), while absolute growth of Q. ilex and P.. 268. halepensis were 43±7.3 and 39±3.2 mg, respectively (F3,54=678; P<0.001). The oaks,. 269. especially Q. coccifera had lower RGR than the remaining species. At t2, P. halepensis had 288 the. 270. highest RGR while RGR in O. europaea was intermediate (Table 1).. 271. Overall, the mass of most organs increased through development stage (Figure 1; P<0.001) similarly. 272. across species except for Quercus species whose coarse root mass increase was the highest. 273. (Development stage × Species interaction, F6,119=2.83; P<0.01).. 274. The mass of fine roots protruding the plug, was highest in Q. coccifera and lowest in Q. ilex at both. 275. development stages, whilst O. europaea and P. halepensis had intermediate mass values with very little. 276. difference between them (F3,66=3.83; P=0.014) (Figure 1). New shoots appeared between t1 and t2 and. 277. were two to five times larger than the fine roots protruding the plug. New shoots were bigger in Q. ilex. 1. Preferred position for Figure 1.. 12.
(14) 278. and O. europaea than in Q. coccifera and P. halepensis, whose new shoot growth was similar. 279. (F3,33=3.84; P=0.012)... 280. 3.2. C allocation under winter conditions2. 281. After 13C labeling under simulated winter conditions, the amount of C incorporated (winter C) by the. 282. seedlings varied among species in the following order P. halepensis > Q. ilex > O. europaea > Q.. 283. coccifera (Figure 2). In both Quercus species most winter C was allocated to coarse roots, the largest. 284. plant organ. However, in Q. ilex, the old leaves contained more winter C than predicted by their mass,. 285. while the fine roots confined in the plug contained less winter C than predicted. In contrast, winter C. 286. was allocated proportionally to the size of each organ in Q. coccifera. Unlike the oaks, most winter C. 287. in O. europaea and P. halepensis was allocated into old leaves, which also contained more winter C. 288. than predicted by their mass. On the other hand, roots in P. halepensis and stems and plug fine roots in. 289. O. europaea contained less winter C than predicted.. 290. 3.3. New and old C composition of plants3. 291. Overall, old leaves, new shoots and protruding fine roots had the highest XC values, while the fine roots. 292. inside the plug had the lowest XC values. In most organs, the fraction of new C (XC; C derived from. 293. current photosynthesis) increased throughout development, except in Q. ilex where no change in XC. 294. was noted (Table 1).. 295. The contribution of new C to new shoot and protruding fine roots growth was generally greater. 296. than the contribution of old C. At t1, new C represented most (> 50%) of the C content in Q. ilex. 297. protruding fine roots, it was less than 50% in P. halepensis and Q. coccifera while in O. europaea new. 298. C represented less than 20% (Table 1) (see also Figure S2 in Supplementary Material). At t2, XC in fine. 299. roots that protruded the plug was greater than 60% in all species except for Q. coccifera, where it. 2 3. Preferred position for Figure 2. Preferred position table 1and figure 3. 13.
(15) 300. represented less than 50%. In all species, new C in new shoots represented around 50% or more of total. 301. C except for P. halepensis, where it was < 40%. Globally, Q. coccifera had the highest XC and P.. 302. halepensis the lowest, while Q. ilex and O. europaea had similar XC values, intermediate between Q.. 303. coccifera and P. halepensis.. 304. Although total C (new + old C) in the plant increased throughout development, plant old C. 305. content decreased and differed among species (Figure S1 a and c and Table S1 in Supplementary. 306. Material). In all species, old leaves experienced the greatest reduction in old C content (Figure 3).. 307. Coarse roots in the oaks and O. europaea and stems in Q. ilex also showed a strong decrease in old C.. 308. Part of the decrease in old C was remobilized to supply new growth but part was respired, exuded or. 309. volatilized because the amount of old C recovered from new organs at the end of the study was lower. 310. than total old C reduction in old plant organs and part. The amount of remobilized C at t2 was lower in. 311. the two Quercus species than in O. europaea and P. halepensis, which were similar (Figure 3;. 312. F3,26=70.8; P<0.001). The amount of C lost from plant also differed among species at t2. It was highest. 313. in Q. ilex, who respired 2.3, 3.7, and 4.1 times more C than Q. coccifera, O. europaea and P. halepensis,. 314. respectively (F3,26=204; P<0.001).. 315. For all species, most new C was partitioned into woody organs (coarse roots and stems) and fine. 316. roots in the plug (Table 1). The highest partitioned new C at t2 were observed for P. halepensis and Q.. 317. ilex, the lowest values for O. europaea, and intermediate values were found for Q. coccifera.. 318. 3.4. New and old N composition of plants. 319. The fraction of new N (XN; N taken up from the soil) increased in most organs throughout development. 320. with differences among species (Species × Development stage interaction, Table 1). XN was lower in. 321. coarse roots, stems and plug fine roots than in new shoots and protruding fine roots. At t1, protruding. 322. fine roots in Q. coccifera had the highest XN values and P. halepensis the lowest values, whilst O.. 323. europaea and Q. ilex had intermediate XN values. At t2, Q. coccifera and P. halepensis had the highest 14.
(16) 324. XN values (>85%) in protruding fine roots, while O. europaea, and especially Q. ilex, had the lowest. 325. XN values (Table 1). Most N in new shoots of Q. coccifera was new. In contrast, new N represented. 326. only a small fraction of the N in new shoots in P. halepensis, while the percentage was intermediate in. 327. O. europaea and Q.. 328. ilex.. 329. At t1, > 87% of new N was partitioned into the old organs, i.e. those originated in the previous. 330. growing season: coarse roots, stems and the fine roots confined in the plugs. But at t 2, partitioning of. 331. new N into old organs strongly decreased. Pinus halepensis had the highest and oaks, especially, Q.. 332. coccifera, the lowest values, while O. europaea showed intermediate values of N partitioning into old. 333. organs (Table 1).. 334. Plant old N content differed among species as follows: O. europaea > Q. ilex > P. halepensis ≥. 335. Q. coccifera but did not change through development (Figure S2 a and c in Supplementary Material).. 336. Olea europaea had the highest N remobilization from old organs, while Q. ilex and P. halepensis had. 337. intermediate values, and Q. coccifera the lowest (Figure 3). Old leaves supplied most remobilized N in. 338. all species but this was notorious in P. halepensis. Plug fine roots in Q. coccifera, Q. ilex and O.. 339. europaea and stems in Q. ilex and O. europaea were also significant contributors of remobilized N. In. 340. both oaks, surprisingly little N was remobilized from coarse roots despite their high N content.. 341. Nu was greater from t1 to t2 than from t0 to t1, when Nu values were 0.05, 0.14 mg N mg-1 d-1 for. 342. P. halepensis and Q. coccifera, respectively and 0.17 mg N mg-1 d-1 for both Q. ilex and O. europaea.. 343. From t1 to t2, Nu values were 0.16, 0.31, 0.38 and 0.44 mg N mg-1 d-1 for P. halepensis, Q. ilex, O.. 344. europaea and Q. coccifera, respectively.. 15.
(17) 345. 3.5. Relation between variables4. 346. Across species, both XN and XC in new shoots (Figure 4a and b) were negatively related to RGR.. 347. Partitioning of new N into old organs (coarse roots, plug fine roots, stems and old leaves) was positively. 348. related to RGR (Figure 4c) and negatively related to XN in new shoots (Figure 4d). Conversely,. 349. partitioning of new C into old organs was not related either to RGR and XC in new shoots. Remobilized. 350. C and N at t2, was not related either to RGR or XC and XN in new shoots, respectively. Absolute growth. 351. was positively correlated with the old N content of the seedlings at both the intra- and inter-specific. 352. levels (Kendall Tau=1, P=0.042; Figure. 353. 4e). Finally, absolute growth was positively related to remobilized N across species (Figure 4f) but not. 354. to remobilized C (data not shown). The amount of new C recovered in the plant relative to the C used. 355. for plant growth and reserve replenishment at t2 was 94, 87, 81 and 79% for Q. coccifera, Q. ilex, O.. 356. europaea and P. halepensis, respectively. This fraction of new C in the plant was negatively related to. 357. RGR (Tau=-1; P=0.042).. 358. 4. Discussion. 359. Previous studies have shown important differences in N and C remobilization between deciduous and. 360. evergreen conifers (Silla and Escudero 2003; Keel and Schädel 2010; Millard and Grelet 2010;. 361. Brüggemann et al. 2011). We report that seedlings of coexisting Mediterranean evergreen woody plants. 362. have distinct C and N storage physiology. These differences were found in the way seedlings store. 363. winter C, how they use remobilized C and N for new spring growth and the contribution of plant organs. 364. to C and N remobilization.. 4. Preferred position for figure 4.. 16.
(18) 365. Storage pattern of winter-assimilated carbon. 366. All species assimilated labeled C under simulated winter conditions. Evergreen trees from other. 367. temperate biomes are also known to assimilate C during winter as long as low temperatures do not limit. 368. photosynthesis (Hansen et al. 1996; Körner 2003). As seedlings showed no growth symptoms under. 369. winter conditions, assimilated C probably was mostly stored as mobile compounds rather than. 370. transformed into structural carbohydrates. Some of the stored winter C was consumed by respiration or. 371. exuded during spring and the remainder was used to fuel spring growth.. 372. Winter C storage pattern across species reflected species differences in seedling morphology.. 373. Overall, the amount of winter C stored in the different organs was directly related to their mass. Leaves. 374. were the priority sites for winter C storage in P. halepensis and O. europaea seedlings because they. 375. were main C sinks but also because they contained more winter C than the predicted from their mass. 376. (Figure 2). Hansen et al. (1996) found contrary results for 3-year-old Pinus sylvestris L. saplings; the. 377. roots were the main sink for winter C while foliage played a secondary role. This suggests that winter. 378. C allocation may differ among Pinus species at early development stages. In contrast to P. halepensis. 379. and O. europaea, the coarse roots, the largest organ in these seedlings, were the main C sink in the. 380. oaks. Quercus rubra L. seedlings also allocate almost all fixed C to roots when shoot elongation is. 381. arrested (Dickson et al. 1990). Similarly, shade-tolerant broadleaf with episodic shoot growth, such as. 382. oaks, also show greater root C storage than do continuously growing, shade-intolerant trees (Canham. 383. et al. 1999). Despite their relatedness, both oaks differed in their allocation of winter C. Quercus ilex. 384. allocated more winter C to foliage than predicted from its mass at the expense of allocation to fine roots,. 385. whereas in Q. coccifera, the amount of C allocated closely matched organ mass. Our results for Q. ilex. 386. are consistent with findings for the Mediterranean oak, Q. suber, which concentrated 30% of winter C. 387. in leaves although foliage only represented 21% of plant mass, while the roots, representing 62% of the. 388. plant mass, contained less than 50% of the winter C (Cerasoli et al. 2004).. 17.
(19) 389. The relative contribution to growth of new roots and shoots of stored C and N. 390. Growth of new roots and shoots in early spring is crucial for seedling establishment and survival. 391. to summer drought in Mediterranean ecosystems (Padilla and Pugnaire 2007; Villar-Salvador et al.. 392. 2012). This study shows that remobilization of stored C and N played an important role in this new. 393. growth but with notable differences among species, organs and between developmental stages. For. 394. instance, soon after transplanting in early spring remobilized N and C were the main source for the. 395. growth of new roots (the fine roots protruding the plug into the surrounding soil) in all species seedlings;. 396. then by mid spring, most N and C in protruding fine roots derived from the soil or current. 397. photosynthesis, as indicated by low XN and XC values at t1 and high at t2 (Table 1). In general, the. 398. contribution of C reserves to new organ construction was greater than the contribution of stored N.. 399. Moreover, remobilization of N, but not of C, increased the absolute growth of seedlings at a. 400. withinspecies level supporting the idea that absolute growth is a N-source driven process (Millard and. 401. Grelet 2010) supporting the idea that C and N have some differences in their storage physiology. Very. 402. interesting, we also found evidence that the amount of remobilized N to new organs may also drive. 403. seedling absolute growth differences across species (Figure 4).. 404. A major finding of this study is that the composition of seedling new shoots in remobilized C. 405. and N increases with species RGR (see Figure 4 and Figures SI and SII in supplementary material). For. 406. the fastest-growing species, P. halepensis, remobilization was responsible for most C and N in new. 407. shoots while protruding fine roots contained mostly recently assimilated C and N. This resulted in very. 408. different proportions of new C and N in new shoots and in protruding fine roots for P. halepensis. By. 409. contrast, both new shoots and protruding fine roots were enriched in new C and N in oaks, the slowest-. 410. growing species, indicating that current photosynthesis and soil N were the main sources for the growth. 411. of these new organs. Finally, O. europaea had intermediate growth and intermediate values for the. 412. proportion of new C and N in new shoots and protruding fine roots. Similar to our findings for the oaks,. 18.
(20) 413. the contribution of remobilized C to new leaf and stem growth was low in spring for Q. suber, Pinus. 414. nigra Arn. subsp. laricio, and Pinus uncinata Ramond (Cerasoli et al. 2004; Maillard et al. 2004; Felten. 415. et al. 2007). In the evergreen Vaccinium vitis-ideae L.,. 416. N remobilization supplied 47-69% of N in new shoots shortly after first flush (Grelet et al. 2001), which. 417. is similar to our values for Q. ilex, O. europaea and P. halepensis. In P. nigra remobilized N made up. 418. approximately 70 and 20% of new shoot and new root N, respectively (Maillard et al. 2004). In contrast,. 419. a lower proportion of the N consumed for spring leaf growth (32%) in Q. rubra was met by N. 420. remobilization (Salifu et al. 2008).. 421. The higher proportion of remobilized C in new shoots with RGR increase is likely the result of. 422. current photosynthesis not meeting C requirements for new organ growth in the faster-growing species,. 423. which led to greater support by stored C. This notion is supported by the fact that the new C acquired. 424. by the plant was not enough to fulfill the C used for plant growth and storage replenishment, especially. 425. in the fastest growth species (O. europea and especially P. halepensis). Silla and Escudero (2003). 426. concluded that N remobilization in Mediterranean oaks increases when N taken up from the soil does. 427. not meet plant N demand. We consider that N uptake per se did not limit the growth of new fine roots. 428. and shoots in our study as N taken up by roots (total new N in the plant) represented 84-94% of the N. 429. content in new organs in early spring, and 98-137% in mid spring across species (data not shown).. 430. Thus, why did fast-growing species use less N from the soil for new shoot growth and rely more upon. 431. remobilization? We suggest that the underlying mechanism that explains the higher proportion of. 432. remobilized N in new shoots with RGR increase is that old organs (old leaves, plug fine roots and. 433. woody organs such as coarse roots and stems) are strong N sinks of recently taken up N in fast growth. 434. species. This likely reduces the amount of soil N remaining for new organ growth and consequently,. 435. increases the dependence on remobilized N to meet new organ N demand. Three results support this. 436. hypothesis. Firstly, in all species N remobilization in early spring (t1) sustained the growth of protruding. 19.
(21) 437. fine roots, which was a very weak N sink when compared to old organs that coped with most taken up. 438. N as indicated by very high new N partitioning (> 87%) in these organs (Table 1). Consequently, the. 439. amount of new N available for allocation to protruding fine roots was very low, contributing only. 440. 2136% of these fine root N. Secondly, sink strength of old organs for new N was higher in fast growing. 441. species as evidenced by greater partitioning of soil N to these organs with increasing RGR (Figure 4d).. 442. Thus, less new N was available for new shoot and protruding fine root growth due to high allocation of. 443. new N in old organs in faster growing species. Radial growth in woody organs and replenishment of N. 444. reserves likely explain the high N allocated into old organs in spring (Kagawa et al. 2006). Thirdly, the. 445. N sink strength of old organs increased with RGR. Specifically, the amount of N demanded by old. 446. organs was similar to the N in new organs in P. halepensis (the fastest growth species), it was 2.2 and. 447. 2.3 times lower in O. europaea, Q. ilex, respectively and finally it was three times lower in Q. coccifera. 448. (the slowest growth species), respectively.. 449. Differences among species in Nu or the timing of organ growth and replenishment of N reserve. 450. might also have affected N remobilization by altering N source-sink relations. 451. (Nambiar and Fife 1991; Hansen et al. 1996; Dyckmans and Flessa 2001; Willaume and. 452. Pagès 2006). For instance, Nu was lowest in P. halepensis, the fastest growing species, while oaks with. 453. the lowest RGR, had higher Nu; this higher N uptake rate might have alleviated the N remobilization. 454. dependence in the oaks. Unfortunately our study has not suitable temporal resolution to assess the. 455. overlap of N consumption in different organs.. 456. Our findings have interesting ecological and functional implications. To our knowledge, this is. 457. the first time that a relationship has been described between the contribution of remobilized C and N to. 458. new organ growth and RGR. We suggest that remobilization could be part of the suite of traits that. 459. conform the “fast-growth syndrome” in plants such as leaf specific area or leaf area ratio (Cornelissen. 460. et al. 1996; Antúnez et al. 2001). Fast-growing species, such as P. halepensis, that rapidly colonize. 20.
(22) 461. disturbed areas (Barbéro et al. 1998), may rely on remobilized resources to support fast new shoot. 462. growth in spring, which can increase performance in competitive environments (Bausenwein et al.. 463. 2001) and help seedling establishment in spring. By contrast, slow-growing species, such as evergreen. 464. oaks, are likely to rely more on current photosynthesis and soil N to support new growth, with. 465. remobilization playing a secondary role. Because the concentration of stored C and N (Sala et al. 2012;. 466. Gilson et al. 2014) increases, while the proportion of foliage and RGR (Poorter et al. 2012) decreases. 467. with tree age, the relationship between new organ composition in remobilized C and N and RGR might. 468. also change along plant ontogeny. These ideas should to be tested in a higher number of species and in. 469. species from other biomes.. 470. Results did not support our initial hypothesis that oaks would rely more on reserves to support. 471. new growth in spring. Oaks seedlings probably use a low amount of stored resources for respiration. 472. and seasonal cold and drought acclimation, and reserve a high proportion of their pools of stored. 473. resources (especially N in coarse roots, Figure 3) for recovery after unpredictable disturbances or to. 474. persist under prolonged stress conditions (Canham et al. 1999; del Tredici 2001).. 475. Understanding how seedlings use stored resources to support growth is of practical importance. 476. for cultivating high quality seedlings. Survival of planted seedlings in dry sites is linked to their capacity. 477. to produce new shoots and large and deep root systems before the onset of the dry season (Padilla and. 478. Pugnaire 2007; Villar-Salvador et al. 2012). Our results suggest that nursery practices should promote. 479. C and N storage in P. halepensis prior to planting, because this species relies heavily on stored reserves. 480. for new growth. This can be done using high N fertilization levels or specific fertilization regimes. 481. (Villar-Salvador et al., 2012). Similarly, nurseries should promote traits conferring high C assimilation. 482. and soil N acquisition in oaks, especially for Q. coccifera, which primarily use external C and N sources. 483. to support new growth. This can be achieved by producing seedlings with high amount of leaves of. 484. high carboxylation capacity and promoting large root systems using large volume containers. 21.
(23) 485. (Domínguez-Lerena et al. 2006; Villar-Salvador et al. 2012). Finally, both C and N storage and high. 486. external acquisition capacity must be promoted in O. europaea, which use both sources equally to. 487. supply new organ growth.. 488. Importance of different organs as sources of C and N. 489. Part of the C released from old organs (Figure S1) was respired or given off as exudates or. 490. volatiles (Loescher et al. 1990) and part was remobilized to fuel new growth. Unfortunately, we were. 491. not able to assess the contribution of each organ to total remobilized C as we did not distinguish between. 492. respired and remobilized C. In all species, old C stores were to a great extent replenished by currently. 493. fixed C, as observed for other species by Chapin III et al. (1990), Loescher et al. (1990), Cerasoli et al.. 494. (2004). Though remobilized C did account for most of the reduction in old C on P. halepensis and O.. 495. europaea, C remobilization was lower in the Quercus species where most old C was respired during. 496. spring growth. Contrary to our results in the Quercus species, Cerasoli et al. (2004) found that stored. 497. C did not fuel respiration during spring growth in the evergreen oak Q. suber.. 498. Leaves are usually the main sites for C and N remobilization in evergreen woody plants, with. 499. woody stems and roots playing the major role in deciduous species (Nambiar and Fife 1991; Millard. 500. and Proe 1993; Millard et al. 2001; Grelet et al. 2001; Palacio, Millard, et al. 2007). In our study, old. 501. foliage of seedlings was indeed a major source of C and N: leaves showed the greatest reduction in C. 502. and N amounts. Old foliage supplied ca. 84 and 61% of remobilized N in P. halepensis, Q. ilex,. 503. respectively. A similar pattern was reported for P. sylvestris and Q. suber (Millard et al. 2001; Cerasoli. 504. et al. 2004). In contrast, old foliage only supplied 56 and 33% of remobilized N in Q. coccifera and O.. 505. europaea highlighting the importance of other plant organs as sources of remobilized N such as coarse. 506. roots and stems (Silla and Escudero 2003). Only the mobile fraction of organ C and N can be. 507. remobilized. As organs contain different amounts of mobile C and N (Valenzuela 2006), this hinders. 508. comparing the relative importance of organs for C and N remobilization across species.. 22.
(24) 509. 5. Conclusions. 510. We have shown that winter C accumulated throughout the seedling in all species but the amount of. 511. allocated winter C mostly depended on the size of the organ. However, leaves are priority winter C. 512. storage sites in most species as C is accumulated more than predicted by foliage mass. Most of the C. 513. assimilated under simulated winter conditions was presumably respired, exuded or and part of the. 514. remainder was used to increase C reserves, being used for new growth in spring. Remobilization was. 515. the main N source for the fine roots protruding the plug into the surrounding soil in all species soon. 516. after transplanting, but soil N supplied most N in these fine roots in mid spring. The contribution of. 517. stored C to new organ construction was generally smaller than the contribution of currently fixed C and. 518. this difference was more apparent in mid spring. Absolute growth increased as stored and remobilized. 519. N increased both within and across species. However, species RGR determined the contribution of. 520. remobilized resources to the construction of new shoots, with fast-growing species using greater. 521. proportion of remobilized resources than slow-growing species. Old leaves were important sources of. 522. remobilized C and N for all species, but woody organs (coarse roots and stems) also played an important. 523. role in most species. These results evidence that the seedlings of Mediterranean evergreen trees differ. 524. in their C and N storage physiology, which may reduce competition for soil N in spring facilitating. 525. species coexistence.. 526. 6. Acknowledgements. 527. We acknowledge the C.N.R.G.F. “El Serranillo” (MAGRAMA) for supplying the plants of the study,. 528. Christian Hossann for isotope analyses and Sara Palacio for providing constructive comments to an. 529. earlier version. Mercedes Uscola was supported by a FPU-MEC grant. The study was supported by the. 530. AGL2006-12609-C02-01/FOR ENCINUT and AGL2011-24296 ECOLPIN projects (MEC), the. 531. REMEDINAL-3 (S2013/MAE-2719) network of the CAM and INRA EFPA department funds. The. 23.
(25) 532. Technical Platform of Functional Ecology (OC 081) at the INRA Forest Ecology and Ecophysiology. 533. Unit performed the isotopic measurements.. 534. 7. References. 535. Antúnez I, Retamosa EC, Villar R. 2001. Relative growth rate in phylogenetically related deciduous. 536. and evergreen woody species. Oecologia 128: 172–180.. 537. Archibold OW. 1995. Ecology of world vegetation. London: Chapman & Hall Ltd.. 538. Atzmon N, Reuveni O, Riov J. 1994. Lateral root formation in pine seedlings II. The role of assimilates.. 539. Trees 8: 273–277.. 540. Barbéro M, Loisel P, Quézel P, Richardson DM, Romane F. 1998. Pines of the Mediterranean basin.. 541. In: Richardson DM, ed. Ecology and biogeography of Pinus. Cambridge, England: Cambridge. 542. University Press, 153–170.. 543. Bausenwein U, Millard P, Raven JA. 2001. Remobilized old-leaf nitrogen predominates for spring. 544. growth in two temperate grasses. New Phytologist 152: 283–290.. 545. Blanco E, Casado MA, Costa M, Escribano R, García M, Génova M, Gómez A, Gómez F, Moreno JC,. 546. Morla C, Regato P, Sainz H. 1998. Los bosques Ibéricos. Una interpretación geobotánica (M Costa, C. 547. Morla, and H Sainz, Eds.). Barcelona: Editorial Planeta S.A.. 548. Brüggemann N, Gessler A, Kayler Z, Keel SG, Badeck F, Barthel M, Boeckx P, Buchmann. 549. N, Brugnoli E, Esperschütz J, Gavrichkova O, Ghashghaie J, Gomez-Casanovas N, Keitel C, Knohl A,. 550. Kuptz D, Palacio S, Salmon Y, Uchida Y, Bahn M. 2011. Carbon allocation and carbon isotope fluxes. 551. in the plant-soil-atmosphere continuum: a review. Biogeosciences 8: 3457–3489.. 552. Canham CD, Kobe RK, Latty EF, Chazdon RL. 1999. Interspecific and intraspecific variation in tree. 553. survival: effects of allocation to roots versus carbohydrate reserves. Oecologia 121: 1–11.. 24.
(26) 554. Cerasoli S, Maillard P, Scartazza A, Brugnoli E, Chaves MM, Pereira JS. 2004. Carbon and nitrogen. 555. winter storage and remobilisation during seasonal flush growth in two-year-old cork oak (Quercus. 556. suber L.) saplings. Annals of Forest Science 61: 721–729.. 557. Chapin III FS, Schulze E, harold, Mooney HA. 1990. The ecology and economics of storage in plants.. 558. Annual Review of Ecology and Systematics 21: 423–447.. 559. Cherbuy B, Joffre R, Gillon D, Rambal S. 2001. Internal remobilization of carbohydrates, lipids,. 560. nitrogen and phosphorus in the Mediterranean evergreen oak Quercus ilex. Tree Physiology 21: 9–17.. 561. Cornelissen JHC, Castro-Díez P, Hunt R. 1996. Seedling growth. Allocation and leaf attributes in a. 562. wide range of woody plant species and types. Journal of Ecology 84: 755–765. Deléens E, Cliquet JB,. 563. Prioul JL. 1994. Use of. 564. nitrogen partitioning. Australian Journal of Plant Physiology 21: 133–46.. 565. Del Tredici P. 2001. Sprouting in temperate trees: a morphological and ecological review. The. 566. Botanical Review 67: 121–140.. 567. Dickson RE, Isebrands JS, Tomlinson PT. 1990. Distribution and metabolism of current photosynthate. 568. by single-flush northern red oak seedlings. Tree Physiology 7: 65–77.. 569. Domínguez-Lerena S, Sierra NH, Manzano IC, Bueno LO, Rubira JP, Mexal JG. 2006.. 570. Container characteristics influence Pinus pinea seedling development in the nursery and field. Forest. 571. Ecology and Management 221: 63–71.. 572. Dyckmans J, Flessa H. 2001. Influence of tree internal N status on uptake and translocation of C and. 573. N in beech: a dual 13C and 15N labeling approach. Tree physiology 21: 395–401. Felten S,. 574. Hättenschwiler S, Saurer M, Siegwolf R. 2007. Carbon allocation in shoots of alpine treeline conifers. 575. in a CO2 enriched environment. Trees 21: 283–294.. 576. Gilson A, Barthes L, Delpierre N, Dufrêne É, Fresneau C, Bazot S. 2014. Seasonal changes in carbon. 577. and nitrogen compound concentrations in a Quercus petraea chronosequence. Tree Physiology 34:. 578. 716–29.. 13. C and. 15. N plant label near natural abundance for monitoring carbon and. 25.
(27) 579. Girard F, Vennetier M, Ouarmim S, Caraglio Y, Misson L. 2010. Polycyclism, a fundamental tree. 580. growth process, decline with recent climate change: the example of Pinus halepensis Mill. in. 581. Mediterranean France. Trees 25: 311–322.. 582. Grelet G-A, Alexander IJ, Millard P, Proe MF. 2003. Does morphology or the size of the internal. 583. nitrogen store determine how Vaccinium spp. respond to spring nitrogen supply ? Functional Ecology. 584. 17: 690–699.. 585. Grelet G-A, Alexander IJ, Proe MF, Frossard JS, Millard P. 2001. Leaf habit influences nitrogen. 586. remobilization in Vaccinium species. Journal of Experimental Botany 52: 993–1002. Hansen J, Vogg. 587. G, Beck E. 1996. Assimilation, allocation and utilization of carbon by 3-yearold Scots pine (Pinus. 588. sylvestris) trees during winter and early spring. Trees 11: 83–90.. 589. Hoch G, Richter A, Körner C. 2003. Non-structural carbon compounds in temperate forest trees. Plant,. 590. Cell and Environment 26: 1067–1081.. 591. Kagawa A, Sugimoto A, Maximov TC. 2006. Seasonal course of translocation, storage and. 592. remobilization of 13C pulse-labeled photoassimilate in naturally growing Larix gmelinii saplings. New. 593. Phytologist 171: 793–803.. 594. Keel SG, Schädel C. 2010. Expanding leaves of mature deciduous forest trees rapidly become. 595. autotrophic. Tree Physiology 30: 1253–1259.. 596. Körner C. 2003. Carbon limitation in trees. Journal of Ecology 91: 4–17.. 597. Kuptz D, Matyssek R, Grams TEE. 2011. Seasonal dynamics in the stable carbon isotope composition. 598. δ13C from non-leafy branch, trunk and coarse root CO2 efflux of adult deciduous (Fagus sylvatica) and. 599. evergreen (Picea abies) trees. Plant, Cell and Environment 34: 363–73. Le Blevennec L. 1986. Mise. 600. au point d’une solution nutritive pour les cultures annuelles et pérennes. Cahiers des Sciences et. 601. Techniques INRA 14: 29–32.. 26.
(28) 602. Lehmeier CA, Schaufele R, Schnyder H. 2005. Allocation of reserve-derived and currently assimilated. 603. carbon and nitrogen in seedlings of Helianthus annuus under subambient and elevated CO2 growth. 604. conditions. New Phytologist 168: 613–621.. 605. Loescher WH, McCamant T, Keller JD. 1990. Carbohydrate reserves, translocation, and storage in. 606. woody plant roots. Horticultural Science 3: 274–281.. 607. Maillard P, Garriou D, Deléens E, Gross P, Guehl J-M. 2004. The effects of lifting on mobilisation and. 608. new assimilation of C and N during regrowth of transplanted Corsican pine seedlings. A dual 13C and. 609. 15. 610. Maillard P, Guehl J-M, Muller JF, Gross P. 2001. Interactive effects of elevated CO2 concentration and. 611. nitrogen supply on partitioning of newly fixed 13C and 15N between shoot and roots of pedunculate oak. 612. seedlings (Quercus robur). Tree Physiology 21: 163–72.. 613. Milla R, Castro-Díez P, Maestro-Martínez M, Montserrat-Martí G. 2005. Relationships between. 614. phenology and the remobilization of nitrogen, phosphorus and potassium in branches of eight. 615. Mediterranean evergreens. New Phytologist 168: 167–78.. 616. Millard P. 1996. Ecophysiology of the internal cycling of nitrogen for tree growth. Zeitschrift für. 617. Pflanzenernährung und Bodenkunde 159: 1–10.. 618. Millard P, Grelet G-A. 2010. Nitrogen storage and remobilization by trees: ecophysiological relevance. 619. in a changing world. Tree Physiology 30: 1083–95.. 620. Millard P, Hester A, Wendler R, Baillie G. 2001. Interspecific defoliation responses of trees depend on. 621. sites of winter nitrogen storage. Functional Ecology 15: 535–543.. 622. Millard P, Proe MF. 1991. Leaf demography and seasonal internal cycling of nitrogen in sycamore. 623. (Acer pseudoplatanus L.) seedlings in relation to nitrogen supply. New Phytologist 117: 587–596.. 624. Millard P, Proe MF. 1993. Nitrogen uptake, partitioning and internal cycling in Picea sitchensis (Bong.). 625. Carr. as influenced by nitrogen supply. New Phytologist 125: 113–119. Millett J, Millard P, Hester AJ,. N labelling approach. Annals of Forest Science 61: 795–805.. 27.
(29) 626. McDonald AJS. 2005. Do competition and herbivory alter the internal nitrogen dynamics of birch. 627. saplings? New Phytologist 168: 413–22.. 628. Nambiar EKS, Fife DN. 1991. Nutrient retranslocation in temperate conifers. Tree Physiology 9: 185–. 629. 207.. 630. Padilla FM, Pugnaire FI. 2007. Rooting depth and soil moisture control Mediterranean woody seedling. 631. survival during drought. Functional Ecology 21: 489–495.. 632. Palacio S, Maestro M, Montserrat-Martí G. 2007. Relationship between shoot-rooting and root-. 633. sprouting abilities and the carbohydrate and nitrogen reserves of Mediterranean dwarf shrubs. Annals. 634. of Botany 100: 865–74.. 635. Palacio S, Maestro M, Montserrat-Martí G. 2014. Differential nitrogen cycling in semiarid sub-shrubs. 636. with contrasting leaf habit. PloS one 9: e93184.. 637. Palacio S, Millard P, Maestro M, Montserrat-Martí G. 2007. Non-structural carbohydrates and nitrogen. 638. dynamics in Mediterranean sub-shrubs: an analysis of the functional role of overwintering leaves. Plant. 639. Biology 9: 49–58.. 640. Philipson JJJ. 1988. Root growth in Sitka spruce and Douglas-fir transplants: dependence on the shoot. 641. and stored carbohydrates. Tree Physiology 4: 101–8.. 642. Poorter H, Niklas KJ, Reich PB, Oleksyn J, Poot P, Mommer L. 2012. Biomass allocation to leaves,. 643. stems and roots: meta-analyses of interspecific variation and environmental control.. 644. New Phytologist 193: 30–50.. 645. Pulido FJ, Díaz M. 2005. Regeneration of a Mediterranean oak: A whole-cycle approach. Ecoscience. 646. 12: 92–102.. 647. Sala A, Woodruff DR, Meinzer FC. 2012. Carbon dynamics in trees: feast or famine? Tree Physiology. 648. 32: 764–75.. 28.
(30) 649. Salifu KF, Apostol KG, Jacobs DF, Islam MA, Francis KS, Kent GA, Douglass FJ, Anisul MI. 2008.. 650. Growth, physiology, and nutrient retranslocation in nitrogen-15 fertilized Quercus rubra seedlings.. 651. Annals of Forest Science 65: 101–101.. 652. Salifu KF, Islam MA, Jacobs DF. 2009. Retranslocation, plant and soil recovery of nitrogen15 applied. 653. to bareroot Black Walnut seedlings. Communications in Soil Science and Plant Analysis 40: 1408–. 654. 1417.. 655. Salifu KF, Timmer VRR. 2003. Nitrogen retranslocation response of young Picea mariana to nitrogen-. 656. 15 supply. Soil Science Society American Journal 67: 309–317.. 657. Sánchez-Gómez D, Valladares F, Zavala MA. 2006. Functional traits and plasticity in response to light. 658. in seedlings of four Iberian forest tree species. Tree Physiology 26: 1425– 1433.. 659. Silla F, Escudero A. 2003. Uptake, demand and internal cycling of nitrogen in saplings of. 660. Mediterranean Quercus species. Oecologia 136: 28–36.. 661. Sloan JL, Jacobs DF. 2008. Carbon translocation patterns associated with new root proliferation during. 662. episodic growth of transplanted Quercus rubra seedlings. Tree Physiology 28: 1121–1126.. 663. Valenzuela L. 2006. Comparaison interspécifique de la dynamique saisonnière de composés azotés et. 664. carbonés chez le chêne sessile (Quercus petraea Matt. Liebl.), le chêne pédonculé (Quercus robur L.). 665. et le hêtre (Fagus sylvatica L.) aux stades juvéniles et adultes; effet de la défoliation et de le lumière. 666. sur la gestion des réserves. 667. Van den Driessche R. 1991. New root growth of Douglas fir seedlings at low carbon dioxide. 668. concentration. Tree Physiology 8: 289–295.. 669. Villar-Salvador P, Heredia N, Millard P. 2010. Remobilization of acorn nitrogen for seedling growth. 670. in holm oak (Quercus ilex), cultivated with contrasting nutrient availability. Tree Physiology 30: 257–. 671. 63.. 672. Villar-Salvador P, Puértolas J, Cuesta B, Peñuelas JL, Uscola M, Heredia-Guerrero N, Rey. 29.
(31) 673. Benayas JM. 2012. Increase in size and nitrogen concentration enhances seedling survival in. 674. Mediterranean plantations. Insights from an ecophysiological conceptual model of plant survival. New. 675. Forests 43: 755–770.. 676. Vivin P, Gross P, Aussenac G, Guehl J-M. 1995. Whole-plant CO2 exchange, carbon partitioning and. 677. growth in Quercus robur seedlings exposed to elevated CO2. Plant Physiology and Biochemistry 33:. 678. 201–211.. 679. Vizoso S, Gerant D, Guehl J-M, Joffre R, Chalot M, Gross P, Maillard P. 2008. Do elevation of CO2. 680. concentration and nitrogen fertilization alter storage and remobilization of carbon and nitrogen in. 681. pedunculate oak saplings? Tree Physiology 28: 1729–39.. 682. Willaume M, Pagès L. 2006. How periodic growth pattern and source/sink relations affect root growth. 683. in oak tree seedlings. Journal of Experimental Botany 57: 815–26.. 684. 30.
(32) Figures and tables Table 1. Fraction of new C (XC; unlabeled C derived from current photosynthesis) and N (XN; labeled N taken up from the soil) in different plant organs for Quercus coccifera, Q. ilex, Olea europaea and Pinus halepensis seedlings sampled before shoot elongation (t1) and at the end of the first shoot flush (t2). Values are means ± 1 standard error. F-values and significance results of two-way ANOVA are shown in the last three columns. Where *: 0.01<P≤0.05; **: 0.001<P≤0.01; ***: P≤0.001, ns: P>0.05. #.Old organs are coarse roots, fine roots in the plug, stems and old leaves, originated in the previous growing season.. 31.
(33) Figure captions. Figure 1. Dry mass of different plant organs at different growth stages in Quercus coccifera, Q. ilex, Olea europaea and Pinus halepensis seedlings. (t0): after. 13. C labeling and before spring growth. conditions; (t1): shoot elongation had not yet started but seedlings had produced significant amounts of new fine roots that protruded the plug; (t2): first shoot flush of growth had finished and most leaves had completely unfolded and matured. Data are means ±1 SE (n=14).. Figure 2. Observed vs. predicted (according to organ mass) labeled 13C content in different organs after labeling under simulated winter conditions in seedlings of Quercus coccifera, Q. ilex, Olea europaea and Pinus halepensis. In each subfigure, the total content of labeled 13C per plant is shown. Data are means ± 1 SE (n=10). The effects of organ and the organ × observed / predicted factors on labeled 13C content are shown in each subfigure. For each plant organ, an asterisk indicates significant differences between observed and predicted results.. Figure 3. Reduction in old C (calculated as the difference between labeled C content at t0 and labeled C content at t2) and remobilized N (calculated as the difference between unlabeled N content at t0 and unlabeled N content at t2) content in old organs (coarse roots, plug fine roots, stems and old leaves) in Quercus coccifera, Q. ilex, Olea europaea and Pinus halepensis seedlings at the end of the study. Part of C reduction at plant level was due to remobilization and part was lost as respiration, volatiles or exudates. The C amount of both fractions is indicated in each subfigure. Data are means ± 1 SE (n=10).. 32.
(34) Figure 4 Relationship between the relative growth rate (RGR) across species and the fraction of new C (XC; current photosynthesis) in new shoots (a); and fraction of new N (XN; soil N) in new shoots; (b) and partitioning of N taken up from the soil into old organs (coarse roots, plug fine roots, stems and old leaves) (Pnew N,old organs) (c). Subfigure (d) shows the relation between partitioning of N taken up from the soil into old organs (Pnew N,old organs) and fraction of new N (XN; soil N) in new shoots. Subfigure (e) presents the relation between plant absolute growth and plant old N content at the within-species scale (inter-specific scale in inserted figure). Finally, subfigure (f) represents the relation between absolute growth and remobilized N across species. Each point in subfigures (a), (b), (c), (e) and (f) is the species mean value and bars are 1 SE. In subfigure (e), each point represents one plant and the Pearson correlation coefficient for each species is: Q. coccifera (r=0.89; P=0.02), Q. ilex (r=0.81; P=0.03), O. europaea (r=0.80; P=0.06) and P. halepensis (r=0.95; P=0.001).. Figure S1. New (unlabeled C, upper figures) and old C (labeled C, bottom figures) content in new organs (new shoots and fine roots protruding the plugs into the surrounding soil) (right figures) and old organs that mostly originated in the previous growing season (coarse roots, plug fine roots, stems and old leaves) (left figures) of Quercus coccifera, Q. ilex, Olea europaea and Pinus halepensis seedlings measured at different growth stages. (t0): after 13C labeling and before spring growth conditions; (t1): shoot elongation had not yet started but seedlings had produced significant amounts of fine roots that protruded the plug; (t2) first shoot flush of growth had finished and most leaves had completely unfolded and matured. Data are means ±1 SE (n=10)..
(35) Figure S2. New (labeled N; upper figures) and old (unlabeled N; bottom figures) N content in new shoots and fine roots protruding from the plugs into the surrounding soil (right figures) and the old organs that mostly originated in the previous growing season (coarse roots, plug fine roots, stems and old leaves) (left figures) of Quercus coccifera, Q. ilex, Olea europaea and Pinus halepensis seedlings measured at different growth stages. (t0): after 13C labeling and before transplanting to spring growth conditions; (t1): shoot elongation had not yet started but seedlings had produced significant amounts of fine roots protruded the plug; (t2): first shoot flush of growth had finished and most leaves had completely unfolded and matured. Data are means ±1 SE (n=10).. 34.
(36) Supplementary material. Table S1. Two way ANOVA results for species and developmental stage effects on the amount of new (current photosynthesis and soil N) and old (reserves) C and N in different organs of Quercus coccifera, Q. ilex, Olea europaea and Pinus halepensis. Data are F values. Where *: 0.01 < P ≤ 0.05; **: 0.001 < P ≤ 0.01; ***: P ≤ 0.001, ns: P > 0.05; † P = 0.07. New shoots. Old leaves. C old (mg) Species (1). Coarse Plug fine Stems roots roots. Protruding fine roots. 5.1 ** 38 *** Develop. stage (2) 59 *** 1×2 2.5 * C new (mg) Species (1) 6.9 ** 5.4 ** Develop. stage (2) 0.06 ns 1×2 3.3 * N old (mg) Species (1) 14 *** 26 *** Develop. stage (2) 2.6 † 1×2 0.41 ns N new (mg). 112 *** 193 *** 453 ***. 2.1 n.s.. 6.7 ** 12 *** 4.24 *** 3,7 **. 3828*** 429 ***. 105 *** 2.3 ns. 11 *** 6.8 * 3.1 *. 8.5 *** 0.6 ns 0.23 ns. 4.1 ** 93 *** 3.0 *. 167 *** 102 *** 110 *** 3.1 * 0.24 ns 6.8 ** 2.5 * 0.73 ns 2.4 *. 3.2 * 0.09 ns 1.5 ns. Species (1) Develop. stage (2) 1×2. 23 *** 54 *** 41 *** 139 *** 35 *** 106 *** 6.2 ** 6.7 *** 11 ***. 5.8 **. 13 *** 16 *** 58 *** 17 ***. 41 *** 6.7 * 1.9 ns. 305 *** 5.4 **.
(37)
(38)
(39)
(40) Figure 4.
(41)
(42)
(43)
Figure

Documento similar