Dynamic Measurements of 1000 microstrains using Chirped pulse Phase Sensitive Optical Time Domain Reflectometry (CP PhiOTDR)
8
0
0
Texto completo
(2) This article has been accepted for publication in a future issue of this journal, but has not been fully edited. Content may change prior to final publication. Citation information: DOI 10.1109/JLT.2019.2928621, Journal of Lightwave Technology. however, is unable to accurately measure the amplitude of the perturbation, since the resulting change in the back-scattered optical power is not linearly correlated to the applied perturbation. In order to achieve a quantitative true estimation of the measurand (e.g. strain), some modifications are required in the basic simple ФOTDR setup. Various time domain approaches involving single or multiple probing pulses were proposed [1519], where the interference between Rayleigh reflections from nearby locations on the fiber is used to infer environmentallyinduced phase and strain changes. Pulse interrogation using full coherence reception was used to improve linearity at the expense of requiring laser coherence compatible with the length of the fiber under test [20-21]. All these techniques have enabled fast (kHz) measurements of dynamic strains over kilometers-long fibers, up to amplitudes of a few microstrains [19, 22]. Before moving to pulse interrogation techniques, which are augmented by the scanning of the optical frequency, it is important to mention pure Optical Frequency Domain Reflectometry (OFDR) techniques, where range information is generally deduced from Fourier processing of the measured complex transfer function of the fiber [23]. While of comparable performance to OTDR-based techniques for distributed acoustic sensing of phase perturbation, these highly coherent setups offer the quantitative determination of large dynamic strains, albeit currently limited to a few tens of meters [24-25]. Adding optical scanning to ФOTDR can provide accurate measurements of both strain and temperature, as proposed and demonstrated in [26]. As a way to describe the technique, let us zoom-in on two scatterers among the many responsible for the Rayleigh backscattering in the fiber. Denoting the reference distance between them by 𝑑 and the refractive index in their vicinity by 𝑛, their contribution to the reflected intensity in a coherent OTDR setup depends, among other factors, on the term: ∅=. 2𝜋𝜈𝑛𝑑 𝑐. (1). where 𝜈 is the optical frequency and 𝑐 is the vacuum velocity of light. When strain, being the focus of this paper, is applied to the section containing these two scatterers, 𝑑 will be modified by∆𝑑 (where 𝜀 = ∆𝑑/𝑑 is the strain) and 𝑛 by ∆𝑛 (∆𝑛⁄𝑛 = −0.22𝜀 for standard single mode optical fibers at around 1550 nm [26]). While ∅ of Eq. (1) will change as well, together with its contribution to the reflected intensity, its reference value can be restored by appropriate change in the optical frequency: ∆∅ =. 2𝜋 [∆𝜈 ∙ 𝑛𝑑 + ∆𝑛 ∙ 𝜈𝑑 + ∆𝑑 ∙ 𝜈𝑛] 𝑐. (2). Clearly, ∆∅ can be made zero if 𝜈 is changed to 𝜈 + Δ𝜈 so that: ∆𝜈 ∆𝑑 ∆𝑛 = − [ + ] = −0.78𝜀 𝜈 𝑑 𝑛. (3). (For the case of temperature-only change see [26-27]). Thus, if one probes the above mentioned section with a series of pulses, each with a slightly different optical frequency, properly granulated and controlled, the resulting pattern of intensity vs. frequency will appear to shift under the applied strain and Eq. (3) can be used to translate the measured frequency shift into strain values. This method of phase compensation of the induced strain by a frequency sweep has been already successfully applied to the static or quasi-static measurements of temperature [26-27], strain [28-29], and birefringence [30] in the fiber. However, the commonly used pulse-to-pulse frequency scanning is rather slow, calling for faster techniques, suitable to dynamic scenarios (For a review of dynamic strain sensing see [31]). A recently introduced interrogation technique, termed CPФOTDR [32-33], replaces the pulse-to-pulse frequency scanning by a single chirped pulse, potentially offering high interrogation speed, obviously limited by the time of flight in the fiber under test, namely, its length. Following the CPФOTDR success in recording small dynamic strains [32, 34], down to a sensitivity of 𝑝𝜀/√Hz, [35-36], it is the purpose of this paper to demonstrate the capabilities of this technique to measure large dynamic strains over hundreds of meters. Yet, for dynamic strains of high slew rates, processing of the recorded intensity traces relies on the accumulation of incremental measurements, [27, 32], where each spatial resolution cell is cross-correlated with its predecessor to determine the relative change of strain [32]. It turns out, though, that CP-ФOTDR-obtained practical time records of high slewrate applied perturbations contain disturbing outliers. The paper then presents and analyzes an innovative median-based postprocessing strategy in an attempt to mitigate this limitation. Through this strategy, we were able to achieve for the first time (to our knowledge) high signal-to-noise, Rayleigh-based distributed measurements of large and fast dynamic strains of a longitudinally vibrating 4 m section at the end of 210 m of a single mode fiber from 150 µε (peak-to-peak) at a vibration frequency of 400 Hz to 1190 µε at 50 Hz. Preliminary results of this work were presented at [37]. The following Sec. II details the CP-ΦOTDR technique and its application to large dynamic strains, including the introduction of a median-based technique to mitigate the presence of outliers for large dynamic strains. Sec. III describes the experimental setup, while Sec. IV presents the experimental results. A summary of the paper contents appears in Sec. V. II. THE CP-ΦOTDR TECHNIQUE The principle of the technique A recently introduced interrogation technique, termed CPФOTDR [32-33], replaces the pulse-to-pulse frequency scanning by a single chirped pulse, potentially offering very high interrogation speed, obviously limited by the time of flight in the fiber under test, namely, its length, but also by other factors to be discussed below. Here, interrogation is performed using a linearly frequency modulated optical pulse of temporal width 𝜏𝑝 and bandwidth 𝛿𝜈, properly derived from a source, whose coherence time needs to exceed 𝜏𝑝 . The pulse chirped bandwidth, 𝛿𝜈, must cover the anticipated range of applied. This work is licensed under a Creative Commons Attribution 4.0 License. For more information, see https://creativecommons.org/licenses/by/4.0/..
(3) This article has been accepted for publication in a future issue of this journal, but has not been fully edited. Content may change prior to final publication. Citation information: DOI 10.1109/JLT.2019.2928621, Journal of Lightwave Technology. strain (at around 1550nm, 1 𝜇𝜀 (microstrain) will cause a frequency shift of 150 MHz). Each chirped pulse generates a random looking backscattered optical intensity trace, 𝑃(𝑡), on a fast photodetector of a bandwidth of at least 𝛿𝜈. The value of 𝑃(𝑡) at time 𝑡𝑧 (the time elapsed since the pulse entered the fiber) represents contributions from scatterers in the fiber segment 𝑆( 𝑡𝑧 , 𝜏𝑝 ) = [𝑉𝑔 (𝑡𝑧 − 𝜏𝑝 )⁄2 , 𝑉𝑔 𝑡𝑧 ⁄2] (𝑉𝑔 is the group velocity). For the measurement of strain, a temporal sub-trace, centered around 𝑡𝑧 and of duration 𝜏𝑤 ≤ 𝜏𝑝 , is initially extracted, serving as a reference. The same 𝑡𝑧 -centered subtrace is then extracted from a subsequent scan, and compared with the reference one. Since the pulse is chirped and following the rationale behind Eqs. (2-3), it is expected that if a (relative) strain of magnitude 𝜀, has been applied between the two scans, the two sub-traces will approximately overlap after a relative temporal shift of Δ𝑡 (positive or negative, depending on the sign of 𝜀), corresponding to a frequency change, given by [32], ∆𝜈(𝜀) = (. 𝛿𝜈 ) ∆𝑡 𝜏𝑝. (4). In practice, ∆𝑡 is estimated from the two sub-traces by one of the common methods for time delay estimation [38], most frequently by the relatively fast cross-correlation of the two signals, hopefully resulting in a single distinctive peak whose horizontal (time) location gives the value of ∆𝑡. Finally, combining Eqs. (3) and (4) we find: 1 1 𝛿𝜈 𝜀 = ∓( ) ⋅ ( ) ⋅ ( ) ⋅ ∆𝑡 0.78 𝜈𝑜 𝜏𝑝. (5). where the choice of sign depends on the nature of the chirp: minus for in-chirp ascending frequencies and positive for descending ones. Due to the use of a 𝜏𝑤 -wide time window, the spatial resolution of the CP-ФOTDR technique is the convolution of the pulse width, 𝜏𝑝 , and time window, 𝜏𝑤 , multiplied by 𝑉𝑔 ⁄2. Thus, the application of our processing technique to the center of a fiber segment of length ∆𝑧 = 𝑉𝑔 𝑡𝑝 ⁄2, takes into account contributions from scatterers mostly within ∆𝑧𝑔 , but also from some in the two 𝑉𝑔 𝜏𝑤 /4-wide smaller sections adjacent to the two edges of Δ𝑧. While the spatial resolution may gain from decreasing the width of the time-window, too small values of 𝜏𝑤 may give rise to noisy cross-correlations, and consequently, erroneous estimates of ∆𝑡, ∆𝜈 and 𝜀. Adjustments necessary for the measurement of large dynamic strains Using an initial reference for all subsequent traces may not be feasible for the measurement of large strains. Clearly, strain variations of 1000 𝜇𝜀 require an impractical chirp width, 𝛿𝜈, of 150 GHz (at 1550 nm). Therefore, a differential, incremental approach, already suggested in [27, 32], is adopted, where the i-th trace is compared to the (i-1)-th one (𝑖 =1 is the initial reference state of the fiber under test), and the estimated strain differentials, ∆𝜀𝑖 are then added to obtain the final strain [32]:. 𝑛. 𝑛 𝜀 (𝑡 = ) = ∑ ∆𝜀𝑖 𝑆𝑎𝑚𝑝𝑙𝑒 𝑅𝑎𝑡𝑒. (6). 𝑖=1. However, the maximum allowed value of ∆𝜀𝑖 must obey yet another constraint. As explained in [32, Fig. 4], too large strain changes between consecutive traces may result in a crosscorrelation that compares traces originating from partially different scatterers. Instead of a unique correlation peak, such cross-correlations may exhibit a few peaks of fairly close magnitudes and the likelihood of producing an anomalous estimate of ∆𝑡, called an outlier, becomes too high. It was empirically found, [32], that to reduce the probability of appearance of outliers, the strain change between consecutive traces should obey |∆𝜀𝑖 | ≲ 𝛼 ∙ 𝛿𝜈 ⁄𝜈 (𝛼 ∼ (0.03 − 0.05)/0.78. (7). i.e, the allowed strain change should not give rise to a frequency change, ∆𝜈, that exceeds 3-5% of the chirp bandwidth 𝛿𝜈. Nevertheless, due to their statistical nature [39-40], outliers may show up even when (7) is obeyed, see Sec. IV. Thus, strain signals of high slew rate may call for scan rates much higher than required by the Nyquist criterion. Since the scan rate is limited from above by the fiber length, a signal of a given slew rate may also dictate the maximum admissible total length of the fiber. The appearance of outliers and a proposed strategy for the mitigation of their effect It turns out, though, that the random nature of the Rayleigh backscattered traces may give rise to problematic crosscorrelations even when ∆𝜀𝑖 obeys Eq. (7). Thus, a sequence of correct differential strains, {∆𝜀𝑖 }, may be interposed by a series of wrong values, originating from indistinctive multiple crosscorrelation peaks, where the highest peak is not the correct one, see Sec. IV below and Figure 2 (middle pane). Since this wrong peak may occur anywhere within the full dynamic range defined by 𝛿𝜈, the resulting outlier differential can be as large as the allowable measurand dynamic range. Adding up all the estimated differentials, including the outlier ones, results in signal distortion (signal sharp discontinuities, [37]). However, as long as the outliers are isolated, median filtering can eliminate them. Completely isolated outliers can be eliminated by a 3-point median filter while twin-isolated ones need a 5-point filter. Since anyway, large dynamic scans require high over scan rates, i.e. sampling rates well above twice the signal bandwidth, it can be easily shown that under such conditions median filter of a single digit order barely distort the signal (see Sec. IV for quantitative estimates). III. THE EXPERIMENTAL SETUP The setup used for the interrogation is shown in Figure 1. An optical carrier signal from a highly coherent external cavity laser (ECL) diode (𝜆0 = 𝑐/𝜈0 =1550 nm, Δ𝜆~20 KHz) is modulated by a Mach-Zehnder electro-optic modulator (EOM) which is driven by a 𝜏𝑝 =35 ns long, 𝛿𝜈 = 5 GHz wide linearly. This work is licensed under a Creative Commons Attribution 4.0 License. For more information, see https://creativecommons.org/licenses/by/4.0/..
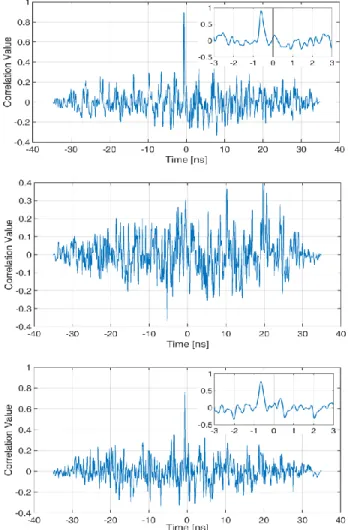
(4) This article has been accepted for publication in a future issue of this journal, but has not been fully edited. Content may change prior to final publication. Citation information: DOI 10.1109/JLT.2019.2928621, Journal of Lightwave Technology. chirped RF pulse, centered at 6.5GHz. This complex pulse is generated by a high speed arbitrary waveform generator (AWG) and has the form: 2𝜋𝛿𝜈 2 𝑡 ] rect(𝑡/𝜏𝑝 ) (8) 2𝜏𝑝 where ‘rect’ equals 1 for | 𝑡⁄𝜏𝑝 | ≤ 0.5 and 0 elsewhere, and 𝑓𝑐 is the center frequency of the generated RF pulse. In order to function properly as a frequency upconverter, the EOM is biased at minimum transmission so that its transfer function becomes [41]: 𝜋𝑉𝑐ℎ𝑖𝑟𝑝 (𝑡) (9) 𝐸𝑜𝑢𝑡 (𝑡) = 𝐸𝑖𝑛 sin [ ] exp(𝑗2𝜋𝜈0 𝑡) 2𝑉𝜋 where 𝐸𝑖𝑛 and 𝐸𝑜𝑢𝑡 (𝑡) are the source electric field and the MacZehnder output fields, respectively, and 𝑉𝜋 is the voltage required by the EOM to change its transmission from null to maximum. The resulting 𝐸𝑜𝑢𝑡 (𝑡) indeed contains the electromagnetic field signal of interest: 𝑉𝑐ℎ𝑖𝑟𝑝 (𝑡) = 𝑉0 cos [2𝜋 ∙ 𝑓𝑐 𝑡 +. 𝐸𝑐ℎ𝑖𝑟𝑝 (𝑡) = 𝑉0 exp [𝑗 (2𝜋 ∙ (𝜈0 + 6.5 ∙ 109 )𝑡 +. 210 m spool of single-mode fiber), clamped between an anchoring point and mechanical shaker, which applied a sinusoidal longitudinal strain. To avoid any mechanicallyinduced noise to the setup, the shaker was placed on a different optical table. Driven by an audio oscillator and a power amplifier, the shaker could excite the FUT with different frequencies and strain amplitudes. The collected traces were windowed, and the strain was then estimated by crosscorrelating successive trace acquisitions using the same time window, centered at the center of the FUT. The interrogation pulse repetition (i.e., scan) rate was set to 200 kHz. For each experiment, data were sequentially and continuously collected into the scope memory, whose limited size allowed for the recording of no more than 160 msec of data for processing. IV. RESULTS AND DISCUSSION This section describes typical CP-ΦOTDR-based measurements of fast strain vibrations, significantly larger than demonstrated before by any other Rayleigh-based technique.. 2𝜋𝛿𝜈 2 𝑡 )] rect(𝑡/𝜏𝑝 ) 2𝜏𝑝. (10) along with both an image signal, centered around [ 𝜈0 − 6.5 ∙ 109 ] Hz, and higher harmonics of the 6.5 GHz chirp around 𝜈0 [41]. A sharp narrowband spectral filter (having a steep attenuation slope of 800 dB/nm) precedes the first EDFA in order to load it only with the signal of interest, Eq. (10). Preceding the filter are (i) a variable optical attenuator, (ii) an isolator, and (iii) an extinction-enhancer SOA, driven by a 35 ns wide rectangular pulse from another channel of the AWG. ECL. EDFA. ISOLATOR. EOM. SOA. RF AMP.. COUPLER. VOA SHAPING PULSE. HIGH RES. OSA. NARROW BAND FILTER EDFA. AWG CHIRP PULSE FIBER END. DAQ. PD. CIR. VOA. FUT: THE 4 m VIBRATING SECTION ANCHOR SHAKER POWER AMP.. FIBER SPOOL (210 m). OSCILLATOR. Figure 1: Experimental Setup for the CP-ФOTDR technique (solid lines represent optical fibers, while dashed lines stand for electrical connections). Acronyms: ECL: Highly coherent laser diode, EOM: electro optic modulator, SOA: Semiconductor optical amplifier, working in as a switch, VOA: Variable optical attenuator, EDFA: Erbium doped fiber amplifier, CIR: circulator. FUT: fiber under test, PD: photo detector. DAQ: data acquisition, AWG: Arbitrary waveform generator.. After properly amplified by the Erbium-doped fiber amplifier, the probing pulse enters the FUT through a circulator, which also directs the Rayleigh back-scattered light into the photodetector (of 9.5 GHz bandwidth) following some additional amplification, spectral cleaning (the second narrowband filter) and power adjustment. The photodiode output current is then sampled by a 13 GHz wideband oscilloscope at a sampling rate of 40 GHz. The FUT comprised a ~4 m fiber segment (at the end of a. Figure 2: Cross-correlation between 3 pairs of 4 consecutive traces in a 50 Hz, 750 𝜇𝜀 experiment. Both the {1,2} (top) and {3,4} (bottom) pairs give rise to cross-correlations with unambiguous peaks, whose distances from the t=0 mark (-0.594 ns and -0.649 ns in the top and bottom frames, see insets) are reasonable for the given vibration, see text. The middle frame, representing the crosscorrelations of the {2,3} pair is clearly useless: automatic processing of crosscorrelations based on the location of the highest peak will predict a jump of 19.7 ns, which is equivalent to the unrealistic positive strain jump of 18.64 𝜇𝜀, clearly representing an outlier.. This work is licensed under a Creative Commons Attribution 4.0 License. For more information, see https://creativecommons.org/licenses/by/4.0/..
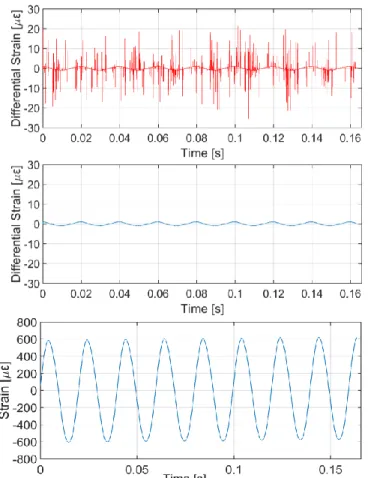
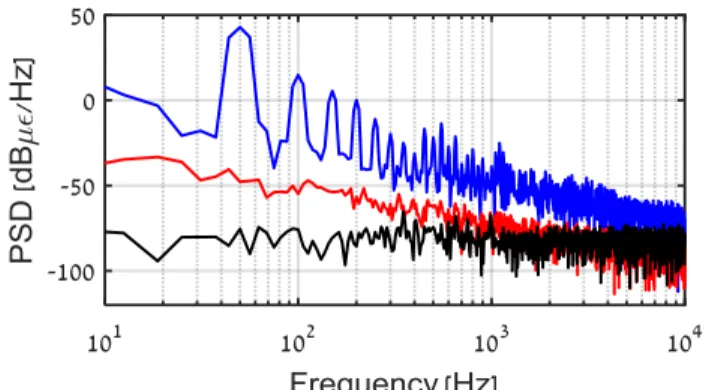
(5) This article has been accepted for publication in a future issue of this journal, but has not been fully edited. Content may change prior to final publication. Citation information: DOI 10.1109/JLT.2019.2928621, Journal of Lightwave Technology. Outliers Figure 2 shows the cross-correlation result for four consecutive traces from a 50Hz, 750 𝜇𝜀 vibrations. Clearly, the cross-correlation associated with traces 1 and 2, Fig. 2 (top), is characterized by an unambiguous clear solitary peak, indicating that trace 2 lags trace 1 by -0.59 ns (center of mass evaluation of peak location). This value can be converted through Eq. (5) to a strain step of 0.56 𝜇𝜀. Since the scan period was 5 μsec, this represents a slew-rate (strain gradient) of 1.12 ∙ 105 𝜇𝜀/sec, a value quite commensurate with the strain gradient of a 50Hz, 750 𝜇𝜀 vibrations close to its maximum rate of descent. However, the cross-correlation between traces 2 and 3, Fig. 2 (middle), is quite ambiguous, and judging the time shift from any of the major peaks produces an erroneous too high value, namely: an outlier. Nevertheless, when paired with trace 4, Fig. 2 (bottom), trace 3 behaves nicely, producing again a valid ∆𝜀. The temporal density of outliers tends to grow with the signal slew rate, eventually limiting the performance envelope of this sensing method. However, as long as these outliers are rare and temporally isolated, they can be effectively eliminated by median filtering the individual strain differences, as demonstrated below.. and the pulse width, 𝜏𝑝 , are both 35 nsec (offering a spatial resolution of ~3.5 m), and all other experimental parameters were mentioned in Sec. III. Figure 3 shows the temporal evolution of the measured differential strains, {∆𝜀𝑖 }, obtained from a point in the middle of the vibrating section. While the top part of the figure is contaminated by isolated outliers, the 5point median filtered differential strains {∆𝜀𝑖 }, middle pane, are clean enough to generate, after integration, Eq. (9), the good quality signal of Fig. 3 (bottom). Note that this is possible due to the low density of outliers. Even in the regions of higher outlier density, especially near regions of high slew rates of the signal, at least 3 out of 5 of every successive samples comprise good estimates, so a 5-point median filtering strategy proves sufficient. Due to the overscan rate, replacing our 5-point median filter by a 7-point one changes the recovered signal by a normalized rms difference of less than 10 -3. Referring now to Eq. (7), and using the values of the relevant experimental parameters, we find that the maximum recommended change of strain between consecutive scans is ∆𝜀 ≤ 1 𝜇𝜀 (for 𝛼 = 0.03 of Eq. (7)). With our scan rate of 200 kHz, the maximum change of our 50 Hz, 1190 𝜇𝜀 strain signal between consecutive scans is 1 𝜇𝜀, thereby complying with Eq. (7) constraint but very close to its limit. A 3D map showing the strain as a function of both distance and time appears in Fig. 4, displaying some same-time, distance-dependent non-uniformities. Note that these nonuniformities could be an additional source of outliers. Indeed, since the sub-traces used for the cross-correlations make use of points over a ~𝑉𝑔 𝜏𝑤 /2-long distance, spatial non-uniformities that may also depend on time (e.g. strain gradients within the sub-trace) may spoil the theoretically expected shift symmetry of consecutive traces, thereby giving rise to outliers.. Figure 4: Strain results for the 50 Hz, 1190 𝜇𝜀 vibration experiment as a function of both time and distance, demonstrating the distributed nature of this dynamic technique.. Figure 3: Strain results for a 50 Hz, 1190 𝜇𝜀 (peak-to-peak) vibration experiment. Top: The incremental strain differentials, {∆𝜀𝑖 }, quite populated with isolated outliers, which were removed by 5-point median filtering (middle frame). Integrating the now cleaned differential strains result in the measured strain of the bottom curve.. The measurement of large dynamic strains We start with peak-to-peak longitudinal vibrations of 1190 µε at 50 Hz. The sub-trace length for the cross-correlation, 𝜏𝑤 ,. Three Power Spectral Densities (PSD), calculated via Hanningweighted periodograms, [42], appear in Fig. 5. The top one is that of the measured strain of Fig. 3. The low and rather flat bottom curve represents the PSD of strain noise at a nonvibrating point along the fiber, where due to the low amplitude of the signal, an initial reference trace could successfully be cross-correlated with all subsequent traces (A detailed analysis of the noise-floor and strain resolution for this technique is detailed in [36]). The same non-vibrating-point strain could be also estimated by our method of integrating incremental contributions, {∆𝜀𝑖 }, this time by making the (i-1)-th trace the reference for the i-th one. The PSD of the resulting 𝜀(𝑡) strain. This work is licensed under a Creative Commons Attribution 4.0 License. For more information, see https://creativecommons.org/licenses/by/4.0/..
(6) This article has been accepted for publication in a future issue of this journal, but has not been fully edited. Content may change prior to final publication. Citation information: DOI 10.1109/JLT.2019.2928621, Journal of Lightwave Technology. for the same non-vibrating point appears as the middle curve in Fig. 5, displaying the expected 1⁄𝑓 2 noise accumulation during the integration process [32]. Going now to the top curve, representing the PSD of our 50 Hz, 1190 𝜇𝜀 signal, we observe that its associated noise has a frequency dependence similar to that of the middle curve, hinting to the penalty the method suffers from noise accumulation leading to an estimated noise level of 0.1 𝜇𝜀⁄√Hz at 50 Hz, and lower at higher frequencies. While the higher noise level in the presence of the signal is still under investigation, we suspect it may relate to the reason behind Eq. (7), [32]: too large strain differences between consecutive scans lead to their correlation being calculated between scattered signals from fiber sections that are too nonoverlapping, eventually leading to indistinct correlation peaks and outliers. But even when (7) is obeyed, the larger the signal the less the overlap and the more noisy is the spectrum. Additionally, insufficient removal of the effect of the outliers may also contribute. Note that for much lower strain levels, sensitivity been shown to be as low as 10−12 𝜀 ⁄√Hz, [36]. Nevertheless, Figs. 3 and 5 present quite clean strain traces. Since the noise appears to be signal-dependent, it is difficult to give an accurate estimate of its signal-to-noise-ratio (SNR). Based on: (i) the power of the signal in Fig. 3; (ii) the power of the no-signal noise (middle curve); and (iii) the observation that this noise lies 25-30 dB below the top curve, we roughly estimate the SNR of the 50 Hz signal to be better than 40 dB. Harmonic rejection is seen to exceed 28 dB (Fig. 5), attesting to the linearity of the CP-ΦOTDR technique when measuring a large (>1000 𝜇𝜀) dynamic signal.. Figure 5: Hanning window based Periodograms. Bottom: Spectral analysis of the strain signal from a non-vibrating point, without resorting to reference updates, see text. Middle curve: Same data as for the bottom curve but processed with incremental updates. Top: Spectral analysis of the signal of Fig. 3. Spectral resolution is limited by the 160 msec record length. The noise level at 50 Hz is estimated (from the top curve) to be 0.1ε/√Hz.. Attempts to move to significantly higher strain amplitudes at 50 Hz, i.e., higher slew rate, failed due to the high probability of outliers, apparently as a results of disobeying Eq. (7). Lowering the vibration amplitude made it possible to measure faster (200 and 400 Hz) vibrations, as shown in Fig. 6, using the same median filtering procedure. The slew rates of these signal are approximately the same as in Fig. 3.. Figure 6: Results for experiments with vibrations of {200 Hz, 250 𝜇𝜀} and {400 Hz, 150 𝜇𝜀}.. V. CONCLUSIONS We have shown for the first time the measurement of large dynamic strains using CP-ФOTDR over a 210-meter fiber with a spatial resolution of ~3.5-meter. To successfully measure large strains (1190 µ𝜀 @ 50 Hz, 250 µ𝜀 @ 200 Hz, and 150 μ𝜀 @ 400 Hz ), continuous reference updating has been employed. This was required in order to ensure accurate time-delay estimations, as there is a limit to the frequency-shift, that may be accurately measured from shot to shot for a given chirp bandwidth. By updating the reference, we achieved a measurement of differential time-delays, which may then be converted into differential strains. Integrating the differential strain signal for a given position then yields the relative strain measurement over time. To work well for signals with high gradients (resulting from large amplitudes and/or high frequencies), sampling rates much higher than those required by the Nyquist criterion must be used: Here, 200 kHz for the above-mentioned, much slower signals. We also show that sparse outliers, obtained from this method of interrogation, may be readily removed by median filtering of the differential strains. The appearance of outliers seems to be statistically driven [40], with increased probabilities for occurrence when larger frequency shifts relative to the chirp bandwidth are encountered. These outliers may also be related to non-homogeneities in the perturbation along the correlation window, or extremely low SNR. Median filtering will have negligible effect on signal integrity as long as the sampling rate is much higher than the signal bandwidth, regardless of the temporal shape of the signal. Though vastly increasing the range of dynamic strain measurements, the consecutive updating of the reference for the calculation of the strain differentials accumulates errors, characterized by a 1⁄𝑓 2 spectral shape. Like the number of outliers, these errors tend to magnify as the signal slew-rate increases. It also appears that the noise is signal-dependent. This characteristic of the method, as well as its linearity, sensitivity and resolution, as a function all relevant parameters, are currently under study. Hitting the fiber with a wideband, multi-GHz signal raises the issue of the influence of chromatic dispersion, which controls the propagation of the spectrum ℑ(𝐸𝑐ℎ𝑖𝑟𝑝 (𝑡)) of the incident signal, Eq. (10), by the multiplicative factor exp[𝑗0.5𝛽2 (𝜔 − 𝜔0 )2 𝑧], with 𝛽2 = −20ps 2 km−1 at around 1550 nm for silica-based single mode fibers, [43]. Interestingly, for 𝛿𝜈 ∙ 𝜏𝑝 ≫ 1, ℑ(𝐸𝑐ℎ𝑖𝑟𝑝 (𝑡)) is proportional to. This work is licensed under a Creative Commons Attribution 4.0 License. For more information, see https://creativecommons.org/licenses/by/4.0/..
(7) This article has been accepted for publication in a future issue of this journal, but has not been fully edited. Content may change prior to final publication. Citation information: DOI 10.1109/JLT.2019.2928621, Journal of Lightwave Technology. exp[−𝑗 𝜏𝑝 ⁄(4Δ𝜔 )(𝜔 − 𝜔0 )2 ] ∙ rect[(𝜔 − 𝜔0 )⁄Δ 𝜔], where Δ𝜔 = 2𝜋𝐵. Thus, chromatic dispersion only modifies the coefficient of the quadratic term, (𝜔 − 𝜔0 )2 , maintaining the chirp character of the signal and just affects the pulse width. Substituting the relevant values from our experiment shows that the chromatic dispersion-induced contribution to the coefficient of the quadratic frequency term is 4 orders of magnitude smaller than that of the applied chirp, and thus can be considered negligible. We believe this experiment paves the way to new applications, where there is a need for dynamic interrogation, in fields such as aeronautics and structural health monitoring. New research should be done in search of better post-processing methods for the reduction of the accumulated error and removal of the outliers. REFERENCES [1] [2] [3] [4] [5]. [6]. [7]. [8]. [9]. [10]. [11] [12]. [13]. [14]. [15] [16]. [17] [18]. Arthur H. Hartog, An Introduction to Distributed Optical Fibre Sensors, CRC Press, Boca Raton, Florida, USA, 2018. D. A. Krohn and T. W. MacDougall, Fiber optic sensors: fundamentals and applications, SPIE Press, 2015. Christian Boller and Fu-Kuo Chang, Encyclopedia of Structural Health Monitoring, John Wiley and Sons, 2009. A. Motil, A. Bergman, and M. Tur, “State of the art of Brillouin fiberoptic distributed sensing,” Opt. Laser Technol., vol. 78, pp. 81–103, 2016. Dengwang Zhou, et al., “Single-shot BOTDA based on an optical chirp chain probe wave for distributed ultrafast measurement.” Light, science & applications (2018). Hongying Zhang, Dengwang Zhou, Benzhang Wang, Chao Pang, Pengbai Xu, Taofei Jiang, Dexin Ba, Hui Li and Yongkang Dong, "Recent Progress in Fast Distributed Brillouin Optical Fiber Sensing,"Appl. Sci. 2018, 8, 1820. Li, B.; Luo, L.; Yu, Y.; Soga, K.; Yan, J. Dynamic Strain Measurement Using Small Gain Stimulated Brillouin Scattering in STFT-BOTDR. IEEE Sens. J. 2017, 17, 2718–2724. M. Rothhardt, M. Becker, C. Chojetzki, E. Lindner, and H. Bartelt, "Fabrication and applications of Draw Tower Gratings," in Photonics and Fiber Technology 2016 (ACOFT, BGPP, NP), OSA Technical Digest (online) (Optical Society of America, 2016), paper BTh1B.1. B.A. Childers, M.E. Froggatt, S.G. Allison, T.C. Moore, D.A. Hare, C.F. Batten, D.C. Jegley, "Use of 3000 Bragg grating strain sensors distributed on four 8-m optical fibers during static load tests of a composite structure", Proc. SPIE 4332, Smart Structures and Materials 2001 (2001/06/14); http://dx.doi.org/10.1117/12.429650. M. K. Barnoski and S. M. Jensen, "Fiber waveguides: a novel technique for investigating attenuation characteristics," Appl. Opt.15, 2112-2115 (1976). C. E. Lee and H. F. Taylor, “Apparatus and method for fiber optic intrusion sensing,” U.S. Patent No. 5,194,847. 16 March 1993 J. C. Juarez and H. F. Taylor, “Distributed fiber optic intrusion sensor system,” OFC/NFOEC Tech. Dig. Opt. Fiber Commun. Conf. 2005. , vol. 4, no. 6, pp. 2081–2087, 2005. Y.L. Lu, T. Zhu, L.A. Chen, X.Y. Bao, “Distributed vibration sensor based on coherent detection of phase-OTDR”, IEEE J. Lightw. Technol. 28 3243–3249 (2010). G.Z. Qin, T. Zhu, L. Chen, X.Y. Bao, “High sensitivity distributed vibration sensorbased on polarization-maintaining configurations of phase-OTDR”, IEEE Photon.Technol. Lett. 23, 1091–1093 (2011). J. P. Dakin, and C. Lamb, "Distributed fibre optic sensor system, GB2222247A, 1990. J. Posey, G. A. Johnson, and S. T. Vohra, “Strain sensing based on coherent Rayleigh scattering in an optical fibre," Elect. Lett., Vol. 36, pp. 1688-1689, 2000. S.J. Russell, J.P.W. Hayward and A.B. B. Lewis, Method and apparatus for acoustic sensing using multiple optical pulses, GB2442745B, 2008. A. Masoudi, M. Belal, and T. P. Newson, “A distributed optical fibre dynamic strain sensor based on phase-OTDR,” Meas. Sci. Technol., vol. 24, no. 8, 2013.. [19] Ali Masoudi and Trevor P. Newson, "High spatial resolution distributed optical fiber dynamic strain sensor with enhanced frequency and strain resolution," Opt. Lett. 42, 290-293 (2017). [20] Z. Pan, K. Liang, Q. Ye, H. Cai, R. Qu, and Z. Fang, "Phase-sensitive OTDR system based on digital coherent detection," in Optical Sensors and Biophotonics, J. Popp, D. Matthews, J. Tian, and C. Yang, eds., vol. 8311 of Proceedings of SPIE (Optical Society of America, 2011), paper 83110S, 2011. [21] A. H. Hartog, and K. Kader, "Distributed fiber optic sensor system with improved linearity," US9170149B2, 2012. [22] Yonas Muanenda, "Recent Advances in Distributed Acoustic Sensing Based on Phase-Sensitive Optical Time Domain Reflectometry ," Hindawi Journal of Sensors Volume 2018, Article ID 3897873, 16 pages https://doi.org/10.1155/2018/3897873 . [23] M. Froggatt and J. Moore, "High-spatial-resolution distributed strain measurement in optical fiber with Rayleigh scatter," Appl. Opt. 37, 17351740, 1998. [24] Stephen T. Kreger; Justin W. Klein; Nur Aida Abdul Rahim; Joseph J. Bos," Distributed Rayleigh scatter dynamic strain sensing above the scan rate with optical frequency domain reflectometry," Proc. SPIE 9480, doi: 10.1117/12.2177701, 2015. [25] DP Zhou, L. Chen and X. Bao,"Distributed dynamic strain measurement using optical frequency-domain reflectometry," Appl. Opt., vol. 55, pp. 6735-6739, 2016. [26] Y. Koyamada, M. Imahama, K. Kubota, and K. Hogari, “Fiber-optic distributed strain and temperature sensing with very high measurand resolution over long range using coherent OTDR,” J. Light. Technol., vol. 27, no. 9, pp. 1142–1146, 2009. [27] S. Liehr, Y. S. Muanenda, S. Münzenberger, and K. Krebber, “Relative change measurement quantities using dual-wavelength coherent OTDR,” Opt. Express 25(2), 720–729 (2017). [28] Liehr, Sascha, Sven Münzenberger, and Katerina Krebber. "Wavelength-scanning coherent OTDR for dynamic high strain resolution sensing." Optics express 26(8), 10573-10588 (2018) . [29] Ling Zhou, Feng Wang, Xiangchuan Wang, Yun Pan, Zhenqin Sun, Ji Hua, and Xuping Zhang, “Distributed strain and vibration sensing system based on phase-sensitive OTDR,” IEEE Photonics Technol. Lett., vol. 27, no. 17, pp. 1884–1887, 2015. [30] M. A. Soto, X. Lu, H. F. Martins, M. Gonzalez-Herraez, and L. Thévenaz, “Distributed phase birefringence measurements based on polarization correlation in phase-sensitive optical time-domain reflectometers,” Opt. Express, vol. 23, no. 19, p. 24923, 2015. [31] Ali Masoudi, Ali, and Trevor P. Newson. "Contributed Review: Distributed optical fibre dynamic strain sensing." Review of Scientific Instruments 87.1 (2016): 011501. [32] J. Pastor-Graells, H. F. Martins, A. Garcia-Ruiz, S. Martin-Lopez, and M. Gonzalez-Herraez, “Single-shot distributed temperature and strain tracking using direct detection phase-sensitive OTDR with chirped pulses,” Opt. Express, vol. 24, no. 12, p. 13121, 2016. [33] M. R. Fernandez-Ruiz, J. Pastor-Graells, H. F. Martins, A. Garcia-Ruiz, S. Martin-Lopez, and M. Gonzalez-Herraez, “Laser Phase-noise Cancellation in Chirped-pulse Distributed Acoustic Sensors,” Journal of Lightwave Technology, 2017. [34] J. Xiong , Z. Wang, Y. Wu, Y. Chen, J. Li and Y. Rao, "High performance CP-ΦOTDR utilizing the negative band," The 26th Optical Fiber Sensors. Optical Society of America, 2018. [35] L. Costa, H. F. Martins, S. Martin-Lopez, M. R. Fernández-Ruiz, and M. Gonzalez-Herraez, "Reaching pε/√Hz sensitivity in a distributed optical fiber strain sensor," in 26th International Conference on Optical Fiber Sensors, OSA Technical Digest (OSA 2018), paper TuD3. [36] L. Costa, H. F. Martins, S. Martin-Lopez, M. R. Fernández-Ruiz, and M. Gonzalez-Herraez, "Fully distributed optical fiber strain sensor with 10−12 𝜇𝜀/√Hz sensitivity" IEEE J. Lightw. Technol. (to be published) doi: 10.1109/JLT.2019.2904560. [37] H. D. Bhatta, L. Costa, A. Garcia-Ruiz, M. R. Fernandez-Ruiz, H. F. Martins, M. Tur, and M. Gonzalez-Herraez, "Extending the Measurement of True Dynamic Strain via Chirped-Pulse Phase-Sensitive Optical Time Domain Reflectometry to 100’s of Microstrains," in 26th International Conference on Optical Fiber Sensors (OFS-26), OSA Technical Digest (OSA, 2018), paper WF14. [38] G. Jacovitti and G. Scarano, “Discrete time techniques for time delay estimation,” IEEE Trans. Signal Process., vol. 41, pp. 525–533, 1993. [39] L. Zhang, L. D. Costa, Z. Yang, M. A. Soto, M. Gonzalez-Herraez and L. Thevenaz, "Analysis and Reduction of Large Errors in Rayleigh-based. This work is licensed under a Creative Commons Attribution 4.0 License. For more information, see https://creativecommons.org/licenses/by/4.0/..
(8) This article has been accepted for publication in a future issue of this journal, but has not been fully edited. Content may change prior to final publication. Citation information: DOI 10.1109/JLT.2019.2928621, Journal of Lightwave Technology. [40] [41]. [42] [43]. Distributed Sensor," J. Lightw. Technol. (to be published) doi: 10.1109/JLT.2019.2917746. J. Ianniello, “Time delay estimation via cross-correlation in the presence of large estimation errors,” IEEE Trans. Acoust., pp. 998–1003, 1982. Omer Shlomovits, Tomi Langer, and Moshe Tur, “The Effect of Source Phase Noise on Stimulated Brillouin Amplification”, Journal of Lightwave Technology, Vol. 33, Issue 12, pp. 2639-2645, 2015. A. Oppenhein and R. Shafer, Discrete-Time Signal Processing (3rd Edition), Prentice-Hall, 2014. G. Agrawal, Nonlinear Fiber Optics, Academic Press, 2013.. This work is licensed under a Creative Commons Attribution 4.0 License. For more information, see https://creativecommons.org/licenses/by/4.0/..
(9)
Figure
Documento similar