Explaining Export Diversification:
An Empirical Analysis
Ricardo N. Bebczuk y N. Daniel Berrettoni
Final Version, May 2006
CAF RESEARCH PROGRAM ON DEVELOPMENT ISSUES
“Explaining Export Diversification:
An Empirical Analysis”(*)
Authors:
Ricardo N. Bebczuk and N. Daniel Berrettoni
Institution:
Department of Economics, Universidad Nacional de La Plata,
Argentina
Introduction
The secular concentration of Latin American exports in primary products has been
highlighted as a major drawback for the development prospects of the region. Adverse
and volatile terms of trade, slow productivity growth, and relatively low value added are
some of the issues that have been raised against this primary product dependence since
the seminal work of Prebisch (1959). In addition to reducing the dependence on
fluctuating commodity prices, diversification into other sectors, especially those more
intensive in technology, is prone to trigger knowledge spillovers from the exposure to
international markets, management and marketing practices, and production processes.
This fascinating debate has anything but faded away since then, and has been picked up
by the recent growth literature (see for instance Warner and Sachs (1995), Maloney
(2002), and Lederman and Maloney (2003)). These and other papers have thoroughly
studied whether export and factor endowment structures influence growth, and have
presented case studies to understand why diversification strategies put in place in the
last half century in our region have failed.
Though the relationship between concentration, volatility and low growth could be well
founded, it does not mean that increasing levels of export diversification can guarantee
by themselves higher levels of growth. Between the mid-1960s and the late 1990s, most
Latin American countries diversified their export structure (see Table 1 below and
World Bank (2002)), but yet they were unable to achieve considerable levels of GDP
expansion.
In particular, some of the recent studies have challenged the “resource curse” view, as
became known the negative relationship between natural resource abundance and
growth. Based on a cross-country analysis, Ng (2005) argues that natural resource
abundance is beneficial for economic development showing a positive relationiship
between resource abundance and output level. Lederman and Maloney (2003) find
evidence in cross-section that what reduces growth prospects is concentration in export
revenues and that there is no evidence that natural resource abundance is detrimental to
Case studies run in the same direction: Resource based activities can sustain growth
ight and Czelusta (2002) study the mineral abundance in the
United States as a historical example of resource-based growth. Blomström and Kokko
(2003) describe how Sweeden and Finland reached a more diversified economic
structure by adding technology into their natural resource-based production.
But there are successful stories outside the OECD as well. Herzen and Nowark-Lehman
(2004), analyzing the Chilean experience, investigate the hypothesis that export
diversification is linked to economic growth trough externalities of learning activities
related with exporting and conclude that export diversification on the basis of natural
resources has a positive influence on growth.
Though the conclusions of these studies could not be easily generalized, they should
call the attention of Latin American countries which base their competitive advantages
on natural resource abundance. Nowadays, natural resources have higher technology
content and are able to generate the development of upstream and downstream activities
(Bonaglia and Fukasaku, 2003).
Although many papers have dealt with the relation between trade structure and
economic growth, much less attention has been paid to the underlying determinants of
export diversification1, an exercise that should provide valuable research and policy recommendations regarding the room for active government interventions and their
expected outcomes. To fill this gap, this project aims to investigate this issue by: (1)
employing econometric techniques on a cross-country database; (2) analyzing, as a case
study, firm-level export diversification in Argentina. As a result of the pronounced real
devaluation of the peso in 2002-2004, this country offers a nice quasi-natural
experiment to examine whether relative prices might influence export diversification
and to observe whether diversification is a between- or within-firm phenomenon.
over long periods. Wr
1
The cross-country exercise revolves ar
disaggregated at 2-digit SITC into 69 sector
the squared proportional exposures to each se
ound a Herfindahl index using export data
s. The Herfindahl index equals the sum of
r and hence has a maximum of 1 when
the country is completely focused on one sector, so lower values of the index indicate
more diversification. Information is available on 56 countries with annual data for
1962-2002.2
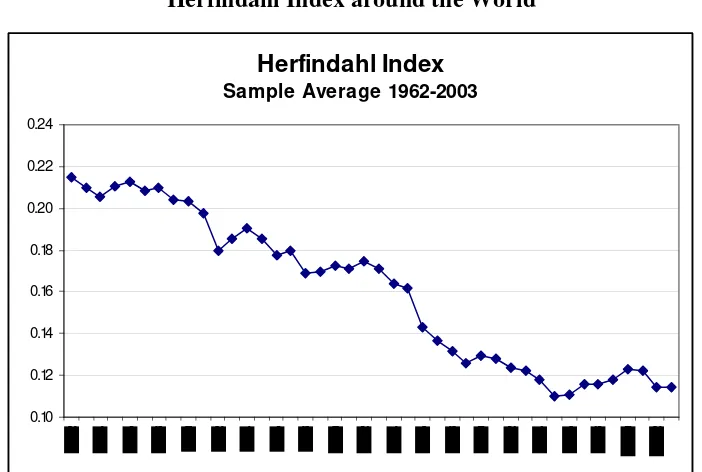
To motivate our subsequent investigation, Figure 1 displays the simple average of the
Herfindahl index for the complete sample, where it is apparent that diversification has
consistently going up until the mid-1990s. Breaking down the sample by region, such
downward trend has taken place in all cases but the European Union and North
America. These two regions appear to have Herfindahl indices well below the world
[image:5.595.122.473.389.625.2]average in 1970 as well as in 2000, without much variation over the three decades.
Figure 1
Herfindahl Index around the World
cto
Herfindahl Index
Sample Average 1962-2003
0.10 0.12 0.14 0.16 0.18 0.20 0.22 0.24
Source: Own elaboration based on COMTRADE. International Trade Center. WTO-UNCTAD
2 The countries in the sample, grouped by region, are: Argentina, Bolivia, Brazil, Chile, Colombia,
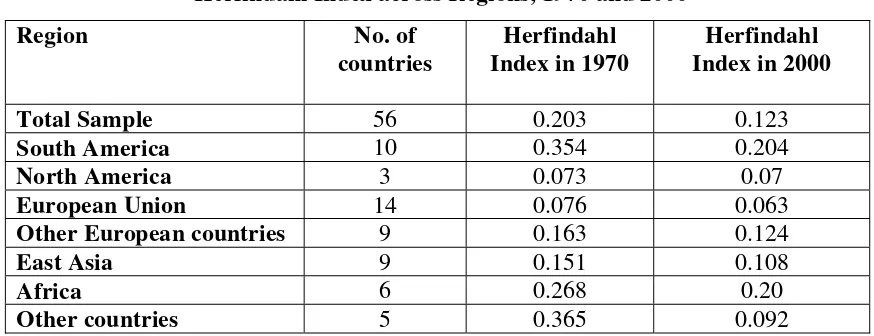
Table 1
Herfindahl Index across Regions, 1970 and 2000
Region No. of
countries
Herfindahl Index in 1970
Herfindahl Index in 2000
Total Sample 56 0.203 0.123
South America 10 0.354 0.204
North America 3 0.073 0.07
European Union 14 0.076 0.063
Other European countries 9 0.163 0.124
East Asia 9 0.151 0.108
Africa 6 0.268 0.20
Other countries 5 0.365 0.092
Source: Own elaboration based on COMTRADE. International Trade Center. WTO-UNCTAD
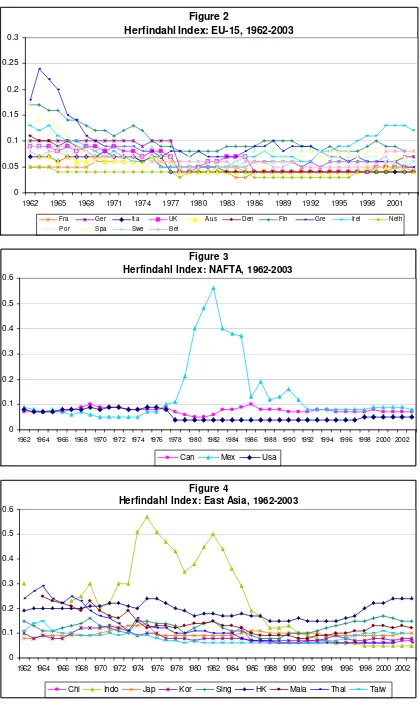
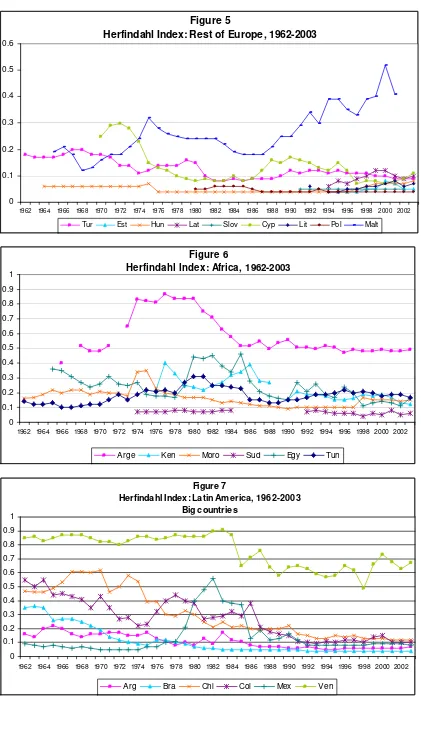
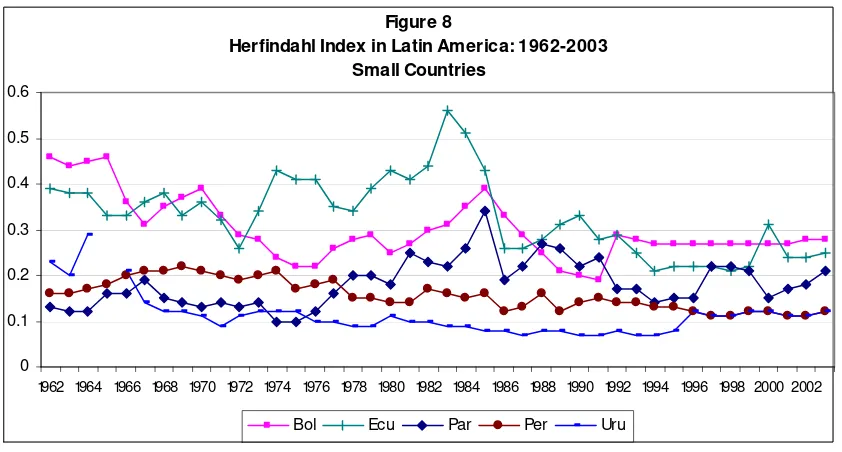
Other remarkable patterns emerge from the inspection of time series by region, as
shown in Figures 2 to 8. Most prominently, we observe a convergence process whereby
countries having disparate diversification indexes at the start of the sample period
gradually began, with particular intensity since the 1970s and early 1980s, to attain
similar values within regions (but not always between regions, as suggested by the last
table). Most countries lie in the 0.05-0.15 range by the early 2000s. Even though there
are outliers in all regions (Mexico, Venezuela, Indonesia, Malta, Algeria) and the
downward dynamics is uneven across regions (for instance, NAFTA, East Asia and the
smaller South American countries have more stable indexes across time than the other
regions), by and large some commonality is apparent. We will claim later on that this
trend is to a great extent explained by common domestic macroeconomic developments
(economic growth, increased trade openness), but the international context also has
Figure 2
Herfindahl Index: EU-15, 1962-2003
0 0.05 0.1 0.15 0.2 0.25 0.3
1962 1965 1968 1971 1974 1977 1980 1983 1986 1989 1992 1995 1998 2001
Fra Ger Ita UK A us Den Fin Gre Irel Neth
P o r Spa Swe B el
Figure 3
Herfindahl Index: NAFTA, 1962-2003
0 0.1 0.2 0.3 0.4 0.5 0.6
1962 1964 1966 1968 1970 1972 1974 1976 1978 1980 1982 1984 1986 1988 1990 1992 1994 1996 1998 2000 2002
Can Mex Usa
Figure 4
Herfindahl Index: East Asia, 1962-2003
0 0.1 0.2 0.3 0.4 0.5 0.6
1962 1964 1966 1968 1970 1972 1974 1976 1978 1980 1982 1984 1986 1988 1990 1992 1994 1996 1998 2000 2002
Figure 5
Herfindahl Index: Rest of Europe, 1962-2003
0 0.1 0.2 0.3 0.4 0.5 0.6
1962 1964 1966 1968 1970 1972 1974 1976 1978 1980 1982 1984 1986 1988 1990 1992 1994 1996 1998 2000 2002
Tur Est Hun Lat Slov Cyp Lit Pol Malt
Figure 6
Herfindahl Index: Africa, 1962-2003
0 0.1 0.2 0.3 0.4 0.5 0.6 0.7 0.8 0.9 1
1962 1964 1966 1968 1970 1972 1974 1976 1978 1980 1982 1984 1986 1988 1990 1992 1994 1996 1998 2000 2002
Arge Ken Moro Sud Egy Tun
Figure 7
Herfindahl Index: Latin America, 1962-2003 Big countries
0 0.1 0.2 0.3 0.4 0.5 0.6 0.7 0.8 0.9 1
1962 1964 1966 1968 1970 1972 1974 1976 1978 1980 1982 1984 1986 1988 1990 1992 1994 1996 1998 2000 2002
Figure 8
Herfindahl Index in Latin America: 1962-2003 Small Countries
0 0.1 0.2 0.3 0.4 0.5 0.6
1962 1964 1966 1968 1970 1972 1974 1976 1978 1980 1982 1984 1986 1988 1990 1992 1994 1996 1998 2000 2002
Bol Ecu Par Per Uru
Source: Own elaboration based on COMTRADE. International Trade Center. WTO-UNCTAD [PARA FIGURES 2 a 8. TITULOS INCLUIDOS EN EL GRAFICO]
The paper is structured as follows: In Section 1 a theoretical background is advanced
and applied to the econometric cross-section analysis. Section 2 presents some
robustness checks. Section 3 is devoted to the recent Argentine case. Some conclusions
and recommendations close.
1. Theoretical considerations and cross-country results
Although the benefits of a diversified export base has been well-established in the
literature, there exists no unified theoretical framework to rely on when it comes to
uncover the macroeconomic drivers of export diversification. Furthermore, trade
research treats export diversification from a social, aggregate standpoint, while the
decision to diversify is made by individual firms from the private sector (provided the
government has no decisive influence on export markets, as it is the case in most
countries). One intuitive, but utterly misleading, approach would be to extrapolate the
principles of financial diversification to export diversification. In the former case, any
given firm or individual can purchase at low cost financial assets to construct a portfolio
with a better expected risk and/or return performance. Conversely, in the latter case,
even though the firm can still have a belief about future international prices, exchange
the end on the ability of the very firm to profitably produce the good, which in turn
responds to both micro and macroeconomic conditions. Likewise, risk is heightened by
the irreversibility of some productive investments, a problem absent from the much
more liquid financial markets.
From this perspective, it is actually unclear whether any given firm will find it
appealing to diversify into new exportable goods or services. On one hand, pursuing
profit stability and growth may lead firms to invest in new undertakings, especially
those whose revenues are poorly correlated to the current productive menu. But, on the
other hand, a strategy of focusing on one or few projects may allow the company to
exploit economies of scale and to move along the learning curve. In this sense, the
company’s behavior in export markets depends on the existence of constant returns to
scale (as assumed in the traditional trade theory) or increasing returns to scale (as
assumed in the new international economics literature) –see Wong (1995) on this
debate. Moreover, even when the firm aims to mitigate its overall risk, this does not
necessarily imply that the firm will move toward new export goods. For instance, an
exporting firm may well prefer to expand into non-tradeable production (and vice versa)
to smooth out the effect of real exchange rate movements. Equally important,
diversification may be restricted by diseconomies of scope, the country’s structural
comparative advantage and the own company´s degree of international competitiveness.
Finally, uncertainty creates a high cost discovery in developing countries (see Hausman,
Hwang and Rodrik (2005)).
In this light, the research question to be tackled in this study is how the macroeconomic
environment may foster or inhibit export diversification, as measured by the Herfindahl
index.3 A priori, diversification will certainly be linked to prospective competitiveness (return) and risk with a diversified productive base vis-à-vis a focused one, but these
two variables are correlated with the macroeconomic setting in a rather complex way,
which thus calls for an empirical approach to the problem. The first explanatory variable
is the Exports to GDP ratio. This indicator reflects, among other things, the country’s
competitiveness in and the integration to international markets. From here, two opposite
3
effects may be expected, as higher overall productive efficiency helps developing new
lines of production but, at the same time, it may imply a better knowledge of the
country’s comparative advantage and the exploitation of increasing returns to scale via
export specialization. Per capita GDP is another variable a priori linked to
diversification. Richer economies tend to be economically and institutionally more
stable, and such environment mitigates the business risks perceived by domestic
producers, thus making diversification less imperative. Nevertheless, as these
economies are characterized by higher total factor productivity and a better business
climate, entrepreneurs may find it more appealing to broaden their productive mix. The
access to credit, the quality of infrastructure, the gross investment ratio and the level of
foreign direct investment are indicators of macroeconomic efficiency and strength that
may likely enhance the growth prospects of firms, even though the implications for
export diversification remain an open theoretical question.
The impact of the observed export composition is examined by including the shares of
fuel, manufactures and agricultural exports in total exports. The expected sign on the
fuel exports share is positive, as fuel exporters enjoy substantial rents that potentially
downplay the long-run benefits of export diversification –a syndrome sometimes
referred to as Dutch disease.4 Since the industrial sector is the one offering a wider menu of alternative products vis-à-vis other sectors, a negative sign is expected for the
manufactures exports share. A high reliance on agricultural exports may bring about
either lower diversification –because of the rather limited possibilities of diversifying
within this sector- or higher diversification –because agricultural exporters may be
willing to diversify away the volatility and downward trend observed in the price of
primary products-. Annual time effects are also included in the regressions to capture
any time trend unrelated to economic fundamentals.
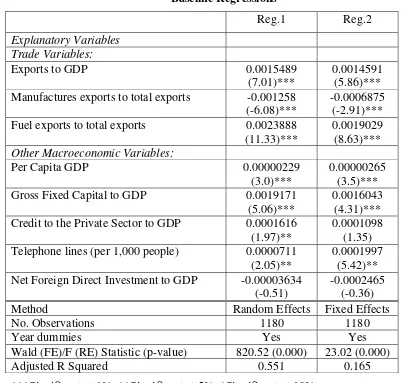
Table 2 displays the baseline regressions and our main findings. The usable sample
comprises 1,180 observations covering the 1970-2002 period. Explanatory variables are
one-year lag values under the sensible presumption of a delayed impact on
4
diversification.5 Fixed and random effects results are shown in the table.6 Results do not change much from one method to the other, but a Hausman test suggests that the fixed
effects estimator is preferred on consistency grounds. Goodness of fit, as reflected in the
R Squared and the Wald and F Statistics of joint statistical significance, is quite
satisfactory. An overall reading of the evidence supports the notion that richer, more
efficient, more stable and more open countries tend to focus rather than to diversify
exports. As revealed by the econometric outcome, variables typically associated with
good macroeconomic performance (exports, GDP, investment rate, credit,
infrastructure) have positive and highly significant loadings, meaning that they act in
favor of more concentration rather than more diversification. This finding, yet quite
robust, clashes against the common knowledge that export concentration should
attenuate over the process of economic development. This belief comes from the
normative observation that concentration in primary products has pervasive effects on
trade and economic growth, while the results of this paper have more to do with private
business incentives, which seem to encourage domestic firms to focus in order to take
advantage of specialization-based economies of scale and, conversely, to diversify
more intensely when macroeconomic risks are more evident. Along with this,
manufactures exporters appear to be more diversified, in marked contrast to fuel
exports. Time dummies (not reported) confirm that diversification has been on a
systemic rise since the 1970s, regardless of idiosyncratic national factors. These dummy
variables help reconciling the summary statistics in the Introduction –which showed a
generalized move towards diversification- with the macroeconomic estimates. At first
sight, the increase in diversification seems at odds with the focus-promoting effect of
total exports and GDP, two variables that have gone up over the last decades. However,
the advantage of multivariate regressions is that it isolates the independent effect of
5
The use of lagged explanatory variables also helps to deal with their potential endogeneity provided that future values of the Herfindahl index have no influence whatsoever on the control set. While there are no strong reasons to believe on reverse or simultaneous causation, the use of proper instruments is always advisable to avoid any suspicion of endogeneity, but this approach is extremely difficult, if not impossible, to implement in most econometric applications.
6 The inclusion of the lagged Herfindahl index may be warranted on inertia considerations, in which case
different variables. In the present case, the global bias toward diversified exports
Table 2
Baseline Regressions
Reg.1 Reg.2
Explanatory Variables Trade Variables:
Exports to GDP 0.0015489
(7.01)***
0.0014591 (5.86)*** Manufactures exports to total exports -0.001258
(-6.08)***
-0.0006875 (-2.91)***
Fuel exports to total exports 0.0023888
(11.33)***
0.0019029 (8.63)***
Other Macroeconomic Variables:
Per Capita GDP 0.00000229
(3.0)***
0.00000265 (3.5)***
Gross Fixed Capital to GDP 0.0019171
(5.06)***
0.0016043 (4.31)***
Credit to the Private Sector to GDP 0.0001616
(1.97)**
0.0001098 (1.35)
Telephone lines (per 1,000 people) 0.0000711
(2.05)**
0.0001997 (5.42)**
Net Foreign Direct Investment to GDP -0.00003634
(-0.51)
-0.0002465 (-0.36)
Method Random Effects Fixed Effects
No. Observations 1180 1180
Year dummies Yes Yes
Wald (FE)/F (RE) Statistic (p-value) 820.52 (0.000) 23.02 (0.000)
Adjusted R Squared 0.551 0.165
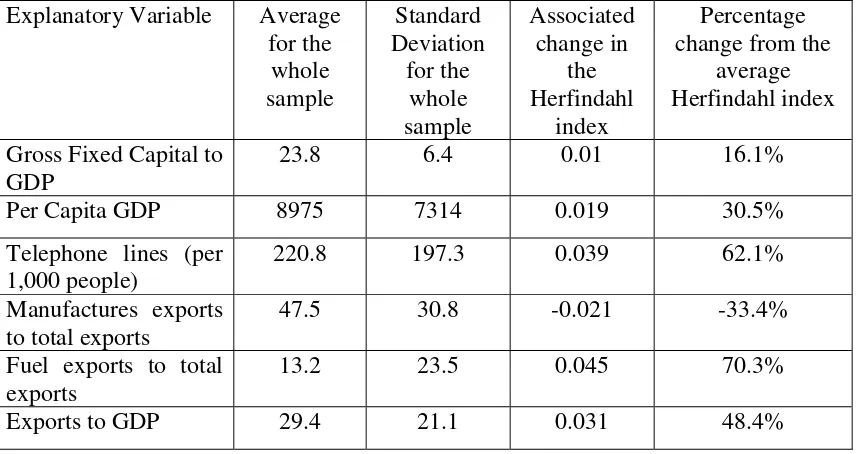
In the next table the sizable quantitative impact of the statistically significant variables
under the fixed effects estimation is presented. A one-standard-deviation increase in the
explanatory variables explain changes in the Herfindahl index that in no case fall below
[image:15.595.82.510.195.422.2]16.1% from the average Herfindahl index of 0.158:
Table 3
Economic Effects
Explanatory Variable Average for the whole sample Standard Deviation for the whole sample Associated change in the Herfindahl index Percentage change from the
average Herfindahl index
Gross Fixed Capital to GDP
23.8 6.4 0.01 16.1%
Per Capita GDP 8975 7314 0.019 30.5%
Telephone lines (per 1,000 people)
220.8 197.3 0.039 62.1%
Manufactures exports to total exports
47.5 30.8 -0.021 -33.4%
Fuel exports to total exports
13.2 23.5 0.045 70.3%
Exports to GDP 29.4 21.1 0.031 48.4%
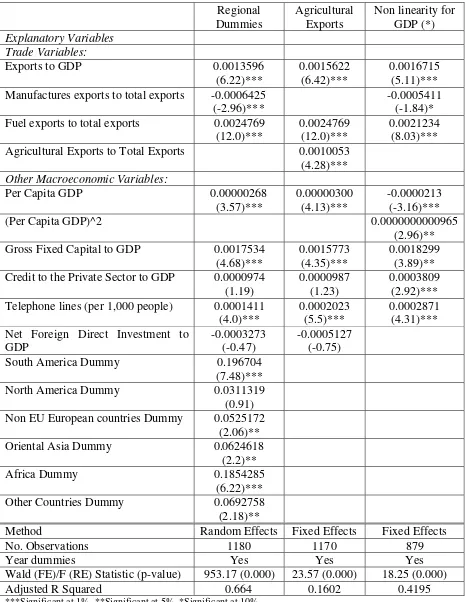
2. Robustness Checks
A number of additional specifications were carried out to evaluate the robustness of the
results just displayed. Such tests proved to be quite reassuring of the above findings,
even though some surprising estimates came out along the way. Regional dummies
were included in the first column of Table 4 in a random effects regression taking as an
arbitrary benchmark the European Union. Except for North America, regional dummies
have a positive and significant explanatory power over and above country fundamentals.
In particular, these dummies account for nothing less than 19.7 and 18.5 percentage
points in the Herfindahl index for South American and African countries. In any case,
the fact that the control set estimates show no noticeable changes and that the R Squared
goes up only moderately reinforces the confidence in the empirical model. Also,
unreported regressions alternatively excluding the European Union and North America
and including only these countries show that total exports and per capita GDP remain
highly significant, although the latter lose significance when entered jointly with
export share -they are not entered jointly due to multicolinearity. The observed positive
coefficient is in line with the hypothesis that this kind of exports is less prone to
diversification.
The last regression drops the countries in the top quartile according to per capita GDP
and adds the squared GDP to assess the presence of non-linearities. From the estimated
coefficients, it seems that diversification increases at low income levels (up to $11,036
based on the regression) and that concentration is a prevalent feature in richer countries.
The increasing complexity of the economic structure as the country goes from an
agriculture-intensive production to a more balanced one is probably behind this
temporal dynamics.7 But this argument tacitly implies a monotonic relationship rather that the U-shaped pattern unveiled by the data. Consistent with the discussion of Section
1, a suitable rationale needs to take into account that there is a broad array of pro- and
against-diversification factors, and that incentives in one or the other direction
supposedly change over the development process. The present evidence points to the
preference for diversifying away productive risks in low-income (and likely
high-volatility) countries and for the exploitation of scale economies in rich and stable
nations.
Quite interestingly, this finding coincides with independent work by Imbs and Wacziarg
(2003), who characterizes sectoral diversification as per capita GDP grows. Using
employment and value-added measures for 99 countries over 1969-1997, they find that
productivity diversification rises at low GDP levels and declines later on.8
Other unreported regressions were run. In order to pick up any possible exchange rate
effect, we loosely calculated a proxy for the real exchange rate (the nominal exchange
rate to the consumer price index), but it was not significant. Additionally, we rerun the
baseline regressions using 5-year averages instead of yearly data. This time frequency
could be helpful in case that fundamentals have a greater delayed impact on
diversification than the one assumed under the original, annual database. Even though
7
By the way, the below average Herfindahl index of European and North American countries at the beginning of the sample period can be understood from their relatively high GDP levels at the time.
8
some coefficients do change, the total exports and GDP effects remain strong. Finally,
we included different measures of macroeconomic volatility, such as the inflation rate
and the coefficient of variation of the nominal and the real exchange rate in the three
previous years, without detecting any significant effect neither for the whole sample nor
for the developing countries or the poorest countries (in the lowest income quartile)
group. Two alternative reasons can be invoked to justify this result: on one hand,
volatility is negatively correlated to other macroeconomic regressors, so it is hard to
isolate its incidence; but, on the other hand, Figures 2 to 8 above taught us that, in spite
of different situations in terms of macroeconomic stability, a majority of countries
moved toward lower Herfindahl indexes as time went by. Based on this, one could
conjecture that it was not volatility per se the key factor leading undeveloped countries
to diversify but the desire to unburden themselves from the primary product
dependence.9
9
Table 4 Robustness Checks Regional Dummies Agricultural Exports
Non linearity for GDP (*)
Explanatory Variables Trade Variables:
Exports to GDP 0.0013596
(6.22)***
0.0015622 (6.42)***
0.0016715 (5.11)*** Manufactures exports to total exports -0.0006425
(-2.96)***
-0.0005411 (-1.84)*
Fuel exports to total exports 0.0024769
(12.0)***
0.0024769 (12.0)***
0.0021234 (8.03)***
Agricultural Exports to Total Exports 0.0010053
(4.28)***
Other Macroeconomic Variables:
Per Capita GDP 0.00000268
(3.57)***
0.00000300 (4.13)***
-0.0000213 (-3.16)***
(Per Capita GDP)^2 0.0000000000965
(2.96)**
Gross Fixed Capital to GDP 0.0017534
(4.68)***
0.0015773 (4.35)***
0.0018299 (3.89)** Credit to the Private Sector to GDP 0.0000974
(1.19)
0.0000987 (1.23)
0.0003809 (2.92)*** Telephone lines (per 1,000 people) 0.0001411
(4.0)***
0.0002023 (5.5)***
0.0002871 (4.31)*** Net Foreign Direct Investment to
GDP
-0.0003273 (-0.47)
-0.0005127 (-0.75)
South America Dummy 0.196704
(7.48)***
North America Dummy 0.0311319
(0.91)
Non EU European countries Dummy 0.0525172
(2.06)**
Oriental Asia Dummy 0.0624618
(2.2)**
Africa Dummy 0.1854285
(6.22)***
Other Countries Dummy 0.0692758
(2.18)**
Method Random Effects Fixed Effects Fixed Effects
No. Observations 1180 1170 879
Year dummies Yes Yes Yes
Wald (FE)/F (RE) Statistic (p-value) 953.17 (0.000) 23.57 (0.000) 18.25 (0.000)
Adjusted R Squared 0.664 0.1602 0.4195
3. Some data and reflections on Argentina
The purpose of this section is to study export concentration approaching the recent
Argentine experience. Given the sharp devaluation of early 2002, the crisis represents
an interesting natural experiment to assess changes in export patterns following
macroeconomic adjustment10. More specifically, we try to find out if the change in the economic situation after the steep devaluation of early 2002 constitutes a new
environment that favors export diversification among Argentine firms and, especially, if
this diversification process occurs across or within firms. This is a relevant issue for
economic policy because if export diversification occurs across firms, it is necessary
new firms to enter the export business; conversely, if export diversification is a
within-firm phenomenon, eventual supporting policies should be targeted towards existing
exporting firms.
As mentioned in Section 1, from a theoretical point of view, it is not clear whether firms
should diversify or concentrate their export supply. That is why this question must be
addressed on the basis of empirical work. To undertake the analysis two main databases
of Argentina are used: The figures on aggregated exports are taken from INDEC11, while the firm-level exports come from DGA.12 The latter records the export value for all exporting firms. For the purpose of the present analysis, six-digit level was used for
1998, 2001 (pre-devaluation) and 2004. 13
The first part of this section describes changes in the real exchange rate and export
concentration in Argentina after the crisis and the second part discusses export
diversification at the firm level.
10 The descriptive analysis carried on here covers a short time period for a specific country case, so it
cannot be strictly compared with the long run cross-country econometric analysis of the previous section.
11
Instituto Nacional de Estadísticas y Censos (National Institute of Statistics and Census).
12
Dirección General de Aduana (General Direction of Customs).
13 The disaggregation level is six and eight-digit Harmonized System, respectively, for 2001 and 2004.
3.1 Relative prices and export diversification after the crisis
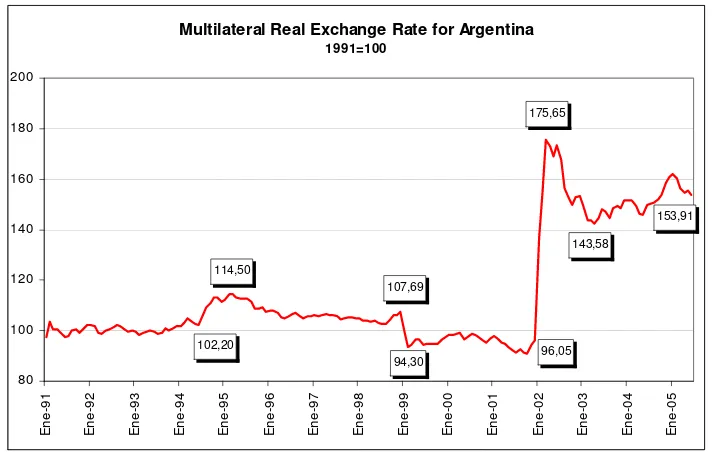
Argentine devaluation took place at the very beginning of 2002 after more than ten
years of fixed exchange rate. The value of the dollar increased by 266% between
December 2001 and July 2002. After that, the dollar showed a downward trend and
[image:20.595.119.475.214.440.2]stabilized during 2004 at a value 196% above the pre-devaluation level.
Figure 9
Multilateral Real Exchange Rate for Argentina
1991=100 153,91 96,05 107,69 143,58 175,65 94,30 114,50 102,20 80 100 120 140 160 180 200 E ne-91 E ne-92 E ne-93 E ne-94 E ne-95 E ne-96 E ne-97 E ne-98 E ne-99 E ne-00 E ne-01 E ne-02 E ne-03 E ne-04 E ne-05
Source: Centro de Economía Internacional
Titulo dentro del grafico
Figure 2 gives a better idea of the relative price adjustment in Argentina by presenting
the evolution of the multilateral real exchange rate (a measure of competitiveness
against Argentine trading partners)14 since 1991, the very year of implementation of the fixed exchange rate regime. This variable increased by as much as 81% between
December 2001 and June 2002. Even though the peso revaluated since then, the average
level in 2004 was still 61.5% above the average registered in 2001.
When these figures are taken into account, there is no doubt that there was a big change
in relative prices that stimulated a shift in resources to tradable production. That change
was the main driver of a rapid increase in exports: between 2001 and 2004, the value of
14
the goods sold abroad increased by 30%, from US$ 26,600 millions to US$ 34,550
millions15,16.
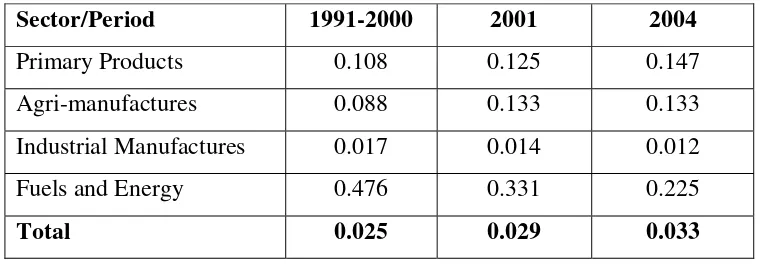
Digging into diversification trends, an interesting but still unexplored issue is to what
extent the export expansion is explained by an increase in the volume of the pre-crisis
exporting basket and/or by new goods within a more diversified export supply. Table 5
shows that, according to data at a six-digit Harmonized System level, export
concentration slightly increased between 2001 (pre-devaluation) and 2004
(pos-devaluation), with the Herfindahl index going up by just 3%. However, the aggregate
numbers hide sector-specific patterns, which actually show huge disparities. In fact,
only Industrial Manufactures and especially Fuels and Energy tended to diversify their
[image:21.595.108.488.421.554.2]export supply.
Table 5
Herfindahl Index in Argentina, 1990-2004
By Type of Good
Sector/Period 1991-2000 2001 2004
Primary Products 0.108 0.125 0.147
Agri-manufactures 0.088 0.133 0.133
Industrial Manufactures 0.017 0.014 0.012
Fuels and Energy 0.476 0.331 0.225
Total 0.025 0.029 0.033
Source: Own elaboration based on INDEC database
To try to understand the impact of the crisis on export diversification at the level of
firms, two kinds of questions are addressed in what follows: (a) Has export
diversification patterns change after the 2002 crisis among the top exporters in business
both in 2001 and 2004? These firms represent about 82% of total Argentine exports in
2004; and (b) Has export diversification occur across firms or within firms?
15 During the same period, quantities exported increased by 13%. 16
The next step is to analyze within-firm and across-fim diversification for the top
exporters who exported in each and every of the following years: 1998, 2001 and
200417. In order to measure within-firm diversification, a Herfindahl index for each of the firms of the sample is calculated for the three years. To get an aggregate idea of
diversification, both a simple and a weighted (by export volume) average are computed.
[image:22.595.126.473.321.435.2]A similar procedure was employed to measure across-firm diversification.
Table 6
Diversification for top 500 exporters in Argentina
Herfindahl Index
Simple average Weighted average
Total Across firms Within firms Across firms Within firms
1998 0,032 0,802 0,601 0,394 0,418
2001 0,035 0,795 0,606 0,409 0,477
2004 0,048 0,783 0,576 0,355 0,457
Source: Own elaboration based on DGA database
As Table 6 shows, across and within-firm Herfindahls went down between 2001 and
2004, both for simple and weighted averages. This means that, after the 2002
devaluation, product supply became more diversified among the top 500 exporting
firms.18
Nevertheless, the first column in Table 6 indicates that, taking the top 500 exporters as a
whole, the level of concentration increased between 2001 and 2004, thus confirming the
previous finding on aggregate exports. In view of the claims from the previous
paragraph, this finding might be puzzling. However, a plausible explanation is that
devaluation makes profitable for a wide set of firms to sell abroad products that, before
the change in relative prices, could only be exported by a few firms that were able to
compete in international markets. In that way, firms diversify their export menu
17
The top 500 exporting firms in 2004 that also exported in 2001 account for 442 firms in 1998.
18
firm diversification). At the same time, these products are exported by more firms
(across-firm diversification). However, since some of these products also gain more
Conclusions
Based on data for 56 countries over 1962-2002, this study has unveiled a number of
regularities regarding the determinants of export diversification around the world,
namely:
• Diversification has been increasing in most countries
• Against common knowledge, good macroeconomic performance appears to
stimulate export concentration rather than diversification.
• The development-export diversification nexus, though, appears to be governed by a U-shaped pattern, whereby diversification increases at low income levels
and concentration prevails at high income levels.
• Exporters of primary products tend to have more focused export structures than exporters of manufactures, everything else equal.
• South America and Africa display levels of export concentration higher than other regions, which are not explained by measurable macroeconomic factors.
When the particular post-2002 crisis case of Argentina is examined, an increase in focus
is recorded, along with more diversification when looking at average across- and
within-firm Herfindahl index. This observation has probably to do with a massive
switch of many firms toward new some profitable exportable products, which by itself
increased the number of exporters (across-firm diversification) and the number of
References
Baltagi B. (2003), Econometric Analysis of Panel Data.
Bebczuk R. (2001), “Promoción de exportaciones en Argentina”, Report prepared for Fundación Capital, Buenos Aires, Argentina.
Berrettoni D. (2003), “Oportunidades y Amenazas de un Acuerdo Mercosur-Comunidad Andina para Argentina y Brasil”. Estudios del CEI N°5, Centro de Economía Internacional, Setiembre.
Berrettoni D. and J. Carrera (2002), “Oportunidades y Amenazas del ALCA para la Argentina. Un Estudio de Impacto Sectorial”, Estudios del CEI N°2, Centro de Economía Internacional, Diciembre.
Blomström M. and A. Kokko (2003), “From natural resources to high-tech production: the evolution of industrial competitiveness in Sweden and Finland”, CEPR Discussion Papers No. 3804.
Bonaglia F. and K. Fukasaku (2003), “Export Diversification in Low-Income Countries: An International Challenge after Doha”, Working Paper No.209, OECD.
Fanelli J. and R. Medhora (2002), eds., Finance and Competitiveness in Developing Countries, Routleged, London and New York.
Hausman R., J. Hwang and D. Rodrik (2005), “What You Export Matters”, NBER Working Paper No. 11905, December.
Herzer D. and F. Nowak-Lehmann (2004), “Export Diversification, Externalities and Growth”, Discussion Papers Nr.99, Ibero-America Institute for Economic Research, Gottinger, Germany.
Herzer D. and F. Nowak-Lehmann (2005), “What Does Export Diversification Do For Growth? An Econometric Analysis”, Working Paper, Ibero-America Institute for Economic Research, Gottinger, Germany.
Imbs J. and R. Wacziarg (2003), “Stages of Diversification”, American Economic Review, Vol. 93, No.1, 63-86.
Lederman D. and W. Maloney (2003), “Trade Structure and Growth”, Policy Research Working Paper, No. 3025, World Bank.
Maloney W. (2002), “Missed Opportunities: Innovation and Resource-Based Growth in Latin America”, Policy Research Working Paper, No. 2935, World Bank.
Ng C. (2005), “Is Natural Resource Abundance A Curse or A Blessing?”, mimeo.
Ross S., R. Westerfield and J. Jaffee (1996), Corporate Finance, Irwin.
Sachs J. and A. Warner (1995), “Natural Resource Abundance and Economic Growth”, NBER Working Paper, No. 5398.
Strobl E. (2004), “Export Diversification and Price Uncertainty in Developing Countries: A Portfolio Theory Approach”, mimeo, University of Paris X-Nanterre.
Wright G. and J. Czelusta (2002), “Exorcising the Resource Curse: Minerals as a Knowledge Industry, Past and Present”, Stanford University, Working Papers No. 02-008..
Wong (1995), International Trade in Goods and Capital Mobility, MIT Press, Cambridge.