The World in
2050
The accelerating shift of global
economic power: challenges and
opportunities
Table of Contents
Summary 3
1. Introduction 4
2. Approach 5
PPPs vs. market exchange rates 6
3. Relative size of economies 7
GDP at PPPs projections 8
GDP at MERs projections 11
The Indian growth tiger 14
Dominance of Big 3 economies 18
4. Projected economic growth rates to 2050 20
5. Comparison of GDP per capita levels 23
6. Conclusions and implications for business 24
About the authors 25
Summary
In March 2006 we produced a report setting out projections for potential growth in GDP in 17 leading
economies over the period to 2050. These projections were updated in March 2008 and we are now revisiting them again in the aftermath of the global financial crisis, extended now to cover all G20 economies.
Our key conclusion is that the global financial crisis has further accelerated the shift in global economic power to the emerging economies. Measured by GDP in purchasing power parity (PPP) terms, which adjusts for price level differences across countries, the largest E7 emerging economies seem likely to be bigger than the current G7 economies by 2020, and China seems likely to have overtaken the US by that date. India could also overtake the US by 2050 on this PPP basis.
If instead we look at GDP at market exchange rates (MERs), which does not correct for price differences across economies but may be more relevant for practical business purposes, then the overtaking process is slower but equally inexorable. The Chinese economy would still be likely to be larger than that of the US before 2035 and the E7 would overtake the G7 before 2040. India would be clearly the third largest economy in the world by 2050, well ahead of Japan and not too far behind the US on this MER basis.
In many ways this renewed dominance of China and India, with their much larger populations, is a return to the historical norm prior to the Industrial Revolution of the late 18thand 19thcenturies that caused a shift in global economic power to Western Europe and the US – this temporary shift in power is now going into reverse. This changing world order poses both challenges and opportunities for businesses in the current advanced economies. On the one hand, competition from emerging market multinationals will increase steadily over time and the latter will move up the value chain in manufacturing and some services (including financial services given the weakness of the Western banking system after the crisis).
At the same time, rapid growth in consumer markets in the major emerging economies associated with a fast growing middle class will provide great new opportunities for Western companies that can establish themselves in these markets. These will be highly competitive, so this is not an easy option – it requires long term
investment – but without it Western companies will increasingly be playing in the slow lane of history if they continue to focus on markets in North America and Western Europe.
This applies not least to the UK, which currently sells only around 7% of its exports to the BRICs (even
1.
Introduction
In March 2006 we produced a report setting out projections for potential growth in GDP in 17 leading
economies over the period to 2050. These projections were updated in March 2008 and we are now revisiting them again in the aftermath of the global financial crisis.
In this paper, we update the GDP forecasts for the G20 economies plus Nigeria and Vietnam. These include the current G7 (US, Japan, Germany, UK, France, Italy and Canada), plus Spain, Australia and South Korea among the current advanced economies. It also includes the seven largest emerging market economies, which we refer to collectively as the ‘E7’ (China, India, Brazil, Russia, Indonesia, Mexico and Turkey), as well as South Africa, Argentina, Saudi Arabia, Nigeria and Vietnam. Our analysis suggests that this group of countries should include the 20 largest economies in the world looking ahead to the middle of this century, although of course there are always considerable uncertainties about any such long-term projections that need to be borne in mind.
The rest of the paper is structured as follows:
Section 2 outlines our methodological approach.
Section 3 summarises our findings on the relative size of different economies, now and in 2050, in terms of two alternative measures of GDP at market exchange rates (MERs) and at purchasing power parities (PPPs).
Section 4 sets out our results for relative growth rates of the economies over the period to 2050.
Section 5 compares the relative levels of GDP per capita in PPP terms of the G7 and E7 economies.
2.
Approach
We began by collecting data on GDP at purchasing power parities (PPPs1) and at market exchange rates (MERs) for 2009 from the World Bank. We included all of the current G20 economies, plus Vietnam and Nigeria. The latter two countries are currently outside the top 20 economies ranked by GDP, but have strong long-term growth potential that makes them worth including in such an analysis.
We use World Bank data up to 2009 and our own short term projections for real GDP growth between 2009 and 2014 and estimated long-term trend growth from 2015 to 20502. These longer term trend growth estimates are based on the same model as used in our 2006 and 2008 World in 2050 reports and described in more detail there, but with updated data3. The essence of the model is that long-term trend growth is driven by the
following key factors:
Growth in the labour force of working age (based on the latest UN population projections).
Increases in human capital, proxied here by average education levels across the adult population.
Growth in the physical capital stock, which is driven by capital investment net of depreciation.
Total factor productivity growth, which is driven by technological progress and catching up by lower income countries with richer ones by making use of their technologies and processes.
The emerging economies have stronger potential growth than the established OECD economies on most of these measures, although it should be stressed that this assumes they continue to follow broadly growth-friendly policies. In this sense, the projections are of potential future GDP if such policies are followed, rather than predictions of what will actually happen, bearing in mind that some countries may not be able to sustain such policies in practice.
There are, of course, also many other uncertainties surrounding these long-term growth projections, so more attention should be paid to the broad trends indicated rather than the precise numbers quoted in the rest of this report. The broad conclusions reached on the shift in global economic power from the G7 to the E7 emerging economies should, however, be robust to these uncertainties, provided that there are no catastrophic shocks that derail the overall global economic development process.
1We use the latest published World Bank estimates of GDP at PPPs for 2009 as the starting point for this analysis.
2In a few cases where short term PwC GDP projections were unavailable, we used short term forecasts from the IMF or consensus forecasts. In a few cases where these short term growth rate projections were significantly different to the long term trend growth rate projections from our model, an adjustment was made to allow a smoother transition from the short term to long term rates during the 2015-19 period.
3The World in 2050 series of past reports are available to download from our global website at:
PPPs vs. market exchange rates
GDP at PPPs is a better indicator of average living standards or volumes of outputs or inputs, because it corrects for price differences across countries at different levels of development. In general, price levels are significantly lower in emerging economies so looking at GDP at PPPs narrows the income gap with the advanced economies compared to using market exchange rates.
However, GDP at MERs is a better measure of the relative size of the economies from a business perspective, at least in the short term. For long run business planning or investment appraisal purposes, it is crucial to factor in the likely rise in real market exchange rates in emerging economies towards their PPP rates. This could occur either through relatively higher domestic price inflation in these emerging economies, or through nominal exchange rate appreciation, or (most likely) some combination of both of these effects.
When estimating GDP at market exchange rates in 2050, a similar methodology is therefore adopted as in the original World in 2050 report where market exchange rates are converging to PPP rates with different converging factors depending on the type of economy. This leads to projections of significant rises in real market exchange rates for the major emerging market economies due to their higher productivity growth rates, although these projected MERs still fall some way below PPP levels in 2050 for the least developed emerging markets.
3.
Relative size of economies
In our base case projections, the E7 economies will by 2050 be around 64% larger than the current G7 when measured in dollar terms at market exchange rates (MER), or around twice as large in PPP terms. This is a significantly larger gap than in our original 2006 report owing to the stronger growth of the E7 economies relative to the G7 through the period of the financial crisis, which to some extent has caused us to revise up also our longer term estimates of trend growth in the E7 relative to the G7.
In contrast, the E7 is currently only around 36% of the size of the G7 at market exchange rates and around 72% of its size in PPP terms (see Figure 1 below).
GDP at PPPs projections
Looking at Figure 2, we can note that:
There has been rapid convergence between the E7 and the G7 in recent years, accelerated by the global financial crisis. In 2007, total G7 GDP at PPPs was still around 60% larger than total E7 GDP. By 2010, we estimate the gap had shrunk to only around 35%.
The catch-up process is set to continue over the next decade: by 2020 total E7 GDP at PPPs could already be higher than total G7 GDP, although any difference would still be within the margin of error of such projections.
In the following decade from 2020 to 2030, however, the process of overtaking is likely to be reinforced, with total E7 GDP projected to be around 44% higher by 2030 than total G7 GDP in PPP terms. The gap would widen further beyond that, with the E7 almost twice as large as the G7 by 2050 in PPP terms. The key drivers of the E7’s growth are China and India, although the former’s growth will slow down
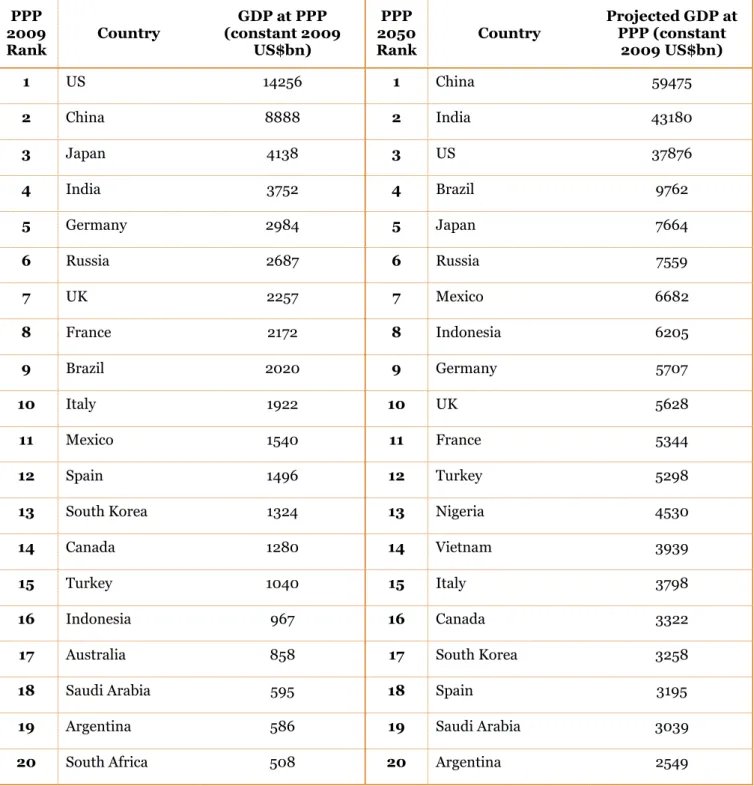
Table 1 above shows the summary of GDP projections for 2050 measured at PPPs. The most notable changes compared to the 2009 position are China and India rising to the top 2 positions above the US by 2050. The next notable change in the rankings is Brazil rising above Japan in GDP at PPP terms. Additionally, Indonesia could potentially rise significantly in the rankings to eighth place by 2050.
Table 1: GDP at PPPs rankings
PPP 2009
Rank Country
GDP at PPP (constant 2009
US$bn)
PPP 2050
Rank Country
Projected GDP at PPP (constant
2009 US$bn)
1 US 14256 1 China 59475
2 China 8888 2 India 43180
3 Japan 4138 3 US 37876
4 India 3752 4 Brazil 9762
5 Germany 2984 5 Japan 7664
6 Russia 2687 6 Russia 7559
7 UK 2257 7 Mexico 6682
8 France 2172 8 Indonesia 6205
9 Brazil 2020 9 Germany 5707
10 Italy 1922 10 UK 5628
11 Mexico 1540 11 France 5344
12 Spain 1496 12 Turkey 5298
13 South Korea 1324 13 Nigeria 4530
14 Canada 1280 14 Vietnam 3939
15 Turkey 1040 15 Italy 3798
16 Indonesia 967 16 Canada 3322
17 Australia 858 17 South Korea 3258
18 Saudi Arabia 595 18 Spain 3195
19 Argentina 586 19 Saudi Arabia 3039
20 South Africa 508 20 Argentina 2549
South Africa and Australia are projected to exit the top 20 PPP rankings by 2050, while Nigeria and Vietnam are expected to enter the top 20 rankings at 13thand 14threspectively by 2050 (assuming they can continue to follow broadly growth-friendly policies – whether they will fully realise their long-term economic potential remains to be seen).
The UK, as would be expected given it is a relatively mature advanced economy, is projected to fall in the GDP rankings, but should just about remain in the top ten in 2050.
The UK, in common with other large European economies, is projected to see its share of world GDP fall gradually over the next 40 years. Figure 3 above shows the gradual fall of the UK’s share of world GDP at PPPs over the period. A similar trend is observed in the UK’s share of world GDP at MERs with the gap between the two lines slowly closing (as one would expect due to the market exchange rates converging slowly to the PPP rates). We discuss projections for GDP at MERs for all countries further below.
The UK might do somewhat better than our projections suggest if it can fully seize the opportunities provided by the fast-growing emerging markets. The UK currently heavily relies on exporting to the US and the EU, while a small share of exports are going towards the BRICs (only around 7%4in 2009 even including Hong Kong as part of China – this was about the same as the share of UK exports going to Ireland in 2009). If increased trade and investment between the UK and the E7 economies can be achieved, the UK economy and consumers can benefit from the high growth of the emerging economies and might do somewhat better than our projections suggest, although the UK will still not be able to grow as quickly as the emerging economies themselves.
GDP at MERs projections
The figure above illustrates:
In 2009, total E7 GDP at MERs was still only around 35% of total G7 GDP at MERs.
The catch-up process, accelerated by the financial crisis, will pick up over the next decade: by the end of 2020, we estimate that total E7 GDP at MERs will rise to around 70% of total G7 GDP at MERs, which would be approximately double the ratio in 2009.
In the following decade from 2020 to 2030, the process of catching-up is likely to be nearly completed, with total E7 GDP at MERs projected to be around 97% of total G7 GDP in 2030.
By the end of 2032 total E7 GDP at MERs could already be slightly higher than total G7 GDP at MERs, although any difference would be well within the margin of error of such projections.
China’s rate of gain on the US is projected to slow down progressively after 2020 because of its rapidly ageing population (which has been accentuated by its one child policy for the past 30 years). Although the exact date of overtaking is open to considerable uncertainty, it seems highly likely that China will emerge as the largest economy at MERs by 2040, ending over a century of US economic primacy. This is subject to our assumptions on the degree of convergence of China’s market exchange rate with the PPP exchange rate, which are plausible but nonetheless subject to significant uncertainty.
Table 2: GDP at MER rankings
MER 2009
Rank Country
GDP at MER (constant 2009
US$bn)
MER 2050
Rank Country
Projected GDP at MER (constant 2009
US$bn)
1 US 14256 1 China 51180
2 Japan 5068 2 US 37876
3 China 4909 3 India 31313
4 Germany 3347 4 Brazil 9235
5 France 2649 5 Japan 7664
6 UK 2175 6 Russia 6112
7 Italy 2113 7 Mexico 5800
8 Brazil 1572 8 Germany 5707
9 Spain 1460 9 UK 5628
10 Canada 1336 10 Indonesia 5358
11 India 1296 11 France 5344
12 Russia 1231 12 Turkey 4659
13 Australia 925 13 Italy 3798
14 Mexico 875 14 Nigeria 3795
15 South Korea 833 15 Canada 3322
16 Turkey 617 16 Spain 3195
17 Indonesia 540 17 South Korea 2914
18 Saudi Arabia 369 18 Vietnam 2892
19 Argentina 309 19 Saudi Arabia 2708
20 South Africa 286 20 Australia 2486
Table 2 above summarises our GDP projections to 2050 measured at MERs. The most notable ranking changes are China moving into the top position above the US by 2050 and India rising to third position by that date just below the US. The next notable change in the rankings is Brazil and Russia rising above Germany. Mexico is projected to break into the top 10 rankings in seventh position as it narrowly edges out Germany, but this is subject to some uncertainty. Indonesia could potentially rise significantly in the ranks to tenth place, narrowly edging out France but this is also subject to considerable uncertainty. The UK, as expected, is projected to fall in the rankings but will just about remain in the top ten in 2050 based on these projections.
Another notable change is that, by 2050, Nigeria and Vietnam could have the potential to rise into the top 20, being ranked 14thand 18threspectively according to our model estimates. However, this depends on them continuing to follow growth-friendly policies, which will represent a significant challenge, particularly for Nigeria, which needs to diversify its economy away from its current dependence on oil in the long run if it is to realise its potential, as well as addressing governance issues. Australia, Italy, Canada and Spain are projected to see significant falls in their GDP rankings as the emerging economies continue to grow much faster than them in the next few decades. Argentina and South Africa would drop out of the top 20 GDP rankings based on our projections, since their potential growth rates are not as fast as those of other emerging economies.
The Indian growth tiger
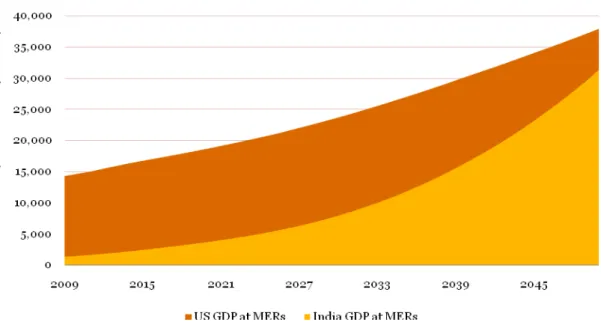
The most significant increases in share of world GDP at MERs are projected to be achieved by India, which deserves special mention here. In 2009, India’s share of world GDP at MERs was just 2%. By 2050, this share could grow to around 13% according to our analysis.
Figure 6 below illustrates India’s rapid long-term rise in GDP at MERs relative to the US. India has the
to India having a significantly younger and faster growing working age population than China and due to it having more potential for growth as it is starting from a lower level of economic development than China and so has more catch-up potential. However, India will only fully realise this great potential if it continues to pursue the growth-friendly economic policies of the last two decades. Looking ahead, particular priorities will be maintaining a prudent fiscal policy stance, further extending its openness to foreign trade and investment, significantly increased investment in transport and energy infrastructure, and improved educational standards, particularly for women and those in rural areas of India.
In the course of this process, the drivers of growth are likely to change. India is likely to become less dependent on outsourcing and more on manufacturing exports, building on its strong engineering skills and rising levels of education in the general population over the next decade. Consumer markets in major Indian cities will also become increasingly attractive to international companies as the size of the middle class there grows rapidly over time.
Table 3: When could the E7 economies overtake the G7 in GDP at PPP and MER rankings?
Year GDP at PPP ranking changes GDP at MER ranking changes
2010 China overtakes Japan, India overtakes Canada
2011 India overtakes Japan, Brazil overtakes France India overtakes Spain, Russia overtakes Canada
2012 Russia overtakes Spain, Mexico overtakes Australia
2013 Brazil overtakes the UK
2014 Russia overtakes Germany India overtakes Brazil
2015 Indonesia overtakes Turkey India overtakes Italy
2016 India overtakes the UK
2017 Brazil overtakes Italy, Indonesia overtakes Turkey
2018 China overtakes US, Indonesia overtakes Canada India overtakes France
2019 Mexico overtakes Italy
2020 Turkey overtakes Canada
2021 Indonesia overtakes Spain
2022 India overtakes Germany, Russia overtakes Italy
2023 Brazil overtakes the UK, Indonesia overtakes Australia
2024 Indonesia overtakes South Korea, Turkey overtakes
Spain Mexico overtakes Canada, Turkey overtakes Australia
2025 Brazil overtakes Germany Mexico overtakes Spain
2027 Brazil overtakes France
2028 Mexico overtakes France, Turkey overtakes South Korea India overtakes Japan
2029 Russia overtakes UK, Indonesia overtakes South Korea
2030 Indonesia overtakes Italy
2031 Mexico overtakes the UK Turkey overtakes South Korea
2032 China overtakes US, Brazil overtakes Germany, Indonesia overtakes Canada
2033 Turkey overtakes Italy Russia overtakes France, Indonesia overtakes Spain
2034 Mexico overtakes Italy
2035 Turkey overtakes Spain
2037 Brazil overtakes Russia
2039 Brazil overtakes Japan, Mexico overtakes Germany Indonesia overtakes Italy
2040 Indonesia overtakes France
2042 Russia overtakes Germany, Turkey overtakes Italy
2044 Indonesia overtakes the UK Brazil overtakes Japan
2045 India overtakes US
2047 Indonesia overtakes Germany
2048 Mexico overtakes the UK
2050 Mexico overtakes Germany, Indonesia overtakes France
Of course, these overtaking date projections are subject to increasing degrees of uncertainty as you move out in time, but the change in rankings should occur in approximately the same order even if the precise dates differ from those shown in Table 3. The pattern projected is similar in both rankings: over the next 40 years, the E7 economies will continue to rise above the G7 economies.
Dominance of Big 3 economies
A key outcome of the future prevalence of the E7 will be the sheer size of the top 3 economies (China, the US and India), which will account for approximately 50% of the world GDP at MERs compared to the current figure of around 40%. The EU economy might be of broadly comparable scale to these Big 3 economies in 2050, but only if it acts as a single entity, which will always be challenging for a union of 27 member states. Individual EU member states will inevitably be much smaller than any of the Big 3 by 2050.
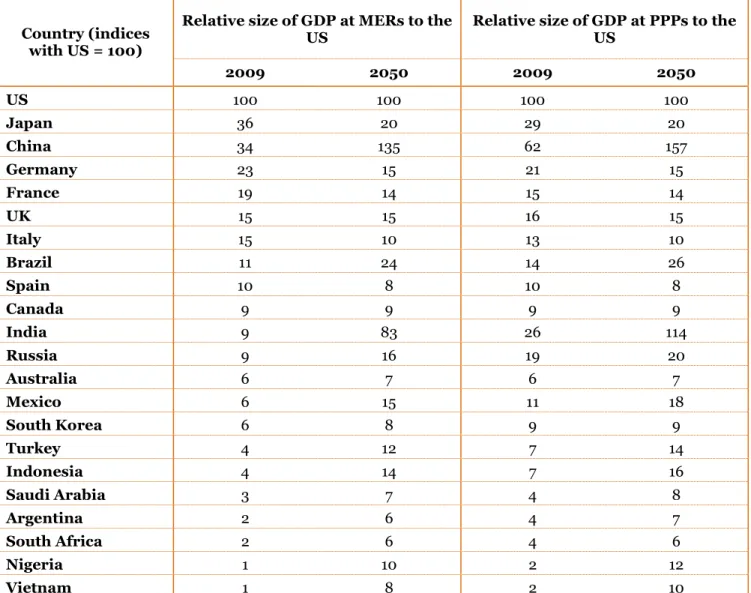
Table 4 below illustrates the current and projected sizes of all economies considered in this study relative to the US at both MERs and PPPs in 2009 and 2050. The US is currently by far the largest economy when measured by GDP at both PPPs and MERs. It also shows the relative size of the other economies as compared to the US. China, India and Russia can be seen from this to have particularly large disparities between GDP measured at PPPs and MERs – the gap is somewhat smaller for Brazil.
Table 4: Current and projected relative size of economies in 2009 and 2050 to the US (US = 100)
Relative size of GDP at MERs to the
US Relative size of GDP at PPPs to theUS
Country (indices with US = 100)
2009 2050 2009 2050
US 100 100 100 100
Japan 36 20 29 20
China 34 135 62 157
Germany 23 15 21 15
France 19 14 15 14
UK 15 15 16 15
Italy 15 10 13 10
Brazil 11 24 14 26
Spain 10 8 10 8
Canada 9 9 9 9
India 9 83 26 114
Russia 9 16 19 20
Australia 6 7 6 7
Mexico 6 15 11 18
South Korea 6 8 9 9
Turkey 4 12 7 14
Indonesia 4 14 7 16
Saudi Arabia 3 7 4 8
Argentina 2 6 4 7
South Africa 2 6 4 6
Nigeria 1 10 2 12
Vietnam 1 8 2 10
by 2050 or around 57% larger in PPP terms. As mentioned earlier, India has the potential to be the fastest growing large economy in the world over the period to 2050, when its GDP could potentially be around 83% of that of the US at MERs and somewhat larger than that of the US in PPP terms.
In many ways this renewed dominance of China and India, with their much larger populations, is a return to the historical norm5prior to the Industrial Revolution of the late 18thand 19thcenturies that caused a shift in global economic power to Western Europe and the US – this temporary shift in power is now going into reverse. These base case projections also suggest that:
Brazil’s economy would be of similar size or even larger than Japan by 2050 in both MER and PPPs terms but only 20-25% of the size of the US economy
Mexico would also grow relatively rapidly, being larger than both Germany and the UK in both MER and PPPs terms by 2050.
Indonesia would grow rapidly and become nearly the same size as the UK and France at MER and larger in PPP terms.
Russia would grow significantly more slowly due to its declining working age population, but would still become larger than Germany and the UK in both MER and PPPs terms.
Of course, as noted above, there are many uncertainties surrounding the precise numbers shown in Table 4, but the broad trends identified should be relatively robust to variations in particular countries.
Our focus in this section has been on the relative size of economies. In the next section we focus instead on relative projected growth rates.
5
4.
Projected economic growth
rates to 2050
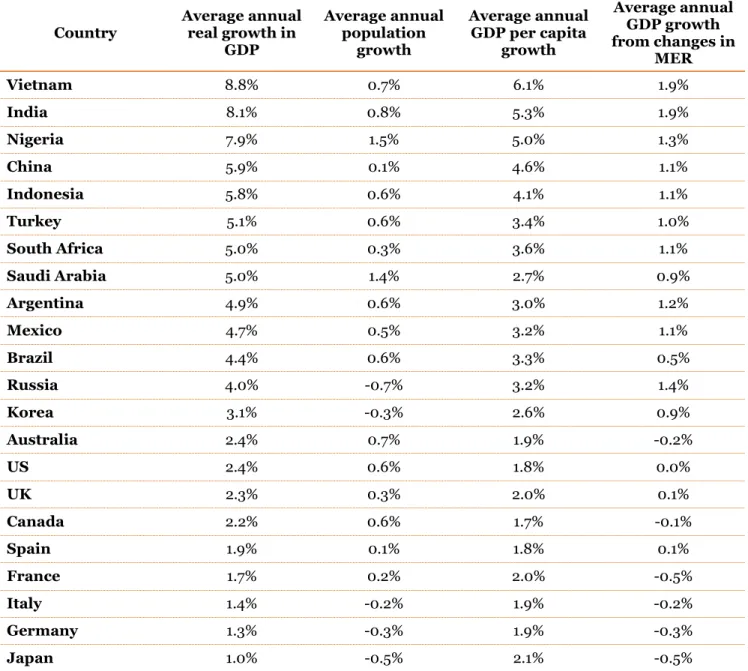
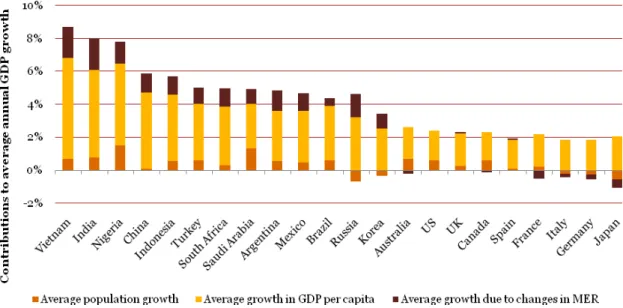
Table 5: Projected real growth in GDP and its components of growth (2009-50)
Country Average annualreal growth in GDP
Average annual population
growth
Average annual GDP per capita
growth
Average annual GDP growth from changes in
MER
Vietnam 8.8% 0.7% 6.1% 1.9%
India 8.1% 0.8% 5.3% 1.9%
Nigeria 7.9% 1.5% 5.0% 1.3%
China 5.9% 0.1% 4.6% 1.1%
Indonesia 5.8% 0.6% 4.1% 1.1%
Turkey 5.1% 0.6% 3.4% 1.0%
South Africa 5.0% 0.3% 3.6% 1.1%
Saudi Arabia 5.0% 1.4% 2.7% 0.9%
Argentina 4.9% 0.6% 3.0% 1.2%
Mexico 4.7% 0.5% 3.2% 1.1%
Brazil 4.4% 0.6% 3.3% 0.5%
Russia 4.0% -0.7% 3.2% 1.4%
Korea 3.1% -0.3% 2.6% 0.9%
Australia 2.4% 0.7% 1.9% -0.2%
US 2.4% 0.6% 1.8% 0.0%
UK 2.3% 0.3% 2.0% 0.1%
Canada 2.2% 0.6% 1.7% -0.1%
Spain 1.9% 0.1% 1.8% 0.1%
France 1.7% 0.2% 2.0% -0.5%
Italy 1.4% -0.2% 1.9% -0.2%
Germany 1.3% -0.3% 1.9% -0.3%
Japan 1.0% -0.5% 2.1% -0.5%
Table 5 above summarises our estimates of average annual real GDP growth in 2009-50 in US $ terms (i.e. including the effect of real exchange rate changes relative to the dollar) and in domestic currency and PPP terms6. It also shows the different components of this growth rate.
The first point to note is that, as mentioned earlier, India has the potential to have the highest growth rate among the largest E7 emerging economies. While it has a very high projected annual growth rate, Vietnam’s GDP at PPPs will only be 10% of the US even by 2050 and hence it cannot be classed as a large economy comparable with China or India. Nigeria’s high growth rate is also subject to a considerable degree of uncertainty due to its need to address issues relating to current over-dependence on oil and various institutional and governance issues that have held back its growth potential in some past periods.
Russia’s growth is expected to be the slowest of the E7 due in particular to its sharply declining working age population. Of the G7 economies, the US has the highest projected average annual growth rate of 2.4% followed by the UK at 2.3%. Japan is expected to have the slowest growth rate at 1% per annum. Australia has a relatively strong growth rate for an advanced economy due to its strength in natural resources and relative proximity to the Chinese market in particular.
Figure 7 above breaks down the projected average annual GDP growth rate into three components contributing either positively or negatively:
1. Growth in GDP due to population growth.
2. Real growth in GDP per capita (in domestic currency terms or PPPs).
3. Growth in GDP in dollar terms due to effects of changes in market exchange rates.
and education levels across the population are currently lower in India than in China, giving it a greater scope to catch up in the long run, provided that India can maintain the right kind of institutional policy framework to support economic growth.
As is the case for India, Vietnam’s and Nigeria’s relatively high potential growth rates stem from average productivity and education levels across the population being lower than in China and most other emerging economies. In addition, Nigeria has the largest expected contribution from population growth over the next 40 years, which will significantly increase its working age population contributing to GDP growth. However, both countries are currently relatively small compared to the BRICs.
China’s growth to date has been driven by very high savings and capital investment rates, but experience with Japan and other ‘Asian tigers’ suggests that such investment-driven growth eventually runs into diminishing returns once income levels approach OECD levels. As China ages, it is also likely that its savings rate will drop as assets are ‘cashed in’ to pay for the retirement of its ageing population (although we still assume that Chinese savings and investment rates remain somewhat above OECD average levels in the long run in our base case projections).
Other emerging economies with relatively young, fast-growing populations include Indonesia, Turkey, Brazil and Mexico. The key to them achieving the growth potential indicated by our model will be establishing and maintaining a macroeconomic, legal and public policy environment conducive to trade, investment, increased education levels and hence economic growth. This is by no means guaranteed in any of these economies, but progress over the past 5 years has generally been positive in all of these countries, which gives some grounds for optimism.
South Korea and Russia are in a different category, with relatively strong expected growth in GDP per capita (particularly in Russia), but declining populations that hold back overall GDP growth
5.
Comparison of GDP per capita
levels
It is also interesting to look at income per capita levels based on GDP in PPP terms as an indicator of relative living standards in different economies. As shown in Figure 8 and Table 6, the E7 economies will still remain some way behind the G7 economies on this basis even in 2050. But they will catch up gradually over time, with Chinese average income levels being just under half those in the US by 2050 and Indian average income levels being around a quarter of those in the US at that time.
Table 6: Relative GDP per capita levels in PPP terms (US = 100)
2009 2030 2050
US 100 100 100
Japan 71 78 79
Germany 79 80 82
UK 81 83 87
France 76 79 83
Italy 71 74 74
Canada 84 83 83
China 14 33 45
India 7 15 28
Brazil 22 31 41
Russia 42 67 74
Indonesia 9 16 22
Mexico 31 43 54
Turkey 30 43 57
6.
Conclusions and implications
for business
The first important point to note from our analysis is that there is no single right way to measure the relative size of emerging economies such as China and India as compared to the G7 economies. Depending on the purpose of the exercise, GDP at either market exchange rates (MERs) or purchasing power parities (PPPs) may be the most appropriate measure. In general, GDP at PPPs is a better indicator of average living standards or volumes of outputs or inputs, while GDP at MERs is a better measure of the current value of markets from a shorter term business perspective. In the long run, however, it is important that business planners take into account the likely rise in real market exchange rates in emerging economies towards their PPP rates, although our modelling suggests that, for countries such as China and India, this exchange rate adjustment may still not be fully complete even by 2050.
Secondly, in our base case projections, the E7 economies will by 2050 be around 64% larger than the current G7 when measured in dollar terms at projected MERs, or around twice as large in PPP terms. In contrast, total E7 GDP is currently only around 36% of the size of total G7 GDP at market exchange rates and around 72% of its size in PPP terms.
Thirdly, there are likely to be notable shifts in relative growth rates within the E7, driven by demographic trends. In particular, both China and Russia are expected to experience significant declines in their working age populations over the next 40 years. In contrast, countries like India, Indonesia, Brazil, Turkey and Mexico (being relatively younger) should on average show higher positive growth over the next 40 years. However, they too will have begun to see the effects of ageing by the middle of the century.
Fourth, India has the potential to be the fastest growing large economy in the world over the period to 2050, with a projected GDP at the end of this period close to 83% of that of the US at MER, or 14% larger than the US in PPP terms. China, despite its projected marked growth slowdown, is projected to be around 35% larger than the US at MERs by 2050, or around 57% larger in PPP terms. China could overtake the US as the world’s largest economy as early as 2018 based on GDP at PPPs, or around 2032 based on GDP at MERs.
Fifth, while the G7 economies will almost inevitably see their relative GDP shares decline (although their average per capita incomes will remain well above those in emerging markets), the rise of the E7 economies should boost average G7 income levels in absolute terms through creating major new market opportunities. This larger global market should allow businesses in G7 economies to specialise more closely in their areas of comparative advantage, both at home and overseas, while G7 consumers continue to benefit from low cost imports from the E7 and other emerging economies.
Sixth, trade between the E7 and the G7 should therefore be seen as a mutually beneficial process for economies and businesses: a win-win proposition, not a zero sum competitive game. This is certainly true for UK
This publication has been prepared for general guidance on matters of interest only, and does not constitute professional advice. You should not act upon the information contained in this publication without obtaining specific professional advice. No representation or warranty (express or implied) is given as to the accuracy or completeness of the information contained in this publication, and, to the extent permitted by law, PricewaterhouseCoopers LLP, its members, employees and agents do not accept or assume any liability, responsibility or duty of care for any consequences of you or anyone else acting, or refraining to act, in reliance on the information contained in this publication or for any decision based on it.
© 2011 PricewaterhouseCoopers LLP. All rights reserved. ‘PwC’ or 'PricewaterhouseCoopers' refers to
PricewaterhouseCoopers LLP (a limited liability partnership in the United Kingdom) or, as the context requires, the
This paper was written by John Hawksworth and Anmol Tiwari of the PwC economics practice in London. The report will be available from our website in soft copy only. Queries on the technical content of the report should be sent by e-mail [email protected]
Economics
The PwC economics practice offers a wide range of advisory services covering competition and regulation issues, litigation support, bids and business cases, public policy and project appraisals, financial economics, the economics of sustainability and macroeconomics. We cover all industry sectors but with particular specialisms in energy and utilities, media, technology and telecommunications, transport, health and the public sector. For more details of these services, please visit our website (www.pwc.co.uk/economics) or contact:
David Lancefield [email protected] +44 (0)207 213 2263
Tim Ogier [email protected] +44 (0)207 804 5207
Yael Selfin [email protected] +44 (0)207 804 7630