Behavioural flexibility: evolutionary past and its role in a changing world
199
0
0
Texto completo
(2)
(3) Behavioural Flexibility: evolutionary past and its role in a changing world. Cesar González-Lagos. Dr. Daniel Sol Rueda Supervisor. Thesis submitted for the Degree of Doctor “Doctorat en Ecologia Terrestre” Center for Ecological Research and Forestry Applications Autonomous University of Barcelona. 2012.
(4)
(5) To my mother and my grandmother, Haydée Lagos and Teresa Jaramillo..
(6)
(7) Aknowledgements. I have been indebted in the preparation of this thesis to my Director, Dr Daniel Sol Rueda, whose patience and kindness, as well as his professional experience, has been invaluable to me. Thanks to all members of the research group, for the extensive discussions and help through this process. I also whish to tanks to the members of CREAF, I had a great time in here.. The informal support and encouragement of my friends, family and partner has been also indispensable and this thesis would certainly not have existed without them.. I would like to express my warmest thanks to everyone.. The research reported in this thesis was funded by a pre-doctoral scholarship from the Agency for Management of University and Research Grants (FI-DGR 2009, AGAUR), from the Department of Economy and Knowledge of the Government of Catalonia and the European Social Fund..
(8)
(9) CONTENTS ABSTRACT. 11. GENERAL INTRODUCTION. 13. CHAPTER 1. Big-brained Mammals Live Longer. 19. CHAPTER 2. Food unpredictability, Motivation and Corticosterone levels. 43. influence the propensity to innovate. CHAPTER 3. Behavioural flexibility for a life in the city. 65. CHAPTER 4. Winners and losers in an increasingly urbanized planet. 105. GENERAL CONCLUSIONS. 121. SUPPLEMENTARY MATERIAL. 123.
(10)
(11) ABSTRACT Across the history of life, most of organisms have evolved proper strategies to respond to an ever-changing world. Nowadays, human-conducted environmental changes impose an unprecedented lost of biodiversity. This thesis assesses one of the key responses to actual environmental changes, behavior flexibility. In a first approximation by a phylogenetic comparative approach I give evidences for the still tenuous link between cognition and life history by report the clearest support for the relationship between lifespan and brain size in mammals. Lifespan is core to many hypotheses regarding the advantages of enlarged brains, like the cognitive buffer hypothesis to proper respond to novel environments. In a second level, I explore for the drivers of innovation propensity, a key component of behavior flexibility. By mean of an experimental approach, I test for possible scenarios that may select for consistent individual differences in motivation, a major driver of innovation. Consistent individual differences in motivation are reported, but heritability and endocrine control features suggest that mechanism may be different of those hypothesized. Later, to approach for the role of behavioral flexibility in changing environments, I assess the behavior responses to one of the most disruptive effects of human activities on ecosystem, the urbanization. First, based on a literature review, theoretical and empirical evidences are reported for argue that behavioural flexibility is an important way to deal with urban environments. Second, using global comparative analyses in bird communities across the world, I show the importance of local process by random dispersal effects alongside habitat filtering to explain lose of biodiversity in urbanized environments. Some phylogenetic lineages appear more likely than others to thrive in urban environments, which is related to a future-returns strategy (i.e. low brood value) that allow for decrease the cost of delay reproduction and increase the opportunities to acquiring environmental information. The integrations of these results shows how the evolutionary past has shaped the traits that contribute to deal with actual environmental challenges, and highlight the expected consequences in a rapid changing, human-dominated world.. 11.
(12) RESUMEN A través de la historia de la vida, gran parte de los organismos han desarrollado estrategias para responder a un mundo en constante cambio. Hoy en día, las actividades humanas producen cambios ambientales a una velocidad sin precedentes, lo cual se traduce en grandes desafíos para la persistencia de biodiversidad. Esta tesis evalúa las respuesta de los animales a los cambios ambientales enfocándose en la flexibilidad del comportamiento como estrategia adaptativa. En una primera aproximación a una escala evolutiva, se otorgan evidencias del vínculo hasta ahora tenue entre la cognición e historias de vida, entregando un claro apoyo a la relación entre longevidad, vida reproductiva y el tamaño del cerebro en mamíferos. La longevidad es el centro de muchas hipótesis respecto a las ventajas de desarrollar un cerebro grande, como por ejemplo en la hipótesis del buffer cognitivo y las respuestas flexibles frente a nuevos ambientes. En un segundo nivel, se abordan factores extrínsecos e intrínsecos que podrían explicar las diferencias individuales en innovación, un componente clave en la flexibilidad del comportamiento. Por medio de una aproximación experimental, se evalúan potenciales escenarios que podrían conducir a consistentes diferencias individuales en uno de los principales factores subyacentes a la innovación (i.e. la motivación), y el potencial control endocrino sobre estos escenarios. Posteriormente, con el objetivo de evaluar el papel de la flexibilidad del comportamiento frente a los cambios ambientales actuales, se explora el rol del comportamiento frente a una de las actividades humanas mas disruptivas sobre los ecosistemas, la urbanización. Por medio de una revisión bibliográfica se entregan evidencias teóricas y empíricas que respaldan el importante rol de la flexibilidad del comportamiento para enfrentar los desafíos de una vida urbana. Finalmente, por medio de un análisis filogenético comparativo a nivel global en aves se abordan los mecanismos implicados en la perdida de biodiversidad observada en ambientes urbanos. Los resultados entregan evidencias que respaldan la importancia de procesos de dispersión local junto con el papel clave de los rasgos de historia de vida, pero de en un sentido diferente al clásicamente pensado. La integración de estos resultados muestra cómo el pasado evolutivo contribuye a hacer frente a los retos ambientales actuales, y pone de relieve posibles consecuencias ante un planeta más cambiante que nunca.. 12.
(13) GENERAL INTRODUCTION. Through the known history of life, environmental disruptions have impacted and changed the natural environments, however in the last five decades human activities has been changing the world at unprecedented pace (Millennium Ecosystem Assessment 2005). The growing scale of human enterprises is the main responsible for the accelerated actual environmental changes, contributing to climate alterations, loss of biological diversity, eroding ecosystems around the globe (Ehrlich 1995, Vitousek 1997). Despite these fast human-conducted environmental disruptions, some organisms are doing better than ever. Uncovering the responses of species to environmental changes is challenge but a better understanding of how evolutionary history has shape behavioural responses and how these responses work in front of actual human-conducted environmental change may help us to mitigate the loss of biodiversity and manage organism that become pests with the global expansion of human population (Sih et al. 2010, 2011).. BEHAVIOUR FLEXIBILITY In front of environmental changes the ability of an animal to adaptively modify their behaviour would provide an important adaptive potential (Lefebvre et al. 2004). Behavior flexibility facilitates the production of adaptive responses to a wide array of ecological challenges. For example, assist birds and mammals in the invasion of new environments (Sol et al. 2005, 2008) and predict bird population tendencies (Shultz et al. 2005). For one way, most of the variation among species in this traits is explained by cognitive abilities, as suggested by findings that brain size predict learning and propensity to innovate (Lefebvre et al. 1997, Reader and Laland 2002, Overington et al. 2009). On the other way, more simple cognitive process and temperament are related to innovation and learning variation within species (i.e. Cole et al. 2011, Sol et al. 2012), drivers factors that just in the last years has started to be studied. All above features and others still for unravelling contribute to the large variation that exist in behavioural flexibility among individuals, populations and species (Lefebvre et al. 2004, Lefebvre and Sol 2008).. 13.
(14) EVOLUTIONARY PAST Most of the responses to human-conducted environmental changes are mediated by phenotypic plasticity rather than immediate genetic changes (Hendry et al. 2008). This suggest that evolutionary history has been important in shape traits that nowadays are effective for coping with changing environments, like behaviour flexibility and associated brain size (Sih et al. 2011). One of the hypotheses for the evolution of big brains involves the cognitive buffer hypothesis. That hypothesis take into account the balance between costs in time and energy to evolve big brains and the benefits provided in the form of longer reproductive life, compensating the enormous cost of evolve big brains. Although evidence exist for the basic tenets of cognitive buffer hypothesis, as big brained birds survival longer (Sol et al. 2007), the link remain elusive in mammals and preclude us to generalize patterns. The knowledge of shared evolutionary history would provide a way to predict whom species might perform well in the actual changing environmental conditions.. INDIVIDUAL RESPONSES Because important consequences on population dynamics and species evolution, the study of individual differences have acquired pivotal relevance in the last decade (Sih et al. 2012, Wolf and Weissing 2012). Behavioural flexibility in particular varies among individuals as consequences of underlying factors like temperament traits and other individual’s features that remain to be elucidated. Species confronting humaninduced environmental changes are under new selective. pressures, thus. understanding individual responses to actual environmental challenges may provide a way to understand evolutionary past and predict futures responses on which individuals or species would be in disadvantage and what will de potential pest (Sih et al. 2011).. RAPID HUMAN-INDUCED ENVIRONMENTAL CHANGES Habitat loss and fragmentation are the main types of human-induced environmental changes. Because the accelerate rate of human population growth coupled with the expansion of land for urbanization, understand the mechanisms involved in the organism responses to this environmental change put enormous scientific challenges. Cities may allow an unique opportunity for comparative studies 14.
(15) addressing the behaviour responses of animals as provide large scale examples (Anderies et al. 2007, Grimm et al. 2008). It is often assumed that urban species have adaptations to survive in such environments, yet the role of alternative processes has generally been under-appreciated. How species and individuals confront the challenges to live in these environments and the mechanisms involved, are questions that remain to be elucidate.. MAIN GOALS This thesis has four main goals (1) In light of the pivotal role of behavioral flexibility to generate adaptive responses to rapid environmental changes but yet poorly support for basic tenets of the cognitive buffer hypothesis, I search to provide support for and generalize the evolutionary advantages of evolve big brains. (2) Behavior flexibility varies at individual level, but the drivers that promote individual variation in behavior flexibility are poorly knowed. I look for one of the most important promoters of innovation reported to date, motivation. I ask whether this factor promotes individual differences in innovation and if so, what are the contexts that promote their selection at individual level. (3) In a heuristic way to assess for evidences of the role of behavior flexibility to actual environmental changes, I ask whether and how behavioral flexibility provides appropriate skills to organism that live in urbanized environments, one of the most disruptive actual environmental changes. (4) Finally, in a more detailed study about the possible processes that allow or preclude the life in urbanized environment, I ask how the often reported patterns of biodiversity are shaped in urban environments. Taking birds as study models two hypothesized mechanism, the dispersal and environmental filter hypotheses are approached.. 15.
(16) General References Anderies, J.M., Katti, M. & Shochat, E. 2007. Living in the city: resource availability, predation, and bird population dynamics in urban areas. Journal of theoretical biology 247: 36–49. Cole, E.F., Cram, D.L. & Quinn, J.L. 2011. Individual variation in spontaneous problem-solving performance among wild great tits. Animal Behaviour 81: 491– 498. Ehrlich, P.R. 1995. The scale of the human enterprise and biodiversity loss. In: Extinctions Rates (J. H. Lawton and R. M. May, ed), pp. 214–226. Oxford University Press, Oxford, UK. Grimm, N.B., Faeth, S.H., Golubiewski, N.E., Redman, C.L., Wu, J., Bai, X., et al. 2008. Global change and the ecology of cities. Science (New York, N.Y.) 319: 756–60. Hendry, A.P., Farrugia, T.J. & Kinnison, M.T. 2008. Human influences on rates of phenotypic change in wild animal populations. Molecular Ecology 17: 20–29. Blackwell Publishing Ltd. Lefebvre, L., Reader, Simon M & Sol, D. 2004. Brains, innovations and evolution in birds and primates. Brain Behavior & Evolution 63: 233–246. Lefebvre, L. & Sol, D. 2008. Brains, Lifestyles and Cognition: Are There General Trends? Brain, Behavior and Evolution 72: 135–144. Lefebvre, L., Whittle, P., Lascaris, E. & Finkelstein, A. 1997. Feeding innovations and forebrain size in birds. Animal Behaviour 53: 549–560. Elsevier. Millennium Ecosystem Assessment. 2005. Ecosystems and Human Well-being: Biodiversity Synthesis. Washington, DC. Overington, S.E., Morand-Ferron, J., Boogert, N.J. & Lefebvre, L. 2009. Technical innovations drive the relationship between innovativeness and residual brain size in birds. Animal Behaviour 78: 1001–1010. Elsevier Ltd. Reader, S M & Laland, K.N. 2002. Social intelligence, innovation, and enhanced brain size in primates. Proceedings of the National Academy of Science, USA 99: 4436–4441. Sih, A., Cote, J., Evans, M., Fogarty, S. & Pruitt, J. 2012. Ecological implications of behavioural syndromes. Ecology Letters 15: 278–289. Blackwell Publishing Ltd.. 16.
(17) Sih, A., Ferrari, M.C.O. & Harris, D.J. 2011. Evolution and behavioural responses to human-induced rapid environmental change. Evolutionary Applications 4: 367– 387. Sih, A., Stamps, J., Yang, L.H., McElreath, R. & Ramenofsky, M. 2010. Behavior as a Key Component of Integrative Biology in a Human-altered World . Integrative and Comparative Biology 50 : 934–944. Sol, D., Bacher, S., Reader, Simon M & Lefebvre, L. 2008. Brain size predicts the success of mammal species introduced into novel environments. The American naturalist 172 Suppl : S63–71. Sol, D., Duncan, R.P., Blackburn, T.M., Cassey, P. & Lefebvre, L. 2005. Big brains, enhanced cognition, and response of birds to novel environments . Proceedings of the National Academy of Sciences of the United States of America 102 : 5460–5465. Sol, D., Griffin, A.S. & Bartomeus, I. 2012. Consumer and motor innovation in the common myna: the role of motivation and emotional responses. Animal Behaviour 83: 179–188. Elsevier Ltd. Sol, D., Székely, T., Liker, A. & Lefebvre, L. 2007. Big-brained birds survive better in nature. Proceedings of the Royal Society B: Biological Sciences 274: 763–769. Vitousek, P.M. 1997. Human Domination of Earth’s Ecosystems. Science 277: 494–499. Wolf, M. & Weissing, F.J. 2012. Animal personalities: consequences for ecology and evolution. Trends in Ecology & Evolution -.. 17.
(18) 18.
(19) Chapter 1# Large-brained mammals live longer. Published as: Gonzalez-Lagos, C., Sol, D. and Reader, S. M. (2010). Large-brained mammals live longer. Journal of Evolutionary Biology, 23:1064-1074.. 19.
(20) ABSTRACT Many mammals have brains substantially larger than expected for their body size, but the reasons for this remain ambiguous. Enlarged brains are metabolically expensive and require elongated developmental periods, and so natural selection should have favoured their evolution only if they provide counterbalancing advantages. One possible advantage is facilitating the construction of behavioural responses to unusual, novel or complex socioecological challenges. This buffer effect should increase survival rates and favour a longer reproductive life, thereby compensating for the costs of delayed reproduction. Here, using a global database of 493 species, we provide evidence showing that mammals with enlarged brains (relative to their body size) live longer and have a longer reproductive lifespan. Our analysis supports and extends previous findings, accounting for the possible confounding effects of other life history traits, ecological and dietary factors, and phylogenetic autocorrelation. Thus, these findings provide support for the hypothesis that mammals counterbalance the costs of affording large brains with a longer reproductive life.. 20.
(21) INTRODUCTION Large brains have evolved multiple times and in multiple taxa (Jerison 1973). This is puzzling because a brain disproportionately large for a given body size is metabolically expensive (Isler & van Schaik, 2006, 2009a, b; Aiello & Wheeler, 1995) and takes a substantial time to reach structural and functional maturity (Casey et al., 2005). Long developmental periods result in significant fitness costs for large-brained species, both in terms of increased offspring mortality risk (Sacher & Staffeldt, 1974; Stearns, 2000; Deaner et al., 2003; Barrickman et al., 2008) and delayed age of first reproduction (Deaner et al., 2003; Barrickman et al., 2008). Consequently, natural selection should have favoured the evolution of large brains only if they provide advantages that counterbalance their production and maintenance costs.. Several hypotheses have been proposed to explain the adaptive advantages of larger brains (see Deaner et al., 2003; van Schaik & Deaner, 2003; Dunbar & Shultz, 2007a; Sol, 2009a), most of which assume that enlarged brains carry cognitive advantages. Among others, these include monitoring food sources that vary in space and time (Clutton-Brock & Harvey, 1980; Milton, 1988), using hard-to-eat foods (Parker & Gibson, 1977, 1979), exploiting novel foraging opportunities (Lefebvre et al., 1997), and modifying behaviour in response to conspecifics (Jolly, 1966; Humphrey, 1976; Cheney & Seyfarth, 1986; Byrne & Whiten, 1988; Whiten, 2000; Dunbar & Shultz, 2007b). The above hypotheses focus on selective advantages of enlarged brains, but do not provide an explicit explanation for how these benefits balance the developmental costs of affording large brains. However, if these benefits reflect general cognitive capacities for constructing behavioural responses to novel socio-ecological challenges, then this should reduce extrinsic mortality and partially compensate the developmental costs with a longer reproductive life (Allman et al., 1993; Allman, 2000; Deaner et al., 2003; Sol, 2007, 2009a,b). This interpretation, the so-called “cognitive buffer hypothesis”, thus integrates previous hypotheses, acknowledges that brains carry out multiple functions, and provides an explicit explanation of the benefits of brain enlargement (Allman et al., 1993; Allman, 2000; Deaner et al., 2003; Sol, 2009a).. Recently, comparative work on brain evolution has been criticised because diverse findings regarding correlates of brain enlargement have not been integrated (Healy & 21.
(22) Rowe, 2007). The lack of consideration of alternative hypotheses for the evolution of enlarged brains is a repeated criticism (Deaner et al., 2000; Reader & Laland, 2002; Dunbar & Shultz, 2007b). The diversity of reported correlates of brain enlargement likely reflects the fact that the brain performs multiple functions: postulating a single cognitive benefit for brain enlargement is unlikely to be successful. There is considerable evidence that species with enlarged brains for their body size show enhanced cognitive capacities, although the mechanisms behind these relationships are obscure and warrant study (reviewed in Healy & Rowe, 2007; Lefebvre & Sol, 2008). For example, multiple studies have demonstrated associations between brain size and components of behavioural flexibility, such as innovation, tool use, tactical deception, social learning, reversal-learning, and combined measures of laboratory learning performance, in both birds and primates (Lefebvre et al., 1997; 2004; Reader & Laland, 2002; 2003; Reader, 2003; van Schaik & Deaner, 2003; Byrne & Bates, 2007; Deaner et al., 2007). Evidence is also accumulating that flexibility in behaviour facilitates the production of adaptive responses to a wide array of ecological challenges (reviewed in Sol, 2009a). In birds and mammals, for example, large-brained species are more likely to be successful when introduced by humans in novel environments than are small-brained species (Sol et al. 2005, 2008). Moreover, amongst British birds, species with relatively large brains were less likely to suffer population declines (Shultz et al., 2005). Thus several lines of evidence support the idea that brain volume is associated with diverse measures of behavioural flexibility and with success in novel or changed environments, providing a route to integrate previous findings.. Surprisingly, however, evidence for a critical prediction of the cognitive-buffer hypothesis, that brain enlargement translates to increased life expectancy, remains mixed. In mammals, the animals with the largest relative brain sizes, some studies have demonstrated a significant relationship between brain size and lifespan (e.g. Deaner et al., 2003; Kaplan et al., 2003; Hakeem et al., 1996, Isler & van Schaik 2009a,b), but others did not (e.g. Ross & Jones, 1999; Barton, 1999; Judge & Carey, 2000). The disparity of results may arise from differences in the way that previous studies controlled or failed to control for confounding factors and phylogenetic effects. Moreover, previous analyses were generally based on a reduced number of species and were biased toward primates (reviewed in Barrickman et al., 2008). This 22.
(23) focus potentially reduces the interspecific variation observed in brain size and lifespan, which could reduce the possibility of detecting patterns. Understanding the evolution of large brains is only possible if we further validate the brain-lifespan association in many taxa and with approaches that properly deal with phylogenetic and confounding factors (Lefebvre et al., 2004; Sol, 2009a). Here, we ask whether large-brained mammals live longer with a global phylogenetic-based comparative analysis covering 493 mammalian species. We extend on recent similar analyses (Isler & van Schaik 2009a,b) by taking into account previously unconsidered confounding variables, using datasets covering additional taxa (e.g. marsupials), and directly estimating and accounting for phylogenetic effects (Hansen & Orzack, 2005). We show that the association of larger brains with longer lifespan holds independently of other life history traits, of research effort, and of energetic, environmental, dietary, and habitat variables, thus providing unambiguous support for the idea that the costs of delaying reproduction in large-brained species can be partly compensated by a longer reproductive life.. MATERIAL AND METHODS Lifespan As an estimate of reproductive lifespan, we gathered information on maximumrecorded lifespan (in years) for 493 species of mammals from de Magalhaes et al. (2009; see references therein). The bulk of these data come from Weigl (2005). There exist alternative, more accurate estimates of reproductive lifespan (Ricklefs & Scheuerlein, 2001), but maximum-recorded lifespan provides a reasonable estimate that is available for many species (Barrickman et al. 2008, Isler and van Schaik 2009a). Barrickman et al. (2008) proposed that the age at first reproduction must be first subtracted from maximum lifespan to provide a measure of the duration of reproductive life (hereafter, ‘reproductive lifespan’), and thus to test the idea that enlarged brains are associated with longer periods of reproductive life. We thus used two lifespan measures as dependent variables: ‘lifespan’ and ‘reproductive lifespan’.. The available maximum lifespan data have some potential problems. First, they are derived from both captive and wild records. Since lifespan recorded under captive conditions may not represent that in the wild, pooling these captive and wild data could potentially obscure any true relationships (Barrickman et al., 2008). To account 23.
(24) for this issue, we included whether lifespan was measured in captivity or the wild as a factor in the statistical model. Second, maximum lifespan estimates increase with research effort (Møller, 2006, 2007; de Magalhaes & Costa, 2009). To account for this possible bias, we estimated research effort from the number of articles listed in ISI Web of Science in July 2009 for each species. Research effort was log transformed and included as co-variate in statistical models.. Brain size The use of whole-brain versus brain-part volumes is an important issue in testing the cognitive buffer hypothesis (Deaner et al., 2007). While a focus on one brain component may be advantageous in studying a specialized cognitive function (Healy & Rowe, 2007), the use of whole brain size is likely to be more appropriate in testing the cognitive buffer hypothesis (Barton & Harvey, 2000; Sol et al., 2008; Sol & Price, 2008). First, behavioural flexibility has multiple underlying mechanisms and arises from several processes such as perception, motor ability and cognitive processing (Deaner et al., 2003; Changizi, 2003), unlikely to be localized in a single brain area (Lewis, 2006). Second, several brain component volumes are consistently correlated with whole brain size, particularly larger parts that are involved in higher order and multimodal integration (Timmermans et al., 2001; Iwaniuk et al., 2004). Finally, as already noted, a growing number of studies have found support for an association between brain size and different measures of behavioural flexibility, such as innovation, tool use, tactical deception, and learning (reviewed in Lefebvre et al., 2004; Dunbar & Shultz, 2007a; Deaner et al., 2007; Lefebvre & Sol, 2008). Thus we used data on whole brain size, which has the additional advantage that it is available for many more species than are brain component volumes. Data on brain mass for 493 species were compiled from published information from multiple sources (see Appendix I). We subtracted 0.59 g from each rodent species datum in Mace et al. (1981), following the corrective procedure recommended by Isler & van Schaik (2006). Brain masses were either calculated from endocranial volumes or were whole brain masses. Although the use of endocranial volumes to calculate brain masses has been debated (Röhrs and Ebinger, 2001), we utilised these data because recent studies have demonstrated that it provides a reliable proxy of brain mass (Isler et al. 2008; Ashwell 2008; Finarelli and Flynn, 2009). The reliability of the brain measures utilised was previously evaluated by Sol et al. (2008) using a variance component 24.
(25) analysis, which showed that variation across species was higher than within species. This validated the treatment of brain mass as a species character.. Larger species have larger brains, so it is necessary to estimate brain mass controlling for the allometric effect of body size. At least three methods have been proposed to do this: (1) to estimate the residuals of a log-log least-squares linear regression of brain mass against body mass; (2) to calculate the fraction of the body mass that corresponds to brain mass; and (3) to include absolute brain mass and body mass as covariates in a multivariate model (Deaner et al. 2000). We used all methods and the results are consistent. We present in the text the results obtained with the residual method, as this approach has the advantage of eliminating problems of collinearity while effectively removing body size effects (Sol et al., 2007). Body mass was obtained from the same sources as brain mass when available and complemented with published data as needed (Smith & Jungers, 1997). Following Sol et al. (2008), when more than one source per species was available, the mean values of brain mass and body mass (in grams) were utilized, and when only a range of values was available, the midpoint was used. To reduce measurement error, for each species the coefficient of variation was calculated for both brain and body mass. We removed extreme values where the coefficient of variation was extremely high (> 50%), apart from highly sexually dimorphic species (Weckerly, 1998), as these high variances were likely the consequence of a measuring error. We removed extreme data values for 11 species. Before estimating residuals of brain mass, it is necessary to control for the ‘grade shift’ phenomenon (Pagel & Harvey, 1988; Nunn & Barton, 2000; Sol et al., 2008). Grade shifts represent the fact that in mammals the intercept of the regression line between brain mass and body mass differs across taxonomic groups, leading to biases in residuals if left unaccounted for. To deal with this problem, Nunn and Barton (2000) proposed the estimation of the slope (b) of the regression with phylogenetic independent contrasts (Felsenstein, 1985). Since only a few independent contrasts will be affected by grade shifts, the effect of grade shifts on the global relationship between contrasts should be weak (Nunn & Barton, 2000; Sol et al., 2008). Following Blomberg et al. (2003), we computed the size-corrected values for brain mass in three steps. First, independent contrasts were estimated for brain mass and body mass (both log-transformed) with the PDAP module of the MESQUITE program (Garland et al., 1999; Garland & Ives, 2000). The phylogenetic 25.
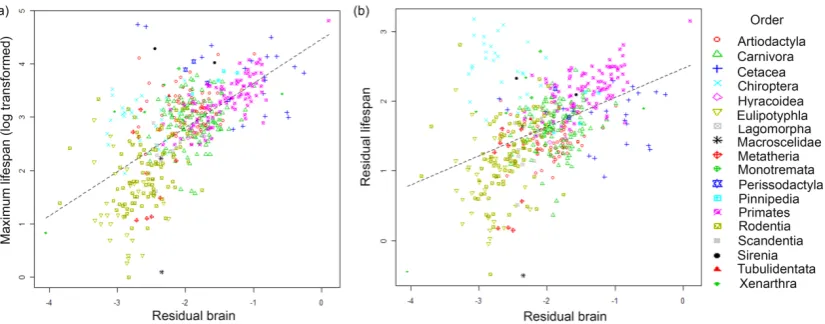
(26) tree was that proposed by Bininda-Emonds et al. (2007; corrigendum, 2008), which includes a great number of extant mammals. Second, a least squared linear regression through the origin of these contrasts (brain mass on body mass) was computed to estimate the allometric exponent (b). The relationship between contrast of brain mass and body mass was strong (R²=0.90), therefore the use of alternative line-fitting techniques was not necessary (Barton & Harvey, 2000). Third, sizecorrected values of brain mass were computed as log [brain mass/body massb] using raw values (not independent contrasts). Hereafter, this variable will be called “residual brain mass”. The slope (b) was estimated as 0.64, close to that estimated by other studies (Harvey & Krebs, 1990; Sol et al., 2008). Because the residual brain values obtained do not completely remove the effect of body mass (correlation coefficient = 0.51), log body mass was included in all the models testing the relation between residual brain mass and lifespan.. Confounding Variables Since the analyses are correlational, any relation between lifespan and brain mass could be obscured or inflated by the effect of other variables. We thus accounted for several factors that potentially can affect lifespan variation. First, metabolism could be an important determinant of lifespan (Harvey et al., 1991; Hofman, 1993; Allman et al., 1993; Ricklefs & Wikelski, 2002; Speakman, 2005). To control its possible effect, data for basal metabolic rate (BMR) were obtained from White et al. (2009) and included in the statistical model.. Second, life history traits are known to co-vary systematically across species (Harvey & Clutton-Brock, 1985; Promislow & Harvey, 1990; Stearns, 2000; Bielby et al., 2007). It is thus important to ensure that the apparent association between brain mass and lifespan is not spuriously created by the effect of another life history trait. Information on gestation, weaning, age at first reproduction, litter size and litters per year were taken from published literature (Ernest, 2003; de Magalhaes et al., 2009; Bielby et al., 2007). These life history traits are highly correlated with lifespan (e.g. Harvey & Clutton-Brook, 1985) as well with each other (van Schaik & Deaner, 2003; Bielby et al., 2007). Third, life history strategies vary across regions (Ricklefs, 2000; Forsyth et al., 2004; Martin et al., 2006; McNamara et al., 2008). For example, latitude has been reported to predict lifespan in birds (Møller, 2006; 2007). To 26.
(27) account for geographic biases, maximum northern latitude (MNL) and maximum southern latitude (MSL) were gathered from breeding ranges published in the literature (Dorst & Dandelot, 1973; Strahan, 1995; Schilling et al., 1987; MitchellJones et al., 1999; Kingdon, 1997; Folkens et al., 2002; Long, 2003; Patterson et al., 2003; Jackson, 2007; IUCN, 2008). We calculated three proxy variables for geographic factors from these breeding ranges: “geographic range” (the total latitude degree of breeding range), “mid-latitude point of breeding range” (calculated as (MNL+MSL)/2, following Newton, 1995), “discontinuous distribution” (coded as ‘discontinuous’ or ‘continuous’, accounting for discontinuous or continuous occupancy along the latitudinal breeding distribution). Fourth, species diet and habitat thought to be linked to lifespan (Harvey & Clutton-Brock, 1985; Bennett & Harvey, 1985; Allman et al., 1993; van Schaik & Deaner, 2003). Thus, these variables were considered in the analyses and coded as follows: primary dietary type (herbivorous, carnivorous, omnivorous and insectivorous), feeding generalism (number of these diet categories, range 1-4), primary habitat type (coastal habitat, inland waters, wetland, desert, forest, mountain, tropical rainforest, savanna, grassland, woodland, scrub-tundra, rural and urban areas) and habitat breadth (number of these habitat types used, range 1-13). Data were compiled from multiple sources (Long, 2003; Wilson & Reader, 2005; Jakson, 2007; Kingdon, 1997; Patterson et al. 2003; IUCN, 2008).. Finally, both lifespan and reproductive lifespan scale allometrically with body size (Harvey & Clutton-Brock, 1985; Blumstein & Møller, 2008; this study) so it is relevant to examine whether brain mass correlates with lifespan when the body size effect is controlled for. To account for body size effects on lifespan, we estimated the residuals of a log-log regression of lifespan (or reproductive lifespan) against body size (termed ‘residual lifespan’ or ‘residual reproductive lifespan’, respectively). Because body mass has a high phenotypic variability (Economos, 1980; Smith & Junger, 1997), the average body mass calculated can be an under- or over-estimate of the true value. This is problematic, as it causes the residuals of the response and predictor variables to be biased in the same direction, increasing the chance of type I errors (Harvey & Krebs, 1990; Barton, 1999). To avoid this problem, we separately obtained residuals of dependent and independent variables by using a different set of body masses (Harvey & Krebs, 1990; Barton, 1999; Deaner et al., 2003; Barrickman 27.
(28) et al., 2008). This second set of body masses was obtained from Ernest (2003), complemented by other sources (Jackson, 2007; de Magalhaes et al., 2009).. Analyses Closely-related taxa share many traits from common ancestors rather than from independent evolution, thus species’ traits cannot generally be treated as statistically independent points (Felsenstein, 1985). To deal with this problem, we modelled lifespan values for species with a phylogenetic generalized least squares approach (PGLM) (Freckleton et al., 2002; Phillimore et al., 2006; Shultz & Dunbar, 2007). This method takes the phylogenetic variance/covariance matrix derived directly from the phylogenetic supertree of the species, and hence evaluates the association between variables taking into account the correlated error structure. This is done by estimating a parameter lambda (λ), which measures the degree to which the matrix follows a Brownian model (λ values near 0 implying no phylogenetic autocorrelation and values near 1 maximum phylogenetic autocorrelation). The fitted generalized least squares model (GLM) and λ were simultaneously estimated to test the effect of brain mass on maximum lifespan across species. We included interactions between predictor variables in the analyses, but none were statistically significant and thus are not reported below. PGLM analyses were conducted with R 2.7.0, (R Development Core Team, 2005), the R code kindly provided by R. P. Freckleton, and the phylogenetic hypothesis proposed by Bininda-Emonds et al. (2007, corrigendum 2008).. Following Sol et al. (2008), a minimum adequate model (MAM) was constructed by means of a backward selection approach. The initial PGLM model was composed by residual brain mass and the rest of confounding variables. Then, we sequentially dropped the variables resulting in the lowest improvement to model fit. We investigated the significance of alternative models by adding the previous variable removed from the model. Variables with P < 0.2 were retained in the MAM, to avoid the removal of confounding variables of weak influence. However, the standard criterion for statistical significance (P < 0.05) was applied throughout. Diagnostic plots were examined in order to check for outliers, heteroscedasticity, and nonnormal errors.. 28.
(29) RESULTS We found extensive variation both in brain mass and maximum lifespan across species (Fig. 1). To test whether the lifespan of mammalian species can be explained to some degree by residual brain mass, we first used a conventional linear model (LR: linear regression) so that our results could be compared with previous studies. This model revealed a very strong relationship between residual brain mass and lifespan (coefficient ± S.E., b = 0.49 ± 0.04, t486=10.98, P < 0.0001, Fig 2a), even when the effect of body mass on lifespan was removed (residual brain mass versus residual lifespan: b = 0.48 ± 0.04, t486= 10.86, P < 0.0001, Fig. 2b).. Figure 1. Box plots (median and 25 and 75% percentiles) of residual brain mass (accounting for body mass) and residual maximum lifespan (accounting for body mass) across mammalian orders, with phylogenetic relationships between taxa indicated on the left (phylogeny: Bininda-Emonds et al., 2008).. 29.
(30) Figure 2. Relationship between residual brain size and maximum lifespan in 493 species of mammals (a) without (linear regression: F4,486= 176.9, R2= 0.59, P < 0.0001) and (b) with control for the allometric effect of body size on lifespan (linear regression: F4,486 = 36.67, R2= 0.22, P < 0.0001), Equivalent results were obtained using PGLM analysis: a: F5,491=57.17, R2= 0.31, P < 0.0001; b:F5,491= 19.34, R2= 0.13, P < 0.0001). The LR analyses above did not include phylogenetic corrections, but it is well known that disregarding phylogenetic effects can cause misleading results when the studied traits show high phylogenetic autocorrelation. Indeed, lifespan showed significant phylogenetic autocorrelation, with a lambda estimate close to 1 (λ = 0.97; X2 = 437.10, P < 0.0001 that λ is 0; X2 = 10.89, P = 0.0009 that λ is 1). We thus used a PGLM approach. The relationship between residual brain mass and lifespan was positive and highly significant (partial regression coefficient ± S.E., b = 0.26 ± 0.04, t486= 5.37, P < 0.0001). When the allometric effect of body mass on lifespan was incorporated in the analysis, the residuals of brain mass remained strongly associated with residuals of lifespan (PGLM: b = 0.20 ± 0.04, t486=4.26, P < 0.0001). Due to the correlative nature of the analyses, the relationship between residual brain mass and lifespan could be spuriously caused by their common association with a third variable. None of the ecological (i.e., basal metabolic rate, primary habitat, primary diet, feeding generalism or habitat breadth) and geographic variables (i.e. geographic range, mid latitude point or discontinuous distribution) evaluated were found to be significantly associated with lifespan in the MAM (PGLM: P > 0.05 in all variables), and did not alter the relationship between brain mass and lifespan. From the life history traits we considered, only the age at first reproduction was significantly associated with lifespan (PGLM: P < 0.001, N=417; all other variables P > 0.2). 30.
(31) However, residual brain mass remained significantly associated with lifespan when age at first reproduction was taken into account (Table 1). The MAM included age at first reproduction along with residual brain mass, lifespan measure (wild or captive), research effort (log transformed) and body mass (log transformed). Recorded lifespan was longer in captive animals, in better-studied species, in heavier species, and in species with an older age at first reproduction (Table 1). The models explained 42% of variance in lifespan and 21% of variance in residuals of lifespan. Equivalent results were obtained with reproductive lifespan as the dependent variable (Table 1).. Table 1. Minimum adequate PGLS model of lifespan for 384 mammalian species (adjusted r2 = 0.42, for lifespan, 0.21, for residual lifespan, 0.35 for reproductive lifespan and 0.16 for residual reproductive lifespan.. * The parameters (b) are the partial regression coefficients relating the predictors (residual brain size, age at first reproduction, research effort, origin of lifespan data (captive/wild) and body mass) with lifespan. Four lifespan measures are used as dependent variables: maximum lifespan, residual maximum lifespan (controlling for the allometric effects of body size), maximum reproductive lifespan (maximum lifespan-age at first reproductive) and residual reproductive lifespan. Analysis was via the phylogenetic generalized least squares method. Three confounding variables were kept in the model (criterion: P<0.2) but were not statistically significant (0.12 > P > 0.07): discontinuous distribution (b=0.04 for all four dependent variables), desert habitat (b=0.06-0.07), herbivorous diet (b=0.07-0.08).. DISCUSSION Species of mammals with larger brains than expected for their body size tended to live longer than those with smaller brains. Although residual brain size explained only a small fraction of the variance in residual lifespan across species (about 13%, Fig. 2b), this relationship was robust and largely independent of ecological, geographic and phylogenetic effects. Thus, our results provide robust evidence that in large31.
(32) brained animals the costs of delaying reproduction are in part compensated with a longer reproductive life. Lifespan is difficult to quantify, and thus estimates are subject to error, which might detract from our ability to resolve the strength of an association between brain size and lifespan. Although some of the highest values of maximum lifespan are reported in captive animals (de Magalhaes & Costa, 2009), the mixture of wild and captivity lifespan records was unlikely to affect the correlation between lifespan and brain size (Table 1; see also Allman et al., 1993; Barrickman et al., 2008). Captive conditions could be argued to not replicate the pressures faced in natural environment, but maximum lifespan may be seen as representing a physiological limit to life duration (Barrickman et al., 2008; de Magalhaes & Costa, 2009). In the same way, research effort may bias lifespan estimates (Møller, 2006; 2007; de Magalhaes & Costa, 2009), as our results show. However, the brainlifespan association remained significant when research effort and data source was accounted for in the analyses. Many previous studies have examined the brain sizelifespan relationship (Shacher, 1959; Shacher & Staffeldt, 1974; Economos, 1980; Hofman, 1993; Allman et al., 1993; Ricklefs & Scheuerlein, 2001; Kaplan et al., 2003; Barton, 1999; Hakeem et al., 1996; Deaner et al., 2003; Barrickman et al., 2008; Isler & van Schaik 2009a, b). Our findings extend on these studies, expanding the taxonomic range studied. Moreover, several of these previous studies did not take into account the phylogenetic relationships among species and, if they did, did not estimate the level of phylogenetic autocorrelation (Hansen & Orzack, 2005). In contrast, we performed the analysis on 493 mammalian species, and the degree of shared evolutionary history was directly included into the analysis, which ensured a better estimation of the model parameters. This proved to be essential as phylogeny accounted for a substantial part of the link between lifespan and brain size (λ=0.91). Thus, the high correlations between lifespan and brain size that have been previously reported (e.g. for primates: r = 0.65, Allman et al., 1993; and for mammals: r = 0.83, Hofman, 1993) could in part be explained by shared evolutionary history among related species.. van Schaik & Deaner (2003) argued that the inclusion of some orders (e.g. Chiroptera, Monotremes, Edentates) may hide the relationship between lifespan and brain size in mammals. These taxa show lower metabolic rates, which tend to be associated with increased longevity despite their small brain size (Allman et al., 1993; 32.
(33) Hofman, 1993). In the present work, although these taxa were included, neither inclusion of these taxonomic groups nor metabolic rate in the analysis accounted for the lifespan-brain size correlation we document. Likewise, Harvey et al. (1991) did not find evidence for the association between basal metabolic rate and life histories. It is possible that BMR is not the most appropriate metabolic measure (Speakman, 2005). We found that although BMR and lifespan correlated, the relationship was not statistically significant when body mass was included as a covariate and phylogenetic effects were taken into account (LM: b = -0.38, t189= 4.70, P < 0.0001; PGLM: b = 0.08, t189= 1.13, P = 0.25). In terms of the remaining confounding factors, our results do not indicate any significant association between lifespan and ecological variables (habitat, diet, feeding generalism, or habitat breadth), in line with findings by Harvey and CluttonBrock (1985). Previous work in birds showed a negative association between lifespan and latitude, which can be explained by differential effects of biological and environmental interactions at different latitudes (Møller, 2007; Blumstein & Møller, 2008). Likewise, Duncan et al. (1999) found a significant correlation between lifespan and geographic range in birds. In contrast, in our study of mammals, we did not find any significant relationship between lifespan and geographic variables (mid-latitude point, range size and discontinued distribution). Mid-latitude point and range size were significantly associated with lifespan, but these association disappeared when research effort and lifespan measure (captive vs. wild) were included as co-variates in the model. Even after controlling for ecological and geographic factors, the predicted brain-lifespan association remained strong.. Age at first reproduction was the only life history trait retained in the MAM as a predictor of lifespan, along with body mass and residual brain size. This finding is consistent with previous studies in birds and mammals (Rushton 2004; Møller, 2006; Blumstein & Møller, 2008, Isler & van Schaik, 2009a). Barrickman et al. (2008) proposed that associations between brain enlargement and duration of the reproductive life must be tested by subtracting the growth period from maximum lifespan. Performing such an analysis, we found that the correlation between lifespan and relative brain size holds. Thus the observed correlation is not the result of an elongated juvenile period confounding the lifespan measure. Our results thus add to 33.
(34) evidence for the cognitive buffer hypothesis by which a large brain assists in buffering individuals against environmental challenges by facilitating flexible behavioural responses (Allman et al. 1993; Deaner et al. 2003; Sol 2009a,b). This buffer effect should increase survival rates (Sol et al., 2007; Shultz et al. 2005) and favour a longer reproductive life, thereby partially compensating for the costs of delayed reproduction associated with the need to grow a large brain. Nevertheless, it is possible that an extended reproductive period is insufficient to fully counterbalance the costs of delayed reproduction in large-brained mammals. For example, Isler & van Schaik (2009a) demonstrated a negative correlation between the maximum rate of population increase and mammalian brain size. This raises the issue of additional counterbalancing advantages to brain enlargement (Isler & van Schaik 2009a, b). The evidence for the brain size-lifespan association is correlational and does not necessarily reflects a causal relationship. In fact, the cognitive buffer hypothesis is just one of a set of theories that predict the brain size-lifespan correlation (Deaner et al., 2003; Sol, 2009a). For example, while the cognitive buffer hypothesis argues that large brains facilitate a longer lifespan, it is also possible that a longer lifespan selects for larger brains (Deaner et al. 2003; Sol, 2009a,b). Our results do not allow us to distinguish between these possibilities. Moreover, these different theories are not mutually exclusive and may act together to generate positive feedback favouring further increase in brain volume and longevity (Sol, 2009a,b). For instance, longevity can favour a delayed onset of reproduction, which should give parents the opportunity of prolonged investment in and contact with offspring (Covas & Griesser, 2007). This can facilitate an increase in brain size if, as the social intelligence hypothesis suggests, individuals living in stable social groups face higher cognitive demands that individuals living alone (Byrne & Corp, 2004; Dunbar & Shultz, 2007a; Shultz & Dunbar 2007). Despite its correlative nature, the finding that large-brained mammals live longer is important because it provides a solid basis from which integrate brain size evolution within a life history framework (Deaner et al. 2003; Isler & van Schaik, 2009a, b; Sol, 2009a,b). As Ricklefs (2004) notes, the evolution of large brains and cognition is rarely considered in this manner. A fruitful avenue for future research would be to elucidate the complex causal links that may help integrate brain size into the life-history strategy of the species.. 34.
(35) Acknowledgments We thank L. Lefebvre for helpful discussion over many years, I. Bartomeus for their help in gathering information, K. Isler for providing advice on data sources, K. W. S. Ashwell for providing data, R. P. Freckleton for providing the code for the PGLS, and O.R.P. Bininda-Emonds for the mammalian phylogeny. This work was supported by a Proyecto de Investigación (CGL2007-66257), a Consolider project (CSD 200800040), a Royal Society Postdoctoral Fellowship, and a Utrecht University ‘High Potentials’ grant. C. G-L was supported by BPR 2008 (MIDEPLAN-Chile) and FIDGR 2009 (AGAUR, Generalitat de Catalunya-European Social Fund).. REFERENCES Aiello, L.C. & Wheeler, P. 1995. The expensive-tissue hypothesis: the brain and the digestive-system in human and primate evolution. Curr. Anthropol. 36: 199–221. Allman, J., McLaughlin, T. & Hakeem, A. 1993. Brain weight and life-span in primate species. Proc. Natl. Acad. Sci. U.S.A. 90:118-122. Allman, J. 2000. Evolving Brains. Scientific American Library, New York. Ashwell, K.W.S. 2008. Encephalization of Australian and New Guinean marsupials. Brain Behav. Evol. 71:181-199. Barrickman, N.L., Bastian, M.L., Isler K. & van Schaik, C.P. 2008. Life history costs and benefits of encephalization: a comparative test using data from long-term studies of primates in the wild. J. Hum. Evol. 54:568-590. Barton, R. 1999. The evolutionary ecology of the primate brain. In: Comparative Primate Socioecology (P. Lee, ed), pp. 167-194. Cambridge University Press, Cambridge. Barton, R. & Harvey, P.H. 2000. Mosaic evolution of brain structure in mammals. Nature 405:1055-1058. Bennet, P.M. & Harvey, P.H. 1985. Relative brain size and ecology in birds. J. Zool. Lond. 207: 151-169. Bielby, J., Mace, G.M., Bininda-Emonds, O.R.P., Cardillo, M., Gittleman, J.L., Jones, K.E., Orme, C.D.L. & Purvis, A. 2007. The Fast-Slow Continuum in Mammalian Life History: An Empirical Reevaluation. Am. Nat. 169:748-757. Bininda-Emonds, O.R.P., Cardillo, M., Jones, K.E., MacPhee, R.D.E., Beck, R.M.D., Grenyer, R., Price S.A., Vos, R.A., Gittleman, J.L. & Purvis, A. 2007. The delayed. 35.
(36) rise of present-day mammals. Nature 446:507-512. Corrigendum (2008) Nature 456: 274. Blomberg, S.P., Garland, T. & Ives, A.R. 2003. Testing for phylogenetic signal in comparative data: behavioral traits are more labile. Evolution 57:717-745. Blumstein, D.T. & Møller, A.P. 2008. Is sociality associated with high longevity in North American birds? Biol. Lett. 4: 146-148. Byrne, R.W. & Whiten, A. 1988. Machiavellian Intelligence: Social Expertise and the Evolution of Intellect in Monkeys, Apes, and Humans. Oxford University Press, New York. Byrne, R. W. & Corp, N. 2004. Neocortex size predicts deception rate in primates. Proc. R. Soc. B 271: 1693–1699. Byrne, R.W. & Bates, L.A. 2007. Sociality, Evolution and Cognition. Curr. Biol. 17: R714-R723. Casey, B.J., Galvan, A. & Hare, T.A. 2005. Changes in cerebral functional organization during cognitive development. Curr. Opin. Neurobiol. 15:239-244. Changizi, M.A. 2003. Relationship between number of muscles, behavioral repertoire size, and encephalization in mammals. J. Theor. Biol. 220:157-168. Cheney, D.L. & Seyfarth, R.M. 1986. The recognition of social alliances by vervet monkeys. Anim. Behav. 34: 1722-1731. Clutton-Brock, T.H. & Harvey, P.H. 1980. Primates, brains and ecology. J. Zool. Lond. 190: 309-323. Covas, R. & Griesser, M. 2007. Life history and the evolution of family living in birds. Proc. R. Soc. B 274: 1349–1357. Deaner, R. O., Nunn, C. L. & van Schaik, C. P. 2000. Comparative tests of primate cognition: different scaling methods produce different results. Brain, Behav. Evol. 55:44-52.. Deaner, R.O., Barton, R.A, & van Schaik, C. 2003. Primate brains and life histories: renewing the connection. In: Primates Life Histories and Socioecology (P.M. Kappeler & M.E. Pereira, eds), pp. 233-265. The University of Chicago Press, Chicago. Deaner, R.O., Isler, K., Burkart, J. & van Schaik, C. 2007. Overall brain size, and not encephalization quotient, best predicts cognitive ability across non-human primates. Brain Behav. Evol. 70: 115-124. Dorst, J. & Dandelot, P. 1973. Guía de campo de los mamíferos salvajes de África. Ediciones Omega, S. A. Barcelona. Duncan, R.P., Blackburn, T.M. & Veltman, C.J. 1999. Determinants of geographical range sizes: a test using introduced New Zealand birds. J. Anim. Ecol. 68:963-975. 36.
(37) Dunbar, R.I.M. & Shultz, S. 2007a. Evolution in the social brain. Science 317: 1344. Dunbar, R.I.M. & Shultz, S. 2007b. Understanding primate brain evolution. Phil. Trans. R. Soc. B 362: 649-658. Economos, A.C. 1980. Brain-life span conjecture: a reevaluation of the evidence. Gerontology 29: 113-120. Ernest, S.K.M. 2003. Life history characteristics of placental nonvolant mammals. Ecology 84:3402-3402. Felsenstein, J. 1985. Phylogenies and the comparative method. Am. Nat. 125:1-15. Finarelli, J.A. & Flynn, J.J. 2009. Brain-size evolution and sociality in Carnivora. Proc. Natl. Acad. Sci. U.S.A. 106: 9345-9349. Folkens, P.A., Reeves, R.R., Stewart, B.S. & Clapham, P. J. 2002. Guide to marine mammals of the world. National Audobon Society. Chanticleer Press Edition, New York. Forsyth, D.M., Duncan, R.P., Bomford, M. & Moore, G. 2004. Climatic suitability, lifehistory traits, introduction effort, and the establishment and spread of introduced mammals in Australia. Conserv. Biol. 18:557-569. Freckleton, R.P., Harvey, P.H. & Pagel, M.D. 2002. Phylogenetic analysis and comparative data: a test and review of evidence. Am. Nat. 160:712-726. Garland, T., Midford, P.E. & Ives, A.R. 1999. An introduction to phylogeneticallybased method statistical methods, with a new method for confidence intervals on ancestral states. Am. Zool. 39: 374-388. Garland, T. & Ives, A.R. 2000. Using the past to predict the present: confidence intervals for regressions equations in phylogenetic comparative methods. Am. Nat. 155: 346-364. Hakeem, A., Sandoval, G., Jones, M. & Allman, J. 1996. Brain and lifespan in primates. In: Handbook of the Psychology of Aging (J. Birren & K. Schaie, eds), pp 78-104. 4th edn. Academic Press, San Diego. Hansen, T. & Orzack, S.H. 2005. Assessing current adaptation and phylogenetic inertia as explanations of trait evolution: the need for controlled comparisons. Evolution 59:2063-2072. Harvey, P.H. & Clutton-Brock, T.H. 1985. Life history variation in Primates. Evolution 39: 559-581. Harvey, P.H. & Krebs, J.R. 1990. Comparing brains. Science 249:140-146.. 37.
(38) Harvey, P.H., Pagel, M.D. & Rees, J.A. 1991. Mammalian metabolism and life histories. Am. Nat. 137:556-566. Healy, S.D. & Rowe, C. 2007. A critique of comparative studies of brain size. Proc. R. Soc. Lond. B 247: 453-464. Hofman, M.A. 1993. Encephalization and the evolution of longevity in mammals. J. Evol. Biol. 6:209-227. Humphrey, N.K. 1976. The social function of intellect. In: Growing Points in Ethology (P.P.G. Bateson & R.A. Hinde, Eds), pp. 303-317. Cambridge University Press, Cambridge. IUCN. 2008. 2008 IUCN Red List of Threatened Species. See http://www.iucnredlist.org Isler, K., Kirk, E.C., Miller, J.M.A., Albrecht, G.A., Gelvin, B.R. & Martin, R.D. 2008. Endocranial volumes of primate species: scaling analyses using a comprehensive and reliable data set. J. Hum. Evol. 55:967-978. Isler, K. & van Schaik, C.P. 2006. Metabolic cost of brain size evolution. Biol. Lett. 2:557-560. Isler, K. & van Schaik, C.P. 2009 (a). Why are there so few smart mammals (but so many smart birds)? Biol. Lett. 5:125-129. Isler, K. & van Schaik, C.P. 2009 (b). The Expensive Brain: a framework for explaining evolutionary changes in brain size. J. Hum. Evol. 57:392-400. Iwaniuk, A.N. & Nelson, J. E. 2003. Developmental differences are correlated with relative brain size in birds: a comparative analysis. Can. J. Zool. 81: 1913–1928. Iwaniuk, A.N., Dean, K.M. & Nelson, J.E. 2004. A mosaic pattern characterizes the evolution of the avian brain. Biol. Lett. 271:S148-S151. Jackson, T. 2007. The Illustrated Encyclopedia of Animals of Africa, Britain and Europa. Annes Publishing Ltd., London. Jerison, H. J. 1973. Evolution of the Brain and Intelligence. Academic Press, London. Jolly, A. 1966. Lemur social behavior and primate intelligence. Science 153: 501-506. Judge, D.S. & Carey, J.R. 2000. Postreproductive Life Predicted by Primate Patterns. J. Gerontol. A. Biol. Sci. Med. Sci. 55:B201-209. Kaplan, H., Mueller, T., Gangestad, S. & Lancaster, J.B. 2003. Neural capital and life span evolution among primates and humans. In: Brain and Longevity (C. E. Finch, J. M. Robine, & Y. Christen, eds), pp. 69–98. Springer, Berlin. Kingdon, J. 1997. The Kingdom field guide to Mammals of Africa. Academic Press, San Diego. 38.
(39) Lefebvre, L., Whittle, P., Lascaris, E. & Finkelstein, A. 1997. Feeding innovations and forebrain size in birds. Anim. Behav. 53:549-560. Lefebvre, L., Reader, S.M. & Sol, D. 2004. Brains, innovations and evolution in birds and primates. Brain Behav. Evol. 63:233-246. Lefebvre, L. & Sol, D. 2008 Brains, lifestyles and cognition: are there general trends? Brain Behav. Evol. 72: 135–144. Lewis, J.W. 2006. Cortical networks related to human use of tools. Neuroscientist 12:211-231. Long, J.L. 2003. Introduced mammals of the world: their history, distributions & influence. CABI Publishing, Collingwood, United Kindom. de Magalhaes, J.P. & Costa, J. 2009. A database of vertebrate longevity records and their relation to other life history traits. J. Evol. Biol. 22: 1770-1774. Martin, T.E., Bassar, R.D., Bassar, S.K., Fontaine, J.J., Lloyd, P., Mathewson, H.A., Niklison, A.M. & Chalfound, A. 2006. Life-history and ecological correlates of geographic variation in egg and clutch mass among passerine species. Evolution 60:390-398. McNamara, J.M., Barta, Z., Wikelski, M. & Houston, A.I. 2008. A theoretical investigation of the effect of latitude on avian life histories. Am. Nat. 172: 331-345. Milton, K. 1988. Foraging behaviour and the evolution of primate intelligence. In: Machiavellian Intelligence (R. W. Byrne & A. Whiten, eds.), pp. 285-305. Clarendon Press, Oxford. Mitchell-Jones, A.J., Amori, G., Bogdanowicz, W., Krystufek, B., Reijnders, P., Spitzenberger, F., Stubbe, M., Thissen, J.B.M., Vohralik, V. & Zima J. 1999. The Atlas of European Mammals. Academic press, London. Møller, A.P. 2006. Sociality, age at first reproduction and senescence: comparative analyses of birds. J. Evol. Biol. 19:682-689. Møller, A.P. 2007. Senescence in relation to latitude and migration in birds. J. Evol. Biol. 20:750-757. Newton, I. 1995. The contribution of some recent research on birds to ecological understanding. J. Anim. Ecol. 64: 675-696. Nunn, C.L., & Barton, R.A. 2000. Allometric slopes and independent contrasts: a comparative test of Kleiber's law in primate ranging patterns. Am. Nat. 156: 519-533. Pagel, M.D. & Harvey, P.H. 1988. The taxon-level problem in the evolution of mammalian brain size: facts and artifacts. Am. Nat. 132: 344.. 39.
(40) Parker, S.T. & Gibson, K.R. 1977. Object manipulation, tool use and sensorimotor inttelligence as feeding adaptations in cebus monkeys and great apes. J. Hum. Evol. 6: 623-641. Parker, S.T. & Gibson, K.R. 1979. A developmental model for the evolution of language and intelligence in early hominids. Behav. Brain Sci. 2: 367-407. Patterson, B.D., Ceballos, G., Sechrest, W., Tognelli, M.F., Brooks, T., Luna, L., Ortega, P., Salazar, I. & Young, B.E. 2003. Digital Distribution Maps of the Mammals of the Western Hemisphere, version 1.0. NatureServe, Arlington, Virginia, USA. See http://www.natureserve.org Phillimore, A.B., Freckleton, R.P., Orme, C.D.L. & Owens, I.P.F. 2006. Ecology predicts large-scale patterns of phylogenetic diversification in birds. Am. Nat. 168: 220-229. Promislow, D.E.L. & Harvey, P.H. 1990. Living fast and dying young: A comparative analysis of life-history variation among mammals. J. Zool. Lond. 220: 417-437. R Development Core Team. (2005). R: a language and environment for statistical computing. Vienna, Austria R Foundation for Statistical Computing. Available at http://www.R-project.org. Reader, S.M. & Laland, K.N. 2002. Social intelligence, innovation, and enhanced brain size in primates. P. Natl. Acad. Sci. U.S.A. 99: 4436-4441. Reader, S.M. & Laland, K.N., eds. 2003. Animal Innovation. Oxford University Press, Oxford. Reader, S.M. 2003. Innovation and social learning: Individual variation and brain evolution. Animal Biology 53: 147-158. Ricklefs, R.E. 2000. Intrinsic aging-related mortality in birds. J. Avian Biol. 31:103111. Ricklefs, R.E. & Scheuerlein, A. 2001. Comparison of aging-related mortality among birds and mammals. Exp. Gerontol. 36: 845-857. Ricklefs, R.E. & Wikelski, M. 2002. The physiology/life-history nexus. Trends Ecol. Evol. 17: 462-468. Ricklefs, R.E. 2004. The cognitive face of avian life histories. Wilson Bull. 116: 119133. Röhrs, M. & Ebinger, P. 2001. How is cranial capacity related to brain volume in mammals? Mamm. Biol. 66:102–110. Ross, C. & Jones, K. 1999. Socioecology and the evolution of primate reproductive rates. In: Comparative Primate Socioecology (P. Lee, ed.), pp 73-110. Cambridge University Press. Cambridge. 40.
(41) Rushton, J.P. 2004. Placing intelligence into an evolutionary framework or how g fits into the r-K matrix of life-history traits including longevity. Intelligence 32: 321-328. Sacher, G.A. & Staffeldt, E. F. 1974. Relation of gestation time to brain weight for placental mammals: Implications for the theory of vertebrate growth. Am. Nat. 108:593-615. van Schaik, C. & Deaner, R.O. 2003. Life history and cognitive evolution in primates. In: Animal Social Complexity: Cultural and Individualized Societies (F. de Waal & P. L. Tyack, eds.), pp 5-25. Harvard University Press, Cambridge. Schilling, D., Singer, D. & Diler, H. 1987. Guía de los mamíferos de Europa. Ediciones Omega, Barcelona. Schuck-Paim C., Alonso W.J. & Ottoni E.B. 2008. Cognition in an ever-changing world: Climatic variability is associated with brain size in Neotropical parrots. Brain Behav. Evolut. 701: 200-215. Shultz, S. & Dunbar, R.I.M. 2007. The evolution of the social brain: anthropoid primates contrast with other vertebrates. Proc. R. Soc. Lond. B Biol. Sci. 270: 22852291. Shultz, S., Bradbury, R.B., Evans, K.L., Gregory, R.D. & Blackburn, T.M. 2005. Brain size and resource specialization predict long-term population trends in British birds. Proc. R. Soc. Lond. B Biol. Sci. 272: 2305-2311. Smith, R.J. & Jungers, W.L. 1997. Body mass in comparative primatology. J. Hum. Evol. 32:523-559. Sol, D., Duncan, R.P., Blackburn, T.M., Cassey, P. & Lefebvre, L. 2005. Big brains, enhanced cognition, and response of birds to novel environments. P. Natl. Acad. Sci. U.S.A. 102: 5460-5465. Sol, D., Szekely, T., Liker, A. & Lefebvre, L. 2007. Big-brained birds survive better in nature. Proc. R. Soc. Lond. B Biol. Sci. 27: 736-769. Sol, D. & Price, T. D. 2008. Brain and the diversification of body size in birds. Am. Nat. 172: 107-177. Sol, D., Bacher, S., Reader, S.M. & Lefebvre L. 2008. Brain size predicts the success of mammal species introduced into novel environments. Am. Nat. 172: S63-S71. Sol, D. 2009 (a). The cognitive-buffer hypothesis for the evolution of large brains. In: Cognitive Ecology (R. Dukas & R. M. Ratcliffe, eds.), pp. 111-134, Chicago University Press, Chicago. Sol, D. 2009 (b). Revisiting the cognitive buffer hypothesis for the evolution of large brains. Biol. Lett. 5: 130–133.. 41.
(42) Speakman, J.R. 2005. Body size, energy metabolism and lifespan. J. Exp. Biol. 208: 1717-1730. Stearns, C.S. 2000. Life history evolution: successes, limitations, and prospects. Naturwissenschaften 87: 476-486. Strahan, R. 1995. Mammals of Australia. Smithsonian Institution Press. Washington DC. Timmermans, S., Lefebvre, L., Boire, D. & Basu, P. 2001. Relative size of the hyperstriatum ventrale is the best predictor of feeding innovations rate in birds. Brain Behav. Evol. 56: 196-203. Weckerly, F.W. 1998. Sexual size dimorphism: influence of mass and mating system in the most dimorphic mammals. J. Mammal. 79: 33-52. Weigl, R. 2005. Longevity of mammals in captivity; from the living collections of the world. Schweizerbart, Stuttgart. Whiten A. 2000. Chimpanzee cognition and the question of mental re-representation. In: Metarepresentation: A multidisciplinary perspective (D. Sperber, ed.), pp. 139– 167. Oxford University Press, Oxford. White, C.R., Blackburn T.M. & Seymour, R.S. 2009. Phylogenetically informed analysis of the allometry of mammalian basal metabolic rate supports neither geometric nor quarter-power scaling. Evolution 63: 2658-2667. Wilson, D.E. & Reeder, D.M. 2005. Mammal Species of the World. A Taxonomic and Geographic Reference, 3rd edn. Johns Hopkins University press.. 42.
(43) Chapter 2# Food unpredictability, Motivation and Corticosterone levels influence the propensity to Innovate. With Oriol Lapiedra and Daniel Sol. Unpublished. 43.
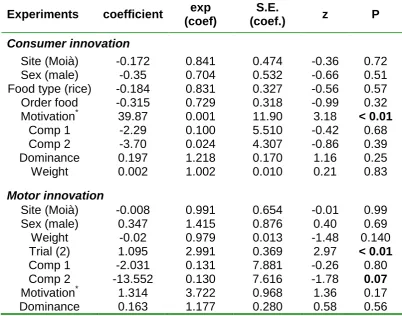
(44) ABSTRACT Behavioral innovations are considered a main way animals confront environmental challenges. Although evidence is accumulating that individuals differ in innovation propensity, the underlying mechanisms remain poorly understood. In general, differences in innovativeness are thought to reflect different cognitive abilities, but besides the notable exception of a few animal taxa with extraordinary cognitive abilities, confidence in this hypothesis is undermined by a perceived lack of empirical support. In contrast, evidence is accumulating that the main factor driving innovation is motivation, in line with the “necessity drives innovation hypothesis”. However, motivation is generally assumed to be a state-dependent property and hence it should not lead to consistent individual differences in innovation. Here, we test the hypothesis that risk perception may lead to consistent differences in motivation through its effect on the endocrine system, thereby indirectly affecting the propensity to innovate. We validate this hypothesis by assessing how motivation and problemsolving performance differs in feral pigeons (Columba livia) with different perceptions of starvation risk. Through a battery of experiments, we first show that there exist consistent individual differences in motivation levels and that these differences account for a significant part of the individual variation in consumer innovation propensity. Interestingly, although motivation did not have a significant heritable component, it is related to glucocorticoides and hence in risk-taking behavior. These differences were not associated with the social status of the individual but with the uncertainties in food supplies in their new environment relative to that of origin. Thus, individuals used to stable food supplies were more motivated when food deprived, than those relying on less stable food supplies. Taken together, these results support the hypothesis that risk perception may lead to consistent differences in motivation and, indirectly, in the propensity to resolve ecological challenges in novel ways.. 44.
(45) INTRODUCTION Innovation, a key component of behavior flexibility, is an important way to deal with changes in the environment (Reader & Laland 2003; Sol et al. 2005). Recent work shows that innovation propensity consistently varies among individuals in a number of species, including house sparrows (Passer domesticus) (Liker & Bókony 2009), carib grackles (Quiscalus lugubris) (Overington et al. 2011) great tits (Parus major) (Cole et al. 2011; Morand-Ferron et al. 2011), blue tits (Cyanistes caeruleus) (Morand-Ferron et al. 2011), spotted hyenas (Crocuta crocuta)(Benson-Amram & Holekamp 2012) and meerkats (Suricata suricata) (Thornton & Samson 2012). Although such individual differences are often attributed to cognitive capacities, experimental evidence suggest that they can also result from individual variation in temperament and motivation (Laland & Reader 1999; Cole & Quinn 2012; Sol et al. 2012). Motivation in particular has been found to be the major driver of innovation, in line with the “necessity drives innovation hypothesis” (Laland & Reader 1999). For example, Laland & Reader found that in guppies (Poecilia reticulata), hungry individuals are more innovative than non-hungry individuals. Unlike temperament traits, however, motivation is generally supposed to be a state-dependent property and hence it should not lead to individual consistent differences in innovation. Nevertheless, there are several scenarios that may select for individual differences in motivation. For example, individuals that rely on resources that are variable and unpredictable over time may have been selected for higher motivation to search for food than those relying in more stable resource supplies (i.e. Hewitson et al. 2005). It is worth noting that the uncertainty in resources availability may result not only from living in a variable environment, but also from reduced access to food opportunities due to competition. Indeed, social conflicts that restrict access to food for some individuals, would produce stressful events that may increase basal corticosterone levels (but see Pravosudov et al. 2003). The perception of uncertainty is known to trigger the hypothalamo-pituitary-adrenal (HPA) system, which results in increased circulating corticosterone (i.e. the main glucocorticoid in birds) (Wingfield et al. 1998; Reneerkens et al. 2002). Baseline plasma concentration and acute release of corticosterone have different mechanisms of action, with different behavioural and physiological consequences (Wingfield et al. 1998; Romero 2004). For one way, glucocorticoids at baseline levels have control functions on the energetic metabolism (i.e. regulate intake, storage and mobilization of energy) (Sapolsky et al. 2000; 45.
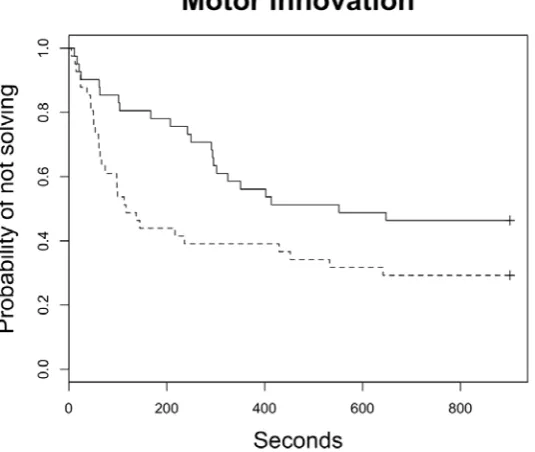
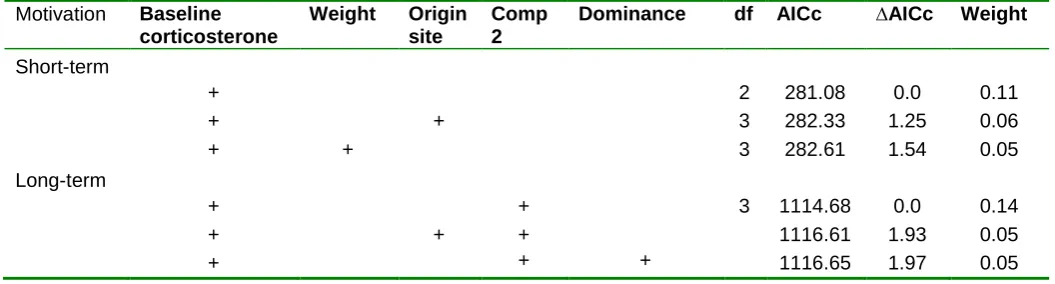
(46) Landys et al. 2006). For example, in front of unpredictable long-term feeding schedules, a high-perceived risk of starvation would make individuals to maintain higher energy reserves and high basal corticosterone levels (Cuthill et al. 2000). Indeed, high basal corticosterone levels are known to promote fattening in birds, which may be considered a protection mechanism against unpredictability (Reneerkens et al. 2002). In another way, when individuals confront acute and adverse situations (i.e. predator attack), glucocorticoids secretion can increase in a few minutes. This acute increase in glucocorticoids concentration redirects behaviour and physiology to prioritizing immediate survival (sensu “emergency life-history stage”) (Wingfield et al. 1998; Sapolsky et al. 2000).. Here, we explore the intriguing possibility that motivation can be considered a temperament trait that modulates the propensity to innovative with a series of experiments in feral pigeons, Columba livia. Previous work has shown that motivation is a major driver of learning and innovation propensity in pigeons, the main components of behavior flexibility (Lefebvre et al. 1996; Seferta et al. 2001). Building on this finding, we ask (1) whether the motivation to innovate has an individual stable component within- and between- populations (i.e. evidence of temperament, sensu Réale et al. 2007), (2) whether individuals differ in motivation as function of the unpredictability of food sources in their environment and/or on their social status and aggressive temperament, and (3) whether motivation has an hormonal basis and an heritable component. To address these issues, we studied two pigeon populations, one that relies on food sources available on a regular basis, and another that depends on more unpredictable sources (Sol 2008). After equalizing their food necessities through a common garden experiment, we exposed pigeons from both populations to a battery of behavioural tests designed to measure motivation, consumer and motor innovation, aggressiveness and social dominance. If motivation were a response to food shortages, we would expect that motivation was higher in individuals from the population relying on unpredictable food sources and within each population, in the individuals with lower social status (i.e. less likely to obtain food under direct competition with other individuals). However, if individuals that rely on more stable resources were not used to deal with food shortages, the contrary would be true. Once experiments were finished, we took blood samples of individuals and estimate the corticosterone profile in the laboratory. To assess whether motivation 46.
Figure


+7


Documento similar
This article describes the current situation of desalinated seawater production and supply to agriculture in the southeast of Spain, and analyzes key questions such as its role
In this work we evaluate a keyword spotting system performance by incorporating an evolutionary algorithm as confidence measure and compare its performance with traditional
In addition, we define a new role for FGFR4 as regulator of the epithelial-mesenchymal transition and invasion in colorectal cancer that makes it an attractive target for
Linked data, enterprise data, data models, big data streams, neural networks, data infrastructures, deep learning, data mining, web of data, signal processing, smart cities,
DCAT application profile for data portals in Europe (DCAT-AP) is a specification for describing catalogs and datasets from public sector data portals, using metadata, in a way
Syntactic roots have been defined in different ways: as the repository of idiosyn- cratic underspecified meaning that do not play a role in the syntactic derivation (Borer 2005), as
Accordingly, macrophages are the major leukocyte subpopulation present in ADM and PanINs (Clark et al., 2007) and, importantly, it has been shown that in response to
In summary, our results identify ING1 as a critical epigenetic regulator of cellular senescence in human fibroblasts and highlight its role in control of gene expres- sion in
