DISEASE IN HUMANS:
A CROSS-POPULATION EXPLORATION
Urko Martínez Marigorta
DOCTORAL THESIS UPF / 2012
THESIS DIRECTOR
Dr. Arcadi Navarro
Vull donar les gràcies a tothom que m’he trobat i m’ha ajudat
aquests anys. M’he sentit molt apreciat, i he pogut gaudir de
la companyia de gent que m’ha donat moltes ensenyances.
N’he après molt. No oblidaré tampoc les lliçons que he pogut
extraure de vertaders models científics. Us he intentat copiar
molt: la capacitat intel·lectual, la resistència mental,
l’empenta i rauxa, la integritat científica, el seny, procurar
admiració en l’enveja i la humilitat en el no saber. En especial,
vull citar expressament la visió, empenta i il·lusió de l’Arcadi.
Agrair també l’amistat a tota la gent de, tant de Barcelona
(euskaldunak!) com de Girona. En sigui aquesta feina que he
intentat fer de valent una petita penyora.
Pocas palabras bastan para cada uno de vosotros. Todo el
amor, el carácter y los esfuerzos económicos. Vosotros y yo
sabemos porqué no ha sido fácil. Esté cada uno donde esté,
espero orgullo de este trabajo, aunque no sea más que una
pequeña parte de una lucha muy antigua. En el recuerdo.
The aetiology of common diseases is shaped by the effects of genetic and environmental factors. Big efforts have been devoted to unravel the genetic basis of disease with the hope that it will help to develop new therapeutic treatments and to achieve personalized medicine. With the development of high-throughput genotyping technologies, hundreds of association studies have described many loci associated to disease. However, the depiction of disease architecture remains incomplete. The aim of this work is to perform exhaustive comparisons across human populations to evaluate pressing questions. Our results provide new insights in the allele frequency of risk variants, their sharing across populations and the likely architecture of disease.
Resumen
The central dogma of molecular biology describes that genetic information in biological systems is mostly transferred in a single direction that goes from DNA to RNA and proteins. It was established in the 60s (20th century!) but still prompted me and
many of my lab fellows to make research in biology. It will be so forever. Yet, young people do not join anymore because of an easy dogma but the beauty of an ever filling puzzle.
Complexity is not the only trend in biology. The development of high throughput technologies such as those used in genomics is producing increasing amounts of biological data. Since a while ago, not data but making sense of it is the main priority for biologists.
One of the deepest reasons behind the abovementioned revolutions is related to a special kind of phenotype: pathology in humans. It is hoped that unveiling the factors that shape disease will permit to develop new disease treatments and large amounts of money are devoted, for instance, to medical genetics.
Index
Acknowledgements... vii
Abstract – Resumen... ix
Preface... xi
1. INTRODUCTION 1 1.1. Epidemiology and the genetics of disease 1.1.1. Epidemiology and genetic epidemiology... 3
1.1.2. Familial resemblance and heritability... 7
1.1.3. Types of genetic variation in disease... 9
1.1.4. Mendelian disease... 14
1.2. Complex disease 1.2.1. Introduction and prevalence... 17
1.2.2. Early inference of disease architecture... 19
1.2.3. The “CD /CV” hypothesis... 22
1.3. LD-based association mapping 1.3.1. The HapMap project and the patterns of LD... 25
1.3.2. Candidate gene association studies... 27
1.3.3. Lack of replication of the candidate approach... 29
1.3.4. Genome-wide association studies... 32
1.4. Beyond GWAS 1.4.1. Knowledge gained through GWAS... 39
1.4.2. “Missing heritability” and alternative models... 41
1.4.3. Disease architecture across populations... 47
3. RESULTS 57 3.1. Recent human evolution has shaped geographical
d differences in susceptibility to disease... 59
3.2. High trans-ethnic replicability of GWAS results
i implies common causal variants... 75
4. DISCUSSION 105
Bibliography 129
Appendix. Contributions to other articles 149 A.1. Copy number variation analysis in the great apes
a reveals species-specific patterns of structural variation 151
A.2. Adaptive evolution of loci covarying with the human
man African Pygmy phenotype... 153
Attached CD
B.1. Supplementary material for section 3.1 B.2. Supplementary material for section 3.2
Cæteris paribus… All other things being equal...
1.1. Epidemiology and the genetics of disease
The work in this thesis focuses on the genetic architecture of
complex disease across populations. Concepts from such disparate
fields as epidemiology and quantitative genetics should be
introduced. I prioritized an introduction about disease in
populations, the role of genetics in disease, the types of risk variants
and an introduction to Mendelian disease.
1.1.1. Epidemiology and Genetic Epidemiology
Epidemiology studies the occurrence and determinants of disease in populations (Rothman 2002). Usually, causation is multifactorial and variable across individuals. Epidemiology goes beyond the description of causes and measures their strength in populations. These calculations allow comparing disease in different groups; thereby giving perspectives in public health (Figure 1).
Two main types of study are used in epidemiology: cohort and case-control studies. Individuals from a cohort are initially disease-free and ascertained because of a shared characteristic or risk exposure (e.g. the 1958 British Birth cohort). These individuals are followed over a period of time, and the estimates of relative risk (RR) can be drawn. Relative risk measures the ratio of disease probabilities in exposed over unexposed persons. These measures serve to weight the attributable risks in populations.
Figure 1. Map by John Snow showing London cholera cases in 1854.
Although the gold standard in the field, cohort studies are lengthy in time because only a fraction of individuals will develop disease. The case-control approach is an immediate alternative, in particular for rare conditions (Rothman 2002). In this design, disease patients are identified and their suspected exposures are compared with those of healthy controls. Ideally, control individuals must be unbiased representatives of the same population that gives rises to the cases; special efforts are devoted to statistical adjustment to avoid confounding. From a contingency table, the association of exposures and case-control status is measured by means of the odds ratio (OR), the ratio of the odds of exposure in cases to the odds in the controls (Rothman 2002).
Given their observational nature, epidemiological studies must deal with all kind of possible biases. For instance, selection bias may occur if the selected individuals are not good representatives of the population at risk. Any difference in variables other than the exposure among the source under study may lead to a confounding. Epidemiologists devote especial efforts to avoid any such confounding (i.e. matching samples for known confounders).
case-control studies, family-based designs are the cornerstones of the field.
Figure 2. Progression steps in genetic epidemiology.
Summary of main tasks done in genetic epidemiology, from the initial hypothesis on a role for genetics underlying familial aggregation to fine mapping (Thomas 2004).
prevalence of disease across populations and would help in the study of the evolutionary history of disease.
1.1.2. Familial resemblance and heritability
The study of patterns of familial aggregation constitutes the first step to ensure that genetic variants shape disease aetiology. Familial resemblance refers to the increase in phenotypic correlation (e.g. disease prevalence) of relatives compared to unrelated individuals (Ziegler et al. 2010). A comparison of familial resemblances estimated from different relationships among relatives (e.g. siblings, cousins, 2nd cousins) permits an initial
exploration of the range of possible genetic architectures of disease. Nevertheless, recurrence ratios among relatives can arise due to either genetic or environmental factors and thus further methods are needed to ensure that genetics plays a role in disease.
[image:23.499.90.412.385.579.2]75 30 25 23 15 10 7 4 4 3 2.4 Autism Crohn's disease Multiple sclerosis Osteoarthritis Bipolar Disorder Schizophrenia Psoriasis Hypertension Alcoholism Asthma Leprosy
Figure 3. Sibling risk ratios for several disease traits (Ziegler et al. 2010).
Heritability is a population parameter that permits to weight the extent to which variation in a trait is due to genetic factors (Visscher et al. 2008). Specifically, variation observed across individuals is partitioned into unobserved genetic and environmental categories. Each of these partitions captures part of the variance, and the ratio of variances weights the influence of genetic variability in the observed sum of variances (H2,
broad-sense heritability). Further partition of the genetic category into additive, dominant and interaction effects permits to measure h2
(narrow-sense heritability): the fraction of variation attributable to additive genetic factors that serves to predict similarities between parents and offspring. However, the incorporation of complex phenomena such as gene-by-environment interactions to the statistical model difficult these calculations.
The interpretation of heritability can suffer from several misconceptions (Visscher et al. 2008). It is easily forgotten that estimates of heritability are population-specific and can vary across sex and age. Additionally, they are point estimates in time: traits with large heritability can be heavily affected by changes in the environment (e.g. secular rise in human height in modern societies). Hence, differences in environment must be ruled out to conclude that differences among populations are genetic in origin (Feldman and Lewontin 1975). Moreover, the comparison of heritability estimates across diseases and populations can be heavily affected by differences in incidence. Thus, heritability for categorical disease traits is better estimated through the threshold liability model (Visscher et al. 2008). Specifically, an underlying distribution of risk factors is assumed to assign a genetic score of risk to each individual, and prevalence is then used to set the threshold score of disease status.
Positive estimates of heritability predict a role of genetic variants in disease prevalence. Indeed, how easily large-effect alleles are found increases with heritability (phenotype predicts genotype). However, large estimates of heritability do not inform about disease architecture and are not at odds with the observation that abundant cases are sporadic and have no diseased relatives.
1.1.3. Types of genetic variation in disease
influence of environmental factors. A consideration of the types and forces shaping polymorphism is needed to deepen our knowledge of the genetics of disease.
Permanent changes in the DNA molecule arise by mutation (Balding et al. 2007; Crow 2000; Eyre-Walker 2010). Broadly speaking, two kinds of variation can be distinguished in our genomes according to their size: point mutations and structural variation (Frazer et al. 2009). The former are substitutions of a single base known as single nucleotide polymorphisms (SNPs) that form the most prevalent change in human genomes (>53 million SNPs are deposited in the dbSNP repository, release 137). Human genomes carry 10 to 200de novosingle-base mutations and the two haploid genomes in individuals harbour 3x10⁶ differences, or 1 in
1,000 nucleotides (Conrad et al. 2011; Reich et al. 2002).
Each form of a SNP is called allele. Most SNPs are bi-allelic (Slatkin 2008) and their frequency permits to distinguish betweenmajor and
further classified into non-coding (intronic and 5’ and 3’ UTR) and
coding (synonymous, missense and nonsense). The action of natural selection varies across functional categories of SNPs and shapes their allele frequency in human populations (Barreiro et al. 2008).
Structural variants (SVs) are the second class of genetic variants. SVs range from small indels to large chromosomal rearrangements
[image:27.499.81.414.303.442.2](Frazer et al. 2009). Each type has distinctive rates of mutation and variable genome dynamics (Zhang et al. 2009). Examples of SV role in disease are abundant (Eichler et al. 2010; Zhang et al. 2009).
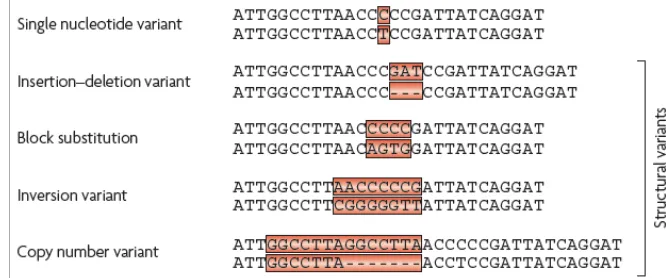
Figure 4. Nomenclature and representation of human genetic variation.
Single nucleotide variants are DNA polymorphisms in which a single base is altered. Insertion-deletion (Indels) variants occur when one or more base pairs are present in some genomes but absent in others. Block substitutions describe cases in which a string of nucleotides varies between two genomes. An inversion variant is one in which the order of the base pairs is reversed in a defined section of a chromosome. Copy number variants occur when nearly identical sequences are repeated in some chromosomes but not others. Adapted from (Frazer et al. 2009)
Besides mutation, recombination also increases genetic variability (Slatkin 2008). Instead of creating new variants, it does so by placing different variants in the same chromosome. The homologous chromosomes of maternal and paternal origin align and exchange segments during meiosis. Thus, recombination creates new combinations of alleles via germ-line mosaics that are passed to the next generation (haplotypes). Recombination rates vary across the genome and hotspots of 1-2 kb length with >100-fold increased rates can be distinguished (Myers et al. 2005).
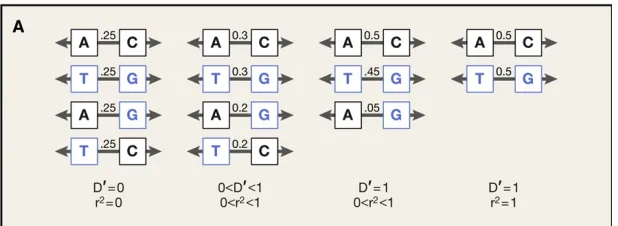
Figure 5. Differences between metrics of Linkage Disequilibrium.
Left: Two markers with 0.5 allele frequency are not linked and each resulting haplotype has a frequency of 0.25. Middle left: Alleles at one marker correlate partially with alleles at the other marker. Middle right: The two alleles are tightly linked. Right: An allele at one marker predicts perfectly the allele at the other marker (only in this situation r2=1).
Adapted from (Raychaudhuri 2011)
by gametic recombination forces the decay of LD. The evolutionary history of populations and the presence of recombination hotspots determine the structure and size of segments that are in LD (haplotype blocks) and its variation across populations (Reich et al. 2001).
Genetic drift is another force that governs the fate of genetic diversity (Hartl and Clark 2007). Living populations are of finite size, and individuals have different number of offspring. Hence, each generation represents a sampling of the allele frequencies in the previous generation. The succession of random changes in allele frequencies diminishes genetic variation, as alleles are either lost or fixed. The effects of genetic drift depend on population size, being more extensive in small populations (Hartl and Clark 2007). Importantly, the estimation of effective population size permits to enclose the effects of genetic drift in populations (Fisher 1930; Wright 1931). Genetic drift plays a major role driving differentiation across populations (Nagylaki 1985). Populations are hierarchically structured because individuals breed with partners from close habitats (Balding et al. 2007). After divergence, allele frequencies fluctuate and thus drift decreases diversity within populations whilst differentiating them.
of variants that diminish the fitness of the individual, whilst positive selection increases the frequency of those improving fitness. Both types of selection result in a decrease of genetic diversity. Finally, balancing selection acts prioritizing the maintenance of different alleles at the same locus and leads to increased levels of heterozygosity.
1.1.4. Mendelian disease
Mendelian diseases constitute the simplest category of genetic disease and are usually monogenic (there is a single gene harbouring deleterious mutations that cause pathology). These disorders run in families through classical Mendelian inheritance. The phenotypic analysis of affected individuals (probands) permits an exploration of the likely architecture of disease (e.g. recessive -dominant segregation (Weiss 1999)).
from UK). Importantly, the effective mutation rate for Mendelian disease correlates with gene length (Weiss 1999).
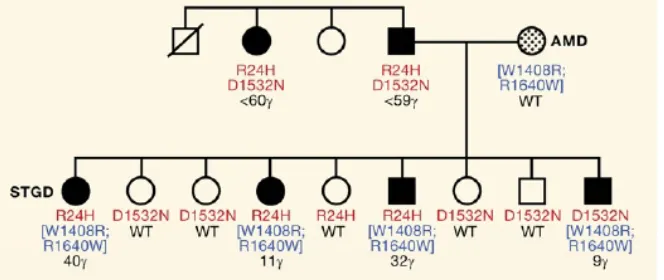
Figure 6. Phenotypic heterogeneity in Mendelian disease.
Example from a pedigree in which different combinations of ABCA4 alleles determine the age-of-onset and severity of Stargardt macular dystrophy (Lupski et al. 2011).
There are known knowns and known unknowns. But there are also unknown unknowns: things we do not know that we don’t know… Donald Rumsfeld, 2002 (adapted)
1.2. Complex diseases
Complex diseases are caused by the effects of genetic and
environmental factors. The modern increase in prevalence of these
diseases fuels the research to unravel their genetic architecture.
1.2.1. Introduction and prevalence
The wordcomplex fits perfect to label diseases such as diabetes or schizophrenia. These diseases arise through intricate and variable interplay between environmental and genetic factors (Botstein and Risch 2003). Complex diseases show familial clustering, but follow non-Mendelian inheritance patterns (Ziegler et al. 2010). Complex diseases are usually acquired at late ages, but the age of onset is highly variable (Wright et al. 2003). Complex diseases present shared morbidities that can be classified in medical handbooks, but their manifestations differ across individuals (Weiss 1999). These inherent complexities difficult the task of uncovering risk factors and the understanding of the ultimate reasons that transform healthy individuals into patients.
knowledge about the pathways involved in aetiology that can lead to targets for drug design (Visscher et al. 2012) and, second, using this knowledge to develop personalized medicine and identify healthy individuals at increased risk of disease (Wray et al. 2010).
[image:34.499.85.415.349.484.2]The prevalence of most complex diseases has exploded in the last two centuries (Gibson 2009). This major shift in human pathology has coincided with the decrease in prevalence of communicable diseases and the ongoing lengthening in life expectancy in developed societies (Di Rienzo and Hudson 2005; Wright et al. 2003). As shown in Figure 7, Several of the diseases linked to “affluence”, such as coronary disease, have substituted trauma and infectious disease as the first causes of death (Pollard 2008).
Figure 7. Change in death cause profile in Chile between 1909 and 1999.
A century ago, almost half of deaths were caused by infectious disease and the number of deaths caused by cancer or cardiovascular disease constituted a minority. This situation has reversed. From (Pollard 2008).
2003). Several evolutionary hypotheses have been put forward to explain current prevalence of complex disease and the differences observed across human populations. Indeed, an evolutionary perspective of disease may help to choose appropriate methods to unravel their genetic architecture (Di Rienzo and Hudson 2005).
Figure 8. Disease prevalence varies across genetic ancestries.
Relative frequencies of cancers in African and European Americans are shown. Cancer types that present significant differences in prevalence (marked in red and green) can be due to genetic, environmental or gene-by-environment variability. From (Winkler et al. 2010).
1.2.2. Early models and inferences of disease architecture
are modelled by the evolutionary processes that act on the phenotype. Importantly, current efforts in modelling disease evolution focus on the fitness effects of susceptibility variants in ancestral environments rather than on current clinical parameters (Di Rienzo and Hudson 2005). Nevertheless, factors such as the late age of onset, the incomplete penetrance of causal variants and the myriad of environmental contributions difficult the modelling of fitness and disease evolution (Di Rienzo and Hudson 2005).
First experimental studies in early 50s and 60s found strong associations (e.g. OR>100) between common variations in ABO and HLA and several types of cancer and autoimmune diseases (Bodmer and Bonilla 2008). Interestingly, these alleles present both high allele frequencies and large effect sizes (e.g. HLA-B27 allele in Ankylosing spondylitis).
environmental shift and the increase in life expectancy would have unmasked the latent genetic susceptibilities to disease (Di Rienzo and Hudson 2005). Evolutionary visions have been proposed to explain the differential prevalence of diabetes and obesity across populations (“New world syndrome”), the higher prevalence of hypertension in African Americans (“sodium retention hypothesis”) or of inflammatory and allergic diseases in urban peoples (“hygiene hypothesis”). Several of these hypotheses are disaccredited, but the tension between ancestral and current environments frames the necessity of non-equilibrium models for complex disease.
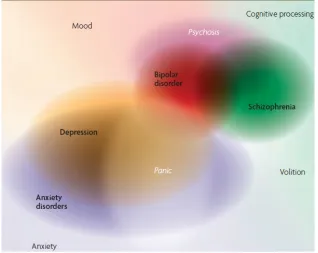
Figure 9. The nebulous architecture of complex disease.
The study of complex disease genetics with positional cloning methods exploded in the 80s thanks to the availability of genomic maps through restriction fragment length polymorphism (Botstein et al. 1980). It is striking that most successful findings were later revealed as false positives (Botstein and Risch 2003), with the main successes being restricted to familial forms of disease (e.g. BRCA1 for breast cancer in young cases). Overall, a scant number of common variants (MAF>10%) such as APOE-ε4 for Alzheimer’s disease and PPARγ for type 2 diabetes were available by mid-90s.
1.2.3. The “Common Disease/Common Variant” hypothesis The somewhat failure of linkage methods, that had been successful for Mendelian diseases, prompted the debate on the methodology necessary to discover variants for complex disease. The few such variants available at the turn of the century evidenced the absence of high-risk alleles and suggested that different variants must account for disease aggregation in relatives.
positives inflation due to the large number of polymorphism that ought to be tested.
Meanwhile, a variety of papers explored disease architecture from a simulation perspective (Pritchard 2001; Pritchard and Cox 2002; Reich and Lander 2001). These studies explored ranges of selective effects for risk variants to answer questions on the frequency and number of alleles expected in disease loci. Overall, only a few of the loci eventually associated to disease would harbour disease mutations. With the caveat of the difficulty to guess in advance which of the disease loci are polymorphic for these variants, the predicted values of allele identity were encouraging for the successful completion of association studies.
These works showed that a regime of weak purifying selection would prevent the fixation of disease variants, leaving them at intermediate frequencies. Given the correlation between genetic variance and heterozygosity (Visscher et al. 2012), these intermediate-frequency alleles would contribute most to the genetic variance of disease, i.e. heritability. Finally, simulation studies suggested that it was possible, at least in principle, that a relatively reduced set of common variants could account for most of the individuals with disease mutations in populations.
in susceptibility genes account for complex disease genetic risk. The slight deleterious effects of these variants in individual fitness explain their high allele frequencies. Their frequency would counterweight the low relative risks of these variants, thus explaining the large prevalence of complex disease. In spite of criticisms (Terwilliger and Weiss 2003; Weiss and Terwilliger 2000), the CD/CV hypothesis was established as the paradigm in human genetics and paved the way for the wave for LD-based association studies.
Figure 10. The difficult quest for the genetic causality of complex traits.
I have nothing to offer but blood, toil, tears and sweat. Winston Churchill
1.3. LD-based association mapping
The establishment of the CD/CV hypothesis fuelled the
characterization of human common variation and the patterns of
LD through the HapMap project. These data served to establish
association mapping as the choice method to unravel the genetic
bases of complex disease. The HapMap project, an introduction to
methodology and pitfalls of candidate gene association studies and
the current wave of genome-wide studies are described below.
1.3.1. The HapMap project and the patterns of LD
The primary object behind the HapMap Project was to develop a “haplotype map” of the human genome to study common patterns of human DNA sequence variation (The International HapMap Project 2003). The unravelling of the haplotype structure across populations was aimed to provide the basis for SNP selection in LD-based association studies (de Bakker et al. 2005; The International HapMap Consortium 2005). Four populations were chosen for high density genotyping: 30 parent-offspring trios of Yoruba ancestry (Ibadan, Nigeria); 30 trios of northern and western European ancestry from Utah (USA); 45 unrelated individuals from Tokyo (Japan); and 45 unrelated individuals from Beijing (China). After the second phase, genotype data for >3 million SNPs were characterized in 270 individuals (Frazer et al. 2007; The International HapMap Consortium 2005). The latest release “HapMap III” provided 1.6 million SNPs genotyped in >1,100 individuals from 11 populations.
HapMap data served to develop a catalogue of human common SNP variation and the patterns of correlation among variants. The latter is very relevant to ascertain the tagSNPs that best cover genetic variation within LD blocks (de Bakker et al. 2005).
ascertainment bias in SNP discovery in which rare variants are easily messed and common variants in Europeans are prioritized.
Figure 11. Haploview plot showing the LD relationships of SNPs.
The strength of LD between pairs of SNPs is denoted by colouring, from white (weak) to red (maximum). Two LD blocks are distinguishable (Canzian et al. 2009).
1.3.2. Candidate gene association studies
require pedigree sampling as it can take profit from unrelated individuals gathered from the general population.
[image:44.499.102.399.322.530.2]Associations between alleles and disease arise both when the tested marker is either causal (direct association) or when it is in strong LD with the marker that in turn causes disease (indirect association). In consequence, association studies present two requirements regarding genetic variation. First, prior biological knowledge is necessary to select loci that “make biological sense” (Thomas 2004) and contain clues of participation in disease aetiology (e.g. signals in previous linkage studies). Second, dense spacing of markers is necessary to cover extensively the ascertained candidate loci.
Figure 12. Explosive growth of published genetic association studies.
The availability of SNP markers expedited the publication of candidate gene association studies (HuGE Navigator database (Yu et al. 2008)).
fundamental assumption of this method is that the ascertained individuals must provide unbiased estimates of the true allele frequency of the populations of interest (Clarke et al. 2011). In case-control studies, the penetrance and relative risks are approximated by calculating the strength of association (Odds Ratio) under different models. Conditions that are better approximated as quantitative traits (e.g. high blood pressure for hypertension) are usually assessed through linear regression. Alternative analysis of haplotypic and epistatic effects permit to test more complex patterns of association (Clarke et al. 2011; de Bakker et al. 2005).
1.3.3. Lack of replication of the candidate gene approach
The identification of several associations through candidate gene approaches created great hopes in the community and considerable hype in the media (e.g. CTLA4 and type 1 diabetes, NOS2 and Crohn’s disease or ADAM33 and asthma). However, the non-replication of significant findings has constituted a major challenge of candidate gene studies. A comprehensive review of >600 studies found that only 6 out of 166 putative associations had been consistently replicated (Hirschhorn et al. 2002). Other meta-analysis described large heterogeneity in the reported effect sizes and found clues of publication bias (Ioannidis et al. 2001; Lohmueller et al. 2003).
and sociological reasons has been put forward to explain replication failures (Hirschhorn and Altshuler 2002).
Figure 13. First studies tend to report unsupported strong effect sizes.
Odds Ratio found in first and following studies for 36 associations (Ioannidis et al. 2001). Blue diamonds denote significant discrepancies.
Roeder 1999; Pritchard et al. 2000a; Pritchard et al. 2000b). Statistical errors can also lead to false positives (Risch and Merikangas 1996). The significance level to reject the null hypothesis of no association (usually α=0.05) has to account properly for the number of independent tests (e.g. number of SNPs) to avoid “multiple testing”. Finally, circumstances that enhance the probability of being reported depending on the outcome of the study result in publication bias (Pan et al. 2005). Ironically, an excessive zeal to harden significance thresholds together with the presence of widespread publication bias does not cancel but inflates false positive rates (Ellis 2010; Ioannidis 2005).
True findings can also fail to replicate due to lack of statistical power in replication studies. The typical sample sizes used in candidate-gene association studies (in the hundreds of samples) may not render enough power to statistically distinguish the low effect sizes of variants associated to complex disease (Chanock et al. 2007). Winner’s curse, the inflated effect size typical of discovery studies, can also affect the ability of replication trials by the over-estimation of statistical power.
The plethora of questionable associations could have ruined the prospects of ever discovering the genetic bases of disease. This perspective prompted the constitution of the NCI-NHGRI Working group on replicability (Chanock et al. 2007). Among other criteria, the consensus list included that replication studies should (i) have enough sample size, (ii) test the same phenotype, (iii) use independent samples from the same or similar population, and (iv) find a similar effect using the same genetic model. If associations are true, the combination of results across studies by means of meta-analysis should lead to a better p-value (Chanock et al. 2007).
Interestingly, several meta-analyses of candidate gene associations checked for the role of ethnicity in disease. In general, most risk variants show consistent patterns in their effects in Europeans and East Asians, albeit a few number of associations present significant differences in effect size (Ioannidis et al. 2004). Interestingly, disease-associated variants harbour levels of population differentiation that do not depart from the genomic average, but show substantial variation in allele frequencies that might help accounting for the differences in disease prevalence (Adeyemo and Rotimi 2009; Lohmueller et al. 2006; Myles et al. 2008).
1.3.4. Genome-wide association studies
unravelling of LD patterns allowed, in principle, to capture ~80% of the predicted >10 million common SNPs with a scattered selection of 0.5 to 1 million SNPs (Visscher et al. 2012). Eventually, HapMap permitted the development of commercial genotyping arrays that did capture >95% and 80% of common variation in Eurasian and African populations, respectively (The International HapMap 3 Consortium 2009). Thus, technological development of commercial chips for high-throughput genotyping made it feasible to look for common risk variants by means of genome-wide association studies (GWAS).
The first GWAS were published in 2005 and 2006 (Dewan et al. 2006; Klein et al. 2005). Even if using few markers and samples (~100K SNPs and <200 individuals), both studies managed to find common variants associated to age-related macular degeneration due to their large effect sizes (OR>2). In 2007, the Wellcome Trust Case Control Consortium published a GWAS for 7 different diseases (The Wellcome Trust Case Control Consortium 2007). The WTCCC paper became a landmark due to the large number of samples used, the use of shared control cohorts across disease, the confirmation of the low stratification present in Europeans, the setting of significance thresholds and the replication of previous signals. Dropping costs of commercial arrays helped in the increase of published GWAS (Clarke et al. 2011; Hindorff et al.).
Previously, a few tens of markers and, at most, a few hundreds of individuals were analyzed. In contrast, GWAS studies routinely test millions of markers (after imputation) in thousands of individuals gathered from diverse cohorts. Second, GWAS are said to be “hypothesis-free”: they certainly look for common risk effects, but they do so looking at SNPs scattered across the genome and without any a priori list of candidate loci (Ziegler et al. 2010).
Figure 14. Display of WTCCC genome-wide results for two diseases.
Top: Q-Q plots showing the genome-wide distribution of association statistic (y-axis) and that expected under the null hypothesis (x-axis and grey band). Bottom: Manhattan plots show the –log of p-values for all SNPs sorted by position. CAD shows a clear peak in 9p21 that accounts for the deviation in the Q-Q plot. The differences can be due to quality control problems (e.g. phenotype heterogeneity in bipolar disorder) or, alternatively, point at true differences in genetic architecture.
Manhattan and Q-Q plots (Figure 14). These tools permit to check the presence of genome-wide enrichments of low p-values and of clusters of p-values in regions that merit further interest (towers in Manhattan plots). The adjustment for multiple testing constitutes an important decision in GWAS. The two most used cut-offs are 5x10⁻⁷ (WTCCC) and 5x10⁻⁸ (strict Bonferroni), but there are several
available methods available to select proper significance thresholds (McCarthy et al. 2008; Pe'er et al. 2008).
There is large variation in GWAS design as regards to the methodological approach selected to accumulate enough evidence of association (Skol et al. 2006). One of the most common practices consists in the design of multi-stage GWAS in which the results from the initial genome-wide stage are followed up through the genotyping of a few selected SNPs in a much larger sample of individuals (Visscher et al. 2010; Ziegler et al. 2010). This approach saves costs by the use of lower number of individuals in the initial stage and the enrichment of SNP coverage only in interesting regions. This procedure also permits to estimate the effect size of associated SNPs without the inflation due to the winner’s curse phenomenon (Ziegler et al. 2010).
any cohort of non-European ancestry (Rosenberg et al. 2010). Yet, the bias towards Europeans has relaxed in the very last two years (up to 84 GWAS on East Asians by May 2011 (Fu et al. 2011)).
Figure 15. Evolution of populations studied in published GWAS.
Most GWAS use exclusively individuals of European ancestry, but there is a slight trend over time favouring the study of non-European populations. Numbers within columns indicate the absolute number of GWAS publications per period (Rosenberg et al. 2010).
Crisis? What crisis? The Sun, 10 January 1979, Winter of Discontent
1.4. Beyond GWAS
After “five years of GWAS” (Visscher et al. 2012), geneticists work
on several hundreds of robust associations between variants and
disease. This wealth of data informs about functional aspects of
disease and may have immediate clinical impacts. However, most of
the heritability remains unfound and the degree in which causality
is shared across populations should be illuminated for disease
testing. A discussion of these aspects is presented.
1.4.1. Knowledge gained through GWAS
There are over 2,000 loci robustly associated to disease (Visscher et al. 2012). Interesting facts can be extracted from the analysis of the regions and variants unravelled by GWAS. The number of loci identified for each disease has increased exponentially if compared to associations discovered and replicated through the candidate gene approach (Figure 16). This observation emphasizes the limitations of an approach based on biological candidates compared to the “hypothesis-free” GWAS. There is also variation in the number of loci discovered per disease, but it appears to be correlated with study sample size (Visscher et al. 2012).
understanding has been obtained for a wide range of problems, from specific diseases (e.g. the role of IL23R in ankylosing spondylitis), to shared aetiology across disease (e.g. loci associated to disparate autoimmune diseases) and to new mechanistic connections across disease (e.g. cancer and diabetes). Interestingly, the enrichment of “druggable” hits provides targets for the translational application of GWAS (Collins 2011; Lander 2011).
Figure 16. New disease loci discovered by GWAS for several autoimmune and metabolic conditions (Visscher et al. 2012).
al. 2009). Second, disease-associated SNPs are enriched for eQTLs and clues of pleiotropy have been described (Nicolae et al. 2010; Sivakumaran et al. 2011). Finally, and in spite of contradictory evidence (Lachance 2010), the distribution of allele frequencies of GWAS variants contain an excess of common variants (MAF>20%) when compared to genotyped SNPs. Indeed, these variants explain substantially large proportions of disease risk when compared to SNPs at intermediate frequencies (Park et al. 2011).
After the wave of published GWAS, we have gained strong knowledge on the functional aspects of risk variants and valuable insights into the genetic architecture of disease. However, the disappointingly low amount of explained heritability constitutes the most debated issue in the GWAS era.
1.4.2. “Missing heritability” and alternative models
The integration of statistical power in the distribution of effect sizes from GWAS has allowed estimating the number of discoveries that may be expected in future studies. That is, the number of risk variants that ought to be discovered if the study sample size is known in advance (Lango Allen et al. 2010; Park et al. 2010). This exercise lends support to the hypothesis that a large number of risk variants wait to be discovered (Park et al. 2011; Park et al. 2010).
having studied more than 30,000 people in 2008 account for less than 10% of heritability (Visscher 2008). In spite of the knowledge gained about new disease loci, GWAS results add very little to the prediction power necessary for personalized medicine. This phenomenon was coined as the “case of the missing heritability” (Maher 2008).
[image:58.499.90.405.384.582.2]Several hypotheses have been put forward to explain the missing heritability problem (Eichler et al. 2010; Goldstein 2009; Maher 2008; Manolio et al. 2009). The stringent correction for multiple testing necessary to avoid false positives could swamp the signal of alleles with very small effect sizes. Alternatively, most heritability could be explained by rare variants of large effect that are not captured in commercial genotyping arrays (Figure 17).
Other explanations champion the unexplored role of epistatic interactions (GWAS usually assume additive effects), the hidden effects of gene-by-environment interactions, the responsibility of Copy Number Variants and the presence of parent-of-origin effects (that could explain up to 14% of type 2 diabetes heritability (Eichler et al. 2010)). Inherent phenotypic heterogeneity among patients such as that faced in psychiatric disorders could recipe for GWAS failure (Burmeister et al. 2008; Terwilliger and Weiss 2003). Finally, the possibility that the heritability explained by known variants is much larger after accounting for epistatic interactions has been recently proposed (Zuk et al. 2012). The “infinitesimal model” and the “rare allele model” are the two most cited alternatives to the refuted CD/CV model of heritability (Gibson 2012).
Q-Q plots for most diseases supports the infinitesimal model (Park et al. 2011). The GWAS published by the International Schizophrenia Consortium also supports this model (Purcell et al. 2009) by showing that the relaxation of p-value thresholds to include SNPs increases the predictive ability of individual risk scores to distinguish between cases and controls (Figure 18).
Variance explained (R2)
Schizophrenia Bipolar disorder
Type 1 diabetes
0.01 0.02 0.03
Figure 18. Variance explained in regression of case-control status.
Variance explained by models to distinguish case status in target samples. The scores are build using SNPs associated to schizophrenia with five liberal thresholds (p-vakue<0.1 to p-value<0.5). SNPs discovered for schizophrenia show significant predictive power for case-control status in GWAS of bipolar disorder (Purcell et al. 2009).
and that captured by SNPs from commercial arrays (45%) can be accounted by incomplete LD between genotyped common SNPs and causal variants with lower allele frequency.
The major alternative to the infinitesimal model, the rare allele model, posits that most of the variance for complex disease is due to rare variants (MAF<1%) of large effect. Evolutionary theory predicts that variants that reduce the fitness of individuals are maintained at low-allele frequencies by purifying selection. This model would fit with recent human demographic history. First, the explosive growth in census size has resulted in an excess of rare variants in human genomes (Gravel et al. 2011; Keinan and Clark 2012). Second, the analysis of allele frequency distribution for different classes of variation confirms that purifying selection maintains deleterious alleles at low frequencies (Kryukov et al. 2007) that differ across human populations (Lohmueller et al. 2008).
shown to accumulate in cases of neurological disorders (Levy et al. 2011; Pinto et al. 2010). Moreover, GWAS loci overlap significantly with loci associated to Mendelian disease (Siontis et al. 2010).
Figure 19. The complex frequency spectrum of SNPs for complex traits.
The effect size of height associated SNPs identified in a gene-centric GWAS as a function of Minor allele frequency. The presence of large-effect rare variants and low-large-effect non-significant common alleles is shown. From (Lanktree et al. 2011)
widespread participation of rare variants in extant GWAS results (Anderson et al. 2011; Orozco et al. 2010; Wray et al. 2011).
The prospect that rare variants explain the “missing heritability” was one factor encouraging the 1,000 Genomes Project (sequencing >2,500 individuals from 27 populations). The goal lies in the description of all variation with at least 1% of allele frequency and its sharing across human populations (Gravel et al. 2011).
1.4.3. Disease architecture across populations
The availability of genetic data has shed light on human origins. The out-of-Africa (OOA) model predicts diversity being highest in African populations and structured at increasing distances from Africa (Goldstein and Chikhi 2002). Two early results validated this model; namely (i) the common ancestor of human mtDNA dates at 200 kilo years ago (kya) and locates in Africa and (ii) non-Africans present subsets of African diversity (Cann et al. 1987). Microsatellites and autosomal markers have validated the single origin hypothesis (Li et al. 2008; Rosenberg et al. 2002). Nonetheless, the publication of two extinct hominin genomes confirmed that archaic genes segregate in modern humans (Green et al. 2010; Plagnol and Wall 2006; Reich et al. 2010).
and Pacific archipelagos were colonized around 20 and 4 kya. Recently, most populations have undergone explosive expansions in Neolithic times (Coventry et al. 2010; Keinan and Clark 2012). As a result, humans live in an extraordinary diverse range of habitats and present wide phenotypic and cultural variation.
[image:64.499.86.417.423.518.2]The complex demographic history of human populations has shaped the presence and frequencies of genetic variants. Most common variants predate human expansion across major landmasses and are shared across populations (The International HapMap 3 Consortium 2009). Nonetheless, the effects of genetic drift within each population has created major differences in allele frequencies at common variants (Bamshad et al. 2004). On the other hand, the explosive expansion in census size has resulted in the vast majority of human polymorphism being rare (MAF<0.05) and confined to continental populations (Gravel et al. 2011).
Figure 20. Average genetic distances among several human populations.
Population structure can be studied through the fixation indexes (Wright 1922, 1969). F-statistics describe the departure from expected heterozygosity in panmixia due to inbreeding. The average genetic differentiation shown in the figure was calculated by means of the FST
from the polymorphic sites identified in a survey of 20 autosomal regions (Wall et al. 2008). A null FST indicates there are no differences in allele
The architecture and adaptive significance of several traits such as skin pigmentation and body size are being unravelled. The extent to which demographic and selective events have shaped the frequency and prevalence of causal variants and disease across populations remains unknown.
1.4.4. The prospects for personalized genetic medicine
The hype about the recent publication of the ENCODE results (Bernstein et al. 2012) reveals the need to deepen in our knowledge about genome functional organization. We are in a similar position regarding the knowledge about the functional basis of disease associations. For instance, the biological underpinning of 9p21 alleles to cardiovascular disease and diabetes remains as one of the few functional validations of GWAS (Harismendy et al. 2011).
percentage of detected individuals that will truly develop disease. This proportion sizes the total number of individuals that will benefit from early intervention after diagnosis. Specificity measures the proportion of individuals that are correctly classified as not being at risk to develop the disease. This quantity is of enormous importance as it evaluates the amount of money and personal suffering that is saved through correct ascertainment of those individuals that do not need any clinical intervention (Kraft et al. 2009).
schizophrenia would translate to an AUC of 90% due to its large heritability. Thus, models estimated from genome-wide markers can improve the prediction of phenotypes based on phenotypes of close relatives (Lee et al. 2008). A promising aspect of GWAS results lies in the fact that, even if not causal, associated SNPs can be useful for clinical prediction if correlated with the causative alleles. Nevertheless, caution is needed to transport clinical predictors to other populations because causal markers might not be shared or might present different LD with associated SNPs (Visscher et al. 2011).
The central objective of this work is to push forward our knowledge about the worldwide distribution of genetic variants associated to complex disease. I intend to examine inter-continental patterns of replication to study what they tell us about the underlying genetic architecture of disease.
This work aims to:
1. Describe the patterns of replicability of genetic associations across human populations, for both candidate gene and genome-wide association studies
2. Determine the role of factors such as allele frequency, genetic differentiation, linkage disequilibrium and statistical power in the replication of genetic associations
3. Obtain general inferences about the genetic architecture of complex disease. Specifically:
a. Gain insight about the role of common/rare variants b. Quantify the sharing of risk variants across Eurasians c. Determine the role of synthetic associations in GWAS d. Model the frequency spectrum of variants discovered in
3.1.
Recent human evolution has shaped geographical
differences in susceptibility to disease
Urko M. Marigorta, Oscar Lao, Ferran Casals, Francesc Calafell, Carlos Morcillo-Suárez, Rui Faria, Elena Bosch, François Serra, Jaume Bertranpetit, Hernán Dopazo, Arcadi Navarro
3.2.
High trans-ethnic replicability of GWAS results
implies common causal variants
Urko M. Marigorta and Arcadi Navarro
Title: High Trans-ethnic Replicability of GWAS Results Implies
Common Causal Variants
Running head: GWAS variants are common and shared across Eurasia
Urko M. Marigorta1 and Arcadi Navarro1,2,3, §
1
Institute of Evolutionary Biology (UPF-CSIC), PRBB, Doctor Aiguader
88, 08003, Barcelona, Catalonia, Spain
2
National Institute for Bioinformatics, Universitat Pompeu Fabra,
Barcelona, Spain
3
Institució Catalana de Recerca i Estudis Avançats (ICREA). Barcelona,
Catalonia, Spain
§
corresponding author
Email addresses:
ABSTRACT
Background
Genome-wide association studies (GWAS) have illuminated the biology
of disease. However, they tend to explain small fractions of risk, raising
doubts about issues such as the relative roles of rare versus common
variants in the genetic architecture of complex diseases and how findings
in one population translate to the rest of the world. Light on these
problems can be shed by studying the degree of sharing of
disease-associated variants across populations.
Main Findings
We present a comprehensive survey of GWAS replicability across 28
diseases. Most loci and SNPs discovered in Europeans have been
extensively replicated using peoples of European and East Asian ancestry.
We found a strong and significant correlation of Odds Ratios across
continents, indicating that underlying causal variants are common and
shared between European and East Asian populations. As expected if that
were the case, SNPs discovered in Europeans that failed to replicate in
East Asians map into genomic regions with larger between-population
differences in patterns of Linkage Disequilibrium. Finally, we observed
that GWAS with larger sample sizes have detected variants with weaker
effects rather than with lower frequencies.
Significance
Our results settle the issue of the spurious origin of GWAS associations
and confirm that the vast majority of GWAS results are due to common
variants. In addition, the sharing of disease alleles and the high correlation
in their effect sizes show that the underlying causal variants are shared
associated marker SNPs. Thus, our results indicate that trans-ethnic fine
mapping of causal variants is feasible.
AUTHOR SUMMARY
Describing and identifying the genetic variants that increase risk for
complex diseases remains a central focus of human genetics and is
fundamental for the emergent field of personalized medicine. Over the last
five years, GWAS have revolutionized the field, discovering hundreds of
disease loci. However, with only a handful of exceptions, the causal
variants that generate the associations unveiled by GWAS have not been
identified, and their frequency and degree of sharing across populations
remains unknown. Here, we present the largest and most comprehensive
comparison of GWAS to date. By examining the results of GWAS for 28
diseases that have been performed with peoples of European and East
Asian ancestries, we show that the vast majority of associations are caused
by common variants that are shared between continents and map close to
the associated markers. These results indicate that the major contributors
to disease risk are shared across continents and imply that trans-ethnic
INTRODUCTION
Genome-wide association studies (GWAS) have detected hundreds of risk
alleles [1], generating novel biological knowledge and widening the range
of diagnostic and treatment tools [2]. However, the reported effect sizes of
these variants are small and their impact in individual risk prediction
remains modest, raising doubts about the relevance of GWAS results
[1,3-6]. Some of the most hotly debated topics are how to account for the
unexplained risk [4]; what may be the role of rare variants as producers of
artefactual GWAS results [7-10]; and up to what extent GWAS results are
portable between populations [11-15]. Answering to these questions is
pressing for two reasons. First, the description of the genetic architecture
of disease is crucial for personalized medicine and, in particular, finding
predictors of individual disease risk that could be applicable to different
ancestries would be a major step forward [1]. Second, if sharing across
populations of risk alleles were common, it would confirm trans-ethnic
mapping as a powered tool that would take profit of population
heterogeneity in LD and allele frequencies to identify the causal variants
underlying disease susceptibility [1,15].
The available reports of the distribution of the allele frequencies of
GWAS risk variants point at an excess of common variants [16] that, at
least for some particular diseases [17], present consistent effects across
populations. If repeated, these observations constitute empirical evidence
against rare alleles as a source of synthetic associations and would point at
common variants that are in LD with the associated tagSNPs in all
populations. However, such studies have not been generalized across
different diseases and, currently, most evidence comes from either
re-sequencing efforts aimed to capture rare variants [18] or multi-ethnic
meta-ignored population heterogeneity [2,20] or have focused on a limited set
of traits [21] and GWAS [22].
By compiling data from 275 GWAS for 28 different diseases, we build the
largest-to-date database of discovery and replication patterns of SNPs
associated to complex diseases. We evaluate the extent to which risk
variants discovered in Europeans replicate in posterior studies performed
on individuals of European or East Asian ancestry and compare the risk
effect sizes found in both populations. We also examine the extent up to
which statistical power and differences in Linkage Disequilibrium among
populations explain replication failures. Our results serve to establish the
patterns of replicability of GWAS across diseases and populations to
evaluate how transportable these results are and to study the relative roles
of rare and common variants in explaining current GWAS results.
RESULTS AND DISCUSSION
We started by downloading all the associations in the GWAS Catalog [23]
(last accessed in February 2012, see Materials and Methods), which
represents a total of 7,145 associations with P<10-5 reported in 1,171
papers. We focused on diseases (avoiding quantitative traits, such as
height) with at least two GWAS performed with different ethnic groups.
This renders a final dataset of 275 GWAS papers reporting 413
associations to 28 diseases and including peoples from European and East
Asian ancestry (204 and 71 GWAS, Tables S1 and S2). Out of these, we
ascertained 182 SNPs initially reported as genome-wide significant
(P<5x10⁻⁷) in European GWAS and for which one or more replication
attempts had been performed in subsequent European and/or East Asian
GWAS (177 and 225 attempts, respectively, Tables S3 and S4). We
studied patterns of replication across studies, using the criterion that a
obtain that information we examined every individual paper, since the
GWAS Catalog records only P<10-5.
Replicability rates and sharing across Europeans and East Asians
Replicability rates are high within Europeans, with 150 successful out of
177 attempts (84.6%), when only 8.8 positive replications (~5%) would
be expected under the null hypothesis of no association (binomial test,
P<10-16). This excess was robust to the significance threshold (i.e. 113 observed vs. 0.18 expected for P<0.001 and 51 vs. 1.8x10⁻⁵ for P<10-7,
Table S4). This is expected, since most GWAS already contain an
internal replication phase [1,24]. Interestingly, all diseases presented the
same high replicability patterns, with no traces of heterogeneity in
replicability (Table S5). These results were consistent with previous
partial reports of replication for individual diseases [17,19] and confirmed
that the subset of 182 genome-wide significant SNPs map in loci truly
associated to disease in peoples with European ancestry.
Next, we considered the replication attempts in East Asian populations.
Out of 225 replication attempts, 103 were successful at P<0.05 (45.8%).
This replicability departs from the null expectation (103 vs. 11.3 expected,
P<10-16) and is robust to replication thresholds (i.e. 49 observed vs. 0.23 expected for p-value <0.001 and 19 vs. 2.3x10⁻⁵ for p-value <10-7).
Nevertheless, that figure is smaller than for Europeans, which can be
expected since East Asian GWAS tend to have smaller sample sizes [15].
We tested this hypothesis by focusing in the 81 attempts with ≥80%
power to replicate the Odds Ratio (OR) found in Europeans (Table S4
and Materials and Methods). For that subset, replicability increases
dramatically to 76.5% (62 of 81 attempts at P<0.05). Again, we found no
Trans-ethnic replication indicates that risk loci are shared between
Europeans and East Asians. As to the sharing and frequency of risk
variants themselves, it can be explored even if they remain undiscovered.
First, since most rare variants appeared after the split of Europeans and
East Asians [4,12,25-27], they would have accumulated randomly in the
genealogy of each allele of the marker SNPs used in GWAS. Therefore,
risk alleles would not be necessary shared even if discovered through the
same tagSNP. Strikingly, when considering the direction of effects instead
of their significance, we observed the same risk allele than in Europeans
in 85.9% of East Asian replication attempts (100% and 73.6% of attempts
replicated and not replicated at P<0.05, respectively). This proportion
departs from the 50% expectation in a scenario of independent rare
variants (P<10-16, binomial test). Secondly, the idea that the same causal
variants underlie association in the two continents is reinforced by a
strong correlation between ORs in Europeans and East Asians
(Spearman’s r=0.736, P<10-16, Figure 1). This correlation [28], which also holds even when considering only failed replication attempts in East
Asia (r=0.53, P<6·10-9), is unexpected for population-specific rare causal
variants, as their effect size and Linkage Disequilibrium (LD) with the
associated SNP would be different in each population.
Assessing the potential effect of publication bias
Publication bias could have inflated our replicability estimates [29,30].
Due to the large number of SNPs that are tested in a GWAS, the usual
practice has been to report any new associated SNPs discovered in each
GWAS, plus the replication status of previously associated SNPs.
Therefore, our ability to gather replication attempts depends on how many
of them are explicitly reported, which presents enormous variability
among papers. This opens the possibility of a reporting bias, in which
attempts. If so, our chance of gathering a replication attempt may be
heavily biased towards positive results and might inflate our estimates of
[image:86.499.102.414.146.339.2]replicability [30].
Figure 1. East Asian GWAS find the same risk allele and similar OR than European
discovery GWAS.
Xaxis: ORs for the replication stage of the discovery European GWAS. Yaxis: ORs for
the initial stage of East Asian GWAS (Materials and Methods).Dots in blue indicate significant (P<0.05) replication attempts in East Asia; dots in grey indicate non-significant
replication attempts. (A) Using all replication attempts; (B) Using only the largest
replication attempt per SNP; (C) Using replication attempts with≥80% power to replicate
the OR found in Europeans.
In the most extreme version of this scenario, the 103 replications finding
the same risk allele at P<0.05 in East Asians would be the result of Type I
error with a P=0.05 threshold. In that case, the 103 positive replications
would be just the 2.5% (=5% type I error x 50% probability of the same
risk allele) of a 40 times larger pool of 4,120 replication attempts in East
Asians (95% C.I. =3,418–4,959, assuming a Poisson distribution). In other
To assess the potential size of that bias, we estimated the maximum
number of potentially failed (P>0.05) but unreported replication attempts
[30]. Specifically, and for each GWAS performed in East Asians, we
counted the number of SNPs recorded in our database as previously
discovered in European GWAS, but for which the East Asian GWAS did
not explicitly mention neither a p-value nor any other information (in the
main text or in the supplemental information). In total, the 416 such
instances we found constitute the maximum number of cases of reporting
bias in our database (Table S7). Most of them may not constitute
reporting bias at all, since the SNPs in question may not be included in the
array used for the East Asian GWAS, may be monomorphic in the studied
population, may have been filtered out during QC and so on. Therefore, a
systematic reporting bias cannot account for our results.
Replicability and differences in Linkage Disequilibrium and
Heterozygosity
A clear prediction can be made if, as our results suggest, most associations
reported by GWAS are due to the same common causal variants with
similar effect sizes in the two ancestral groups: LD patterns and levels of
heterozygosity should be more similar between populations in the
genomic regions that contain successfully replicated SNPs than in the
genomic regions with European-associated SNPs that have not reached
significance in East Asians. To test this prediction, we compared the
inter-continental similitude of LD and heterozygosity patterns in genomic
regions harboring two different groups of disease-associated SNPs: the 47
SNPs discovered in Europeans that have been successfully replicated in
every attempt with East Asians and the 65 SNPs that have never been
positively replicated. We used the VarLD score [31] to measure, for each
SNP, between-population LD differences in a 300-SNP region around it.