APÉNDICE D
MICROBIOLOGÍA Y ESEM
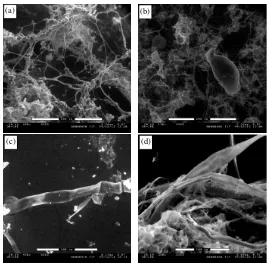
En este apéndice se presentan algunas microfotografías de varias muestras de LM realizadas a una ampliación entre ×100 y ×4000 con un microscopio electrónico de barrido ambiental (environmental scanning electron microscope ESEM) modelo Electroscan 2020, que está instalado en el Departamento de Ciencia de los Materiales e Ingeniería Metalúrgica de la Universitat Politècnica de Catalunya.
Dicho equipo permite el análisis y visualización de muestras húmedas en estado natural o bajo condiciones ambientales controladas (temperatura y humedad relativa), sin la necesidad de usar técnicas convencionales de preparación de muestras (Collins et al., 1993). La fase de vapor con carga (H2O+) que rodea a la muestra actúa como película conductora, con lo que se logra una adecuada visualización mediante el bombardeo de electrones sobre la superficie de dicha muestra.
Las muestras líquidas observadas se instalaron en unos portaobjetos cóncavos que se colocaron dentro de la cámara ambiental del equipo. Dentro de esta cámara se puede controlar la temperatura del portaobjetos entre 5 y 40°C mediante un dispositivo termoeléctrico Peltier. Igualmente se puede controlar la presión de vapor dentro de la cámara entre presiones absolutas que usualmente varían entre 1 torr y 20 torr (1 torr ≈
1.333×10² Pa). Esto permite que la cámara del microscopio pueda ser utilizada para estudiar los cambios que se generan al secar, humedecer, calentar y enfriar la muestra.
Para las observaciones en modo ambiental se utilizó una temperatura variable entre 8 y 9°C y una presión de vapor absoluta entre 4.9 y 5.7 torr, con la finalidad de obtener la mejor resolución de imagen. Las condiciones de presión de vapor y temperatura imponen una humedad relativa dentro de la cámara, cuyo valor se indica en la Figura D.1. Esta humedad relativa hr se define como la relación entre la presión de la cámara uc y la presión de vapor de saturación uco a la misma temperatura (Romero, 1999).
Las primeras observaciones sobre una muestra de LM se realizaron a baja ampliación con la finalidad de detectar los elementos a analizar. Posteriormente, se aumentaba la ampliación y se vigilaba el tiempo de exposición con la finalidad de evitar la desecación del líquido. El tiempo aproximado de observación de cada muestra se limitaba a un máximo de 10 minutos.
Esta técnica permitió observar muestras líquidas y apreciar la estructura de los flóculos en forma tridimensional, así como la estructura externa de la microfauna y los filamentos existente en el líquido de mezcla (Figura D.2 a y b). Sin embargo, la muestra se secaba muy rápido por efecto del vacío, dañando la estructura de la microfauna (Figura D.2 c y d). Para reducir el efecto de la deshidratación de los microorganismos, se probaron distintos fijadores como glutaraldehido + tampón, Bouin (Salvadó, 1990) y paraformaldehido.
paraformaldehido dieron mejores resultados, al no observarse precipitación de cristales y permitir una fijación más clara de los microorganismos (Figura D.3 d).
5 10 15
Temperatura (°C)
0.5 1.0 1.5 2.0
P
res
ió
n
de
v
ap
or, u
c
(kP
a)
presión punto triple
uco : p
resión de va
por de satura
ción (h
r=10
0%)
40%
hr=70 %
[image:2.595.162.421.434.687.2]condiciones ambientales de observación
Figura D.1 Condiciones ambientales de observación de las muestras líquidas a una humedad relativa cercana al 70%.
(b) (a)
(c) (d)
(a )
(b )
(c) (d
[image:3.595.169.442.87.355.2])
Figura D.3 Fotografías en microscopía ambiental (ESEM). (a) Flóculo de estructura abierta con presencia de filamentos, muestra tratada con Bouin; (b), (c) y (d) flóculo compacto con presencia de microfauna (Aspidisca).
(a) (b)
(d) (c)
[image:3.595.170.439.436.703.2](a) (b)
[image:4.595.156.425.107.372.2](c) (d)
Figura D.5 Fotografías en microscopía ambiental (ESEM). (a) y (b) Flóculo de estructura abierta con abundancia de filamentos (días con bulking), (c) y (d) detalle de filamento.
APÉNDICE C
Barajas, M.G., Knobelsdorf, J., Escalas, A. and Mujeriego, R. (2003). Solubilization and Fermentation in a Modified VFA-Potential Method. Environmental Engineering Science, 20, 4, 329-336.
Barajas, M.G., Knobelsdorf, J., Escalas, A. and Mujeriego, R. (2000). Hydrolysis and Fermentation in a Modified VFA-Potential Test. 1st World Water Congress of the International Water Association. Texts of Posters. Paris 2000, 3-7 July 2000.
Solubilization and Fermentation in a Modified
VFA-Potential Method
M.G. Barajas,1 J. Knobelsdorf,1,* A. Escalas,2 and R. Mujeriego1
1Department of Hydraulic, Maritime, and Environmental Engineering,
Universitat Politècnica de Catalunya, Edifici 08034 Barcelona, Spain
2Department of Chemical Engineering,
Universitat Politècnica de Catalunya, 08222 Terrassa, Spain
ABSTRACT
The VFA-potential method is a fermentation technique for estimating the total volatile fatty acids (VFA) availability in wastewater. The VFA-potential was conceived as a measurement of the readily fermentable COD, because fermentation utilizes this COD as a substrate. However, anaerobic hydrolysis can also be a potential source of fermentable matter. In this work, the VFA-potential method has been modified and simplified to avoid nitrogen gas usage. In the modified method, several conventional BOD flasks are com-pletely filled with wastewater and subsequently opened at scheduled times. This procedure keeps oxida-tion-reduction potential (ORP) at very low levels while reducing the laboratory equipment required. COD fractionation of initial wastewater was carried out. Analysis of total suspended solids (TSS), soluble phos-phate, ammonia nitrogen, total and soluble COD, and individual VFA, were obtained throughout the VFA-potential test, to evaluate hydrolysis and fermentation. The mean ratio between VFA-VFA-potential and the ini-tial total COD was 0.23 mg VFA-COD/mg COD. The VFA to phosphate ratio was in the range of 14.6–22 mg VFA-COD/mg P, which is in accordance with recommended value for biological phosphorus removal (20 mg/mg). A strong hydrolysis of solids was detected throughout the evolution TSS and soluble COD. The observed behavior of TSS, soluble COD, and VFA is compatible with a partial utilization of hydro-lyzed COD for fermentation. Phosphorus and nitrogen solubilization are described, as well as pH and al-kalinity behavior, throughout the test.
Key words: volatile fatty acids; VFA potential; acidogenic fermentation; readily biodegradable COD;
COD fractionation.
329
*Corresponding author: Department of Hydraulic, Maritime, and Environmental Engineering, Universitat Politècnica de Catalunya, Campus Nord, Edifici D-1, Jordi Girona 1-3, 08034 Barcelona, Spain. Phone: 34-934-015-952; Fax: 34-934-017-357;
E-mail:j.knobelsdorf@upc.es
INTRODUCTION
D
OLDET AL. (1980) established that the influent waste-water contained two biodegradable COD fractions—biodegrad-able fraction must be broken down, for example, by hy-drolysis of extracellular enzymes, into simpler forms be-fore micro-organisms can utilize it (Henze et al., 1995).
Volatile fatty acids uptake during anaerobic stages has been characterized as a key step in enhanced biological phosphorus removal (EBPR). Low-strength wastewaters are frequently unable to supply enough VFA for anaero-bic phosphorus release. The amount of VFA present in primary settled municipal wastewater is a small fraction of the total COD, approximately 2 to 10%. However, there is at least an additional 10–20% RBCOD that can usually be fermented into VFA and other fermentation products. On the other hand, anaerobic hydrolysis of SBCOD can produce fermentable matter that can be fur-ther fermented to VFA (Henze et al., 1995).
Some parameters—or their ratios to phosphorus—have been used to characterize the suitability of a wastewater for EBPR, namely COD, BOD, RBCOD, and VFA con-centration. A more specific way of measuring the suit-ability of a wastewater for biological phosphorus removal is to apply the VFA-potential method (Lie and Welander, 1997). This is a method for estimating the availability of VFA in a wastewater, including both free VFA and VFA that can be released by fermentation of the readily fer-mentable matter. Slowly biodegradable COD was not considered a source of readily fermentable matter in the VFA-potential method. In this method, a wastewater sample is stored in a sealed bottle for spontaneous fer-mentation by the micro-organisms present in the waste-water.
In the original method, oxygen is previously purged from the wastewater and the headspace of the bottle with nitrogen gas. After sealing with a butyl rubber stopper, wastewater samples are drawn at predetermined times with a syringe through the stopper. Afterwards, the sam-ples are filtered through 0.45-m filters and then kept frozen until VFA analysis.
The effect of several parameters on the VFA-potential test was studied by Martin et al. (2002), including the
ef-fect of sample freezing, inhibitors, stirring, pH alkalin-ity, and temperature. A set of optimized operating con-ditions was proposed in this study. Curto et al. (2002)
compared the VFA potential and the readily biodegrad-able COD as methods for determining the substrate avail-able for enhanced biological phosphorus removal. Also, a clear correlation was found between the VFA potential and the performance of three EBPR treatment plants.
In this work, the original VFA-potential method (Lie and Welander, 1997) has been modified to avoid the need for nitrogen usage. Besides, stirring has been applied to the samples after fermentation, to ensure a homogeneous VFA concentration. COD fractionation has been applied to wastewater before fermentation, to compare VFA
for-mation to initial total COD fractions. The modified method has been applied to an urban wastewater fed to two bench-scale EBPR plants. Evolution of VFA, total and soluble COD, TSS, ORP, as well as the solubiliza-tion of nitrogen and phosphorus, have been studied.
MATERIALS AND METHODS Wastewater sampling and analysis
Daytime composite samples were taken from a nearby street sewer in the residential area around the university laboratory. Samples were analyzed for TSS, volatile sus-pended solids (VSS), total and soluble COD, COD frac-tionation, VFA, VFA-potential, dissolved oxygen (DO), soluble phosphate (PO4-P), ammonia nitrogen, pH, and alkalinity. Standard methods were applied (APHA, 1995), except for VFA determination and COD fraction-ation. These parameters were determined as described be-low.
COD fractionation
Total COD (COD) was determined according to the APHA (1995) standard methods. Total biodegradable COD (TBCOD) was determined by the Park et al. (1997)
procedure. This method is based on the total biodegrad-able oxygen demand, computed from the total biological oxidation of wastewater in a 24-h batch test. The details of the TBCOD procedure and calculation are given in Park et al. (1997).
Readily biodegradable COD (RBCOD) was deter-mined by the Mamais et al. (1993) method. In this
method, a 24-h fill-and-draw biological reactor is fed with the wastewater. Influent and effluent are flocculated with zinc sulphate for determining truly soluble COD (COD-sol). RBCOD is computed as the difference between in-fluent and efin-fluent CODsol.
The total unbiodegradable COD (TUCOD) was com-puted as the difference between COD and TBCOD. Sol-uble unbiodegradable COD (SUCOD) was estimated as the effluent CODsol, as in Mamais et al. (1993). Finally,
particulate unbiodegradable COD (PUCOD) was com-puted as the difference between TUCOD and SUCOD.
VFA potential
of VFA formation. The maximum time considered was 168 h. This technique differs from the original method (Lie and Welander, 1997) in that several flasks are used— instead of one—and that no nitrogen gas is required.
The contents of each flask were stirred, and subse-quently analyzed for soluble COD and VFA. Evolution of TSS and total COD were also determined in one of the VFA-potential tests. A flask was set apart in one of the tests to monitor the ORP (Ag/AgCl). Samples for soluble COD, VFA, soluble phosphate, ammonia nitrogen, pH, and alkalinity were filtered through 0.45-m membrane filters. For VFA determination, filtered samples were kept frozen until analyzed. Volatile fatty acids were analyzed by an external team, using solid-phase microextraction (SPME) and high-resolution gas chromatography coupled with mass spectrometry (HRGC/MS). The method has been described elsewhere (Ábalos et al. 2000).
RESULTS AND DISCUSSION
Tables 1 and 2 display the wastewater parameters de-termined before the VFA-potential test. Figure 1
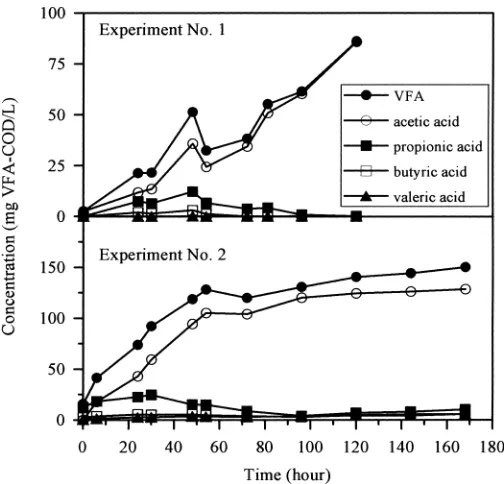
repre-sents the changes of total and soluble COD and VFA throughout experiments No. 1 and No. 2. TSS were also represented for experiment No. 2. In the first experiment, the sample presented a very low initial VFA concentra-tion (2.6 mg VFA-COD/L), as well as a low initial RB-COD (38 mg/L). VFA concentration showed a consistent increase with time—up to 86 mg VFA-COD/L—without reaching a steady value. This means that the maximum time allowed for the test duration should be extended. Soluble COD increased consistently with time, from 92 to 230 mg/L, while particulate COD reduced from 304 to 131 mg/L. This fact indicates that strong anaerobic hy-drolysis occurred under the prevailing conditions during the test, as pointed by Curto et al. (2002). Moreover, VFA
concentration reached a value (86 mg VFA-COD/L) much higher than the initial RBCOD (38 mg/L). This fact can be interpreted as a mismatch between aerobically de-termined RBCOD and anaerobic readily fermentable matter (Lie and Welander, 1997). However, it is also compatible with a partial utilization of hydrolyzed COD as a substrate for fermentation.
Figure 2 shows the evolution of ORP with time in Ex-periment No. 1. Very low ORP potential prevailed
dur-ENVIRON ENG SCI, VOL. 20, NO. 4, 2003
Table 1. Wastewater parameters before the VFA-potential test.
Parameter Experiment No. 1 Experiment No. 2
TSS, mg/L 300 375
VSS, mg/L 270 320
COD, mg/L 396 616
VFA, mg COD/L 2.6 16
DO, mg/L ⬍0.05 ⬍0.05
TKN, mg N/L — 49
NH4-N, mg N/L 26 40
P, mg/L 7.5 9.2
PO4-P, mg/L 5.9 6.8
pH 8.11 8.47
Alkalinity (mg CaCO3/L) 271 388
Table 2. COD fractionation before the VFA-potential test.
Total Biodegradable Unbiodegradable
(mg/L) (mg/L) (mg/L)
COD TBCOD TUCOD RBCOD SBCOD SUCOD PUCOD
Experiment No. 1 396 319 77 38 281 52 25
Experiment No. 2 616 502 114 140 362 60 54
ing test evolution. ORP decreased from ⫹117 to ⫺412 mV in 6 h, and remained well below this value for the rest of the test. This indicates that purging with nitrogen is not required for obtaining appropriate conditions for acido-genic fermentation. If initial DO is low—as it usually is in urban wastewater—and test flasks are completely filled, no oxygen purging is needed. The use of one flask for each sampling time allows for higher volume samples to be used. Because anaerobic conditions do not have to be kept beyond the time scheduled for each flask, flasks can be opened for sampling. Butyl rubber stoppers syringes werenot required. Conventional BOD flasks with ground-glass stoppers can be used.
A second experiment was performed, using another wastewater sample, for a total time of 168 h. TSS and soluble COD curves indicated strong hydrolysis through-out the experiment (Fig. 1). Again, the VFA-potential (150 mg VFA-COD/L) was much higher than the initial VFA concentration. VFA-potential was also greater than in Experiment No. 1. VFA concentration showed a rapid increase during the first 54 h (from 16 to 128 mg VFA-COD/L) and a slower increase for the next 114 h (from 128 to 150 mg VFA-COD/L). The slope change coin-cides with the VFA concentration (128 mg VFA-COD/L) approaching the RBCOD value. This slope change can be interpreted as a decrease in the availability of readily
[image:9.612.185.438.71.328.2]Figure 1. Evolution of COD, VFA, and TSS in both experiments.
fermentable COD. The second slow stage of VFA gen-eration can be interpreted as a slow utilization of the hy-drolyzed COD.
The VFA-potential represents 22% of the initial total COD in the first experiment and 24% in the second ex-periment. These values are comparable to previously re-ported data (Lie and Welander, 1997). On the other hand, the VFA-potential to soluble phosphate ratios were 14.6 and 22 mg VFA-COD/mg soluble P, for the first and sec-ond experiment, respectively. These values are in accor-dance with data reported for an efficient biological phos-phorus removal (20 mg/mg) (Abu-ghararah and Randall, 1991).
Finally, Fig. 3 shows the evolution of specific volatile fatty acids in both VFA-potential tests. Fermentation be-gins immediately and VFA concentration increases in
the first stage of the experiment (approximately during the first 50 h), until reaching a value corresponding to the RBCOD of the wastewater. Afterwards, a momen tary stabilization—or even a small decrease—of the VFA con-centration takes place. This phenomenon can be related to exhaustion of initial RBCOD of waste -water. This can indicate that the initially present RB -COD is first depleted, rather than the COD being solu -bilized throughout the test. After 10 or 20 h, the VFA production—especially acetic acid—starts again, prob -ably at the expense of solubilized COD. In this second stage, VFA production followsa different pattern in
both experiments. In Experiment No. 1, the increase of VFA concentration was quick and basically due to the
presence of acetic acid. In Experiment No. 2, the pro
-duction of acetic acid, as well as of other VFA, was
slow and reached low concentrations. In both experi
-ments, acetic acid was the dominant fermentation prod
-uct. Nevertheless, significant quantities of VFA were
produced in the first stages which were later consumed.
In conclusion, the levels of VFA achieved by the mod-ified method in both VFA-potential tests (86 and 150 mg VFA-COD/L) indicate that the wastewater analyzed had a potential of VFA production by fermentation of both the RBCOD and a fraction of the SBCOD.
Figure 4 shows the PO4-P and NH4-N evolution throughout both experiments. Some nitrogen and phos-phorus solubilization occurred in both VFA-potential tests. Maximum solubilization for both parameters was observed in the sample with the highest TSS. Table 3 shows the solubilization of phosphate and ammonia ni-trogen associated with influent COD and VFA produc-tion. The difference between final and initial PO4-P con-centration was small (1.3 mg/L in average), so its statistical significance was studied. In Fig. 4, the PO4-P
change with time is a steadily growing function, which
can be fairly approximated by a line. The slope of re-gression line is an indicator of the PO4-P solubization trend throughout the test. In Experiment No. 1, the slope of the regression line was 0.19 mg/(L.d), with a 95% confidence interval of 0.13–0.25 mg/(L⭈day). In
Experi-ment No. 2, the slope was 0.21 mg/(L⭈day) with a 95%
confidence interval of 0.17–0.25 mg/(L⭈day). In both
cases, the 95% confidence interval was far from zero,
[image:10.612.175.427.72.314.2]in-ENVIRON ENG SCI, VOL. 20, NO. 4, 2003
dicating a significant PO4-P growing trend, at the 0.05 significance level.
The mean ratio between phosphate released and COD was 2.6 mg PO4-P/g COD. The amount of phosphate re-leased in both experiments, in terms of the amount of VFA produced, was 12.0 mg PO4-P/g VFA-COD on av-erage. This solubilization can be attributed to the reduc-tion of ferric phosphate (insoluble) to ferrous sulphate (soluble), under the reducing conditions of the test, as stated by Christensson (1997) on PO4-P solubilization in prefermenters. Hydrolysis of polyphosphates from deter-gent formulations could also occur during the test.
For the N solubilization (2.6 mg/L in average), the slopes were 0.37 mg/(L⭈day), with a 95% confidence in-terval of 0.22–0.53 mg/(L⭈day), and 0.21 mg/(L⭈day) with a 95% confidence interval of 0.17–0.24 mg/(L⭈day). These 95% confidence intervals do not embrace zero,
in-dicating a significant N solubilization trend at the 0.05 significance level. The ratios of ammonia nitrogen to ini-tial COD were similar in both experiments. Regarding the VFA-potential, the mean ratio was 23.5 mg NH4-N/g VFA-COD. As observed, nitrogen solubilization was higher than phosphorus solubilization in both experi-ments. This has been reported in other investigations as-sociated with primary sludge fermentation, and is attrib-uted to particulate nitrogenous materials (nitrogenated COD) that are easily biodegraded during the acidogenic phase of anaerobic fermentation (Eastman and Ferguson,
1981).
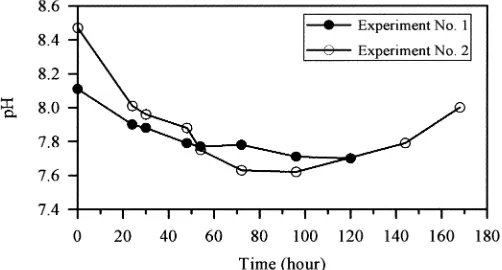
The change of pH for both VFA-potential tests is
shown in Fig. 5. In these tests, pH decreased in the ini-tial stages, associated with a greater VFA production. Several authors have reported the influence of VFA pro-duction on pH (Eastman and Ferguson, 1981,
Christens-Table 3. Solubilization of phosphate and ammonia nitrogen observed in each experiment.
Parameter Experiment No. 1 Experiment No. 2
Increase in phosphate (mg P/L) 1.0 1.6
Phosphate/initial COD (mg P/g COD) 2.5 2.6
Phosphate/VFA produced (mg P/g VFA-COD) 12 12
Increase in ammonium (mg NH4-N/L) 2.0 3.1
NH4-N/initial COD (mg NH4-N/g COD) 5.1 5.0
NH4-N/VFA produced (mg NH4-N/g VFA-COD) 24 23
[image:11.612.185.445.70.313.2]son, 1997, Lie and Welander, 1997). These authors as-sociate the decrease of pH with a production of VFA. The behavior of pH in the second stage of the tests was different. In Experiment No. 2, which presented a very low production of VFA during the second stage, pH re-covered considerably. This can be attributed to an
in-crease of alkalinity, without a parallel production of VFA.
In Experiment No. 1, which showed an appreciable
pro-duction of VFA during the second stage, pH did not
re-covered, and continued decreasing duringthis stage. Despite the variations in the reported pH values, the wastewater tested showed a remarkable buffering capac
-ity, because pH remained within the range 7.5–8.6. This
can be attributed to the considerable alkalinity of the
wastewater and its parallel production. This is in accor
-dance with the Martin et al. (2002) study, where waste
-water showed a self-regulating capacity and pH regula
-tion at 6.5 or 7.5 did not affected the test.
Alkalinity consistently increased throughout both periments. The increase was higher during the second ex-periment (31%), while the first exex-periment only showed an 18% increase. The evolution of alkalinity in potential tests can be associated with mechanisms like ammonifi-cation of organic nitrogen, which causes an alkalinity pro-duction at a ratio of 3.57 mg CaCO3/mg N (Araújo et al.,
1998). Another mechanism for alkalinity increase can be the production of bicarbonate from evolved CO2 react-ing with calcium carbonate of the sample (Wetzel, 1983).
CONCLUSIONS
The original method (Lie and Welander, 1997) for measuring VFA-potential has been modified and simpli-fied, eliminating the need for nitrogen gas. The modified
method allows for strong anaerobic conditions to take place while simplifies the laboratory equipment required. Because anaerobic conditions do not have to be kept be-yond the time scheduled for sampling, flasks can be opened for sampling. Greater volumes can easily be taken for analysis, because no syringes have to be used for sam-pling through a rubber stopper. The modified method has provided an estimation of the VFA availability for EBPR. The ratios obtained, using the modified method, between VFA-potential and the concentrations of COD and solu-ble phosphate were 0.22–0.24 mg VFA-COD/mg COD, and 14.6–22 mg VFA-COD/mg PO4-P, respectively. These values are comparable to those obtained in other wastewaters by the original method. A strong anaerobic hydrolysis was detected throughout the VFA-potential test, as a function of TSS and soluble COD. The VFA-potential was higher than the initial RBCOD, which is compatible with a partial utilization of hydrolyzed COD as a substrate for fermentation. Analysis of TSS and COD fractionation in the VFA-potential test can help in eval-uating the contribution of both RBCOD and SBCOD to VFA formation. In both VFA-potential tests, the solubi-lization of phosphorus and nitrogen was observed. Both parameters increased gradually with time. Likewise, pH decreased in the stages with a strong liberation of VFA, while it remained constant or even increased when the liberation of VFA decreased or stopped. Alkalinity in-creased throughout the two experiments. More experi-mentation is required to achieve definitive conclusions.
ACKNOWLEDGMENT
This research was possible thanks to funding from the spanish Instituto de Cooperación Iberoamericana (ICI)
[image:12.612.176.427.83.218.2]ENVIRON ENG SCI, VOL. 20, NO. 4, 2003
and the Mexican Consejo Nacional de Ciencia y Tec-nología (CONACYT).
REFERENCES
ABALOS, M., BAYONA, J.M., and PAWLISZYN, J. (2000). Development of a headspace solid-phase microextraction procedure for the determination of free volatile fatty acids in waste waters. J. Chromatogr. A.873,107–115.
ABU-GHARARAH, Z.H., and RANDELL, C.W. (1991). The effect of organic compounds on biological phosphorus re-moval. Water Sci. Technol. 23,585–594.
APHA-AWWA-WPCF (1995). Standard Methods for the Ex-amination of Water and Wastewater, 19th ed. Washington, DC: American Public Health Association.
ARAÚJO, L.S, CATUNDA, P.F.C., and VAN HAANDEL, A.C. (1998). Biological sludge stabilisation Part 2: Influence of the composition of waste activated sludge on anaerobic stabilisation. Water SA24,231–236.
CHRISTENSSON, M. (1997). Enhanced biological phospho-rus removal. Carbon source, nitrate as electron acceptor, and characterisation of the sludge community. Ph.D. Thesis, De-partment of Biotechnology, Lund University, Sweden. CURTO, P.R., PEARCE, P., and PARSON, S.A. (2002).
De-termining the potential for enhanced phosphorus removal based on wastewater characteristics. 75th annual conference WEFTEC’02, Municipal Wastewater Treatment Process Symposium: Biological phosphorus removal, October 2, Chicago.
DOLD, P.L., EKAMA, G.A. and MARAIS, G.v.R. (1980). A general model for the activated sludge process. Prog. Water Technol. 12,47–77.
EASTMAN, J.A., and FERGUSON, J.F. (1981). Solubilization of particulate organic carbon during the acid phase of anaer-obic digestion. J. Water Pollut. Control Fed. 53,352–366. HENZE, M., GUJER, W., MINO, T., MATSUO, T., WENTZEL, M.C., and MARAIS, G.v.R. (1995). Activated Sludge Model No. 2. Scientific and Technical Report No. 3. London: IAWQ,
LIE, E., and WELANDER, T. (1997). A method for determi-nation of the readily fermentable organic fraction in munic-ipal wastewater. Water Res. 31,1269–1274.
MAMAIS, D., JENKINS, D., and PITT, P. (1993). A rapid physical-chemical method for the determination of readily biodegradable soluble COD in municipal wastewater. Water Res.27,195–197.
MARTIN RUEL, S., COMEAU, Y., HÉDUIT, A., DERONZIER, G., GINESTET, P., and AUDIC, J.M. (2002). Operating conditions for the determination of the biochemi-cal acidogenic potential of wastewater. Water Res. 36, 2337–2341.
PARK, J.K., WANG, J. and NOVOTNY, G. (1997). Waste-water characterisation for evaluation of biological phospho-rus removal. WDNR Research Report 174, Wisconsin Dept. of Natural Resources, Wisconsin–Madison, (http://www.dnr. state.wi.us/org/water/wm/ww/biophos/abstract.htm).
A. Escalas (**) R. Mujeriego (*)
* Department of Hydraulic, Maritime, and Environmental Engineering, Universitat
Politecnica de Catalunya, Campus Nord, Edifici D-1, Gran Capita s/n, 08034 Barcelona, Spain. ** Department of Chemical Engineering, Universitat Politecnica de Catalunya, Colom 1, 08222 Terrassa, Spain.
Table of contents: ABSTRACT KEYWORDS INTRODUCTION
MATERIALS AND METHODS RESULTS AND DISCUSSION CONCLUSIONS
AKNOWLEDGEMENT REFERENCES
ABSTRACT
The VFA-potential test is a fermentation technique for estimating the total VFA availability in wastewater. This test is applicable for evaluating the maximum anaerobic VFA-uptake in enhanced biological phosphorus removal. The VFA-potential was conceived as a measurement of the readily-fermentable COD, since fermentation utilises readily-readily-fermentable COD as substrate. However, anaerobic hydrolysis can be a potential source of fermentable matter. In this work, the VFA-potential test has been modified and applied to municipal wastewater samples. The VFA-potential test has been simplified in order to avoid nitrogen gas usage. COD fractionation of initial wastewater, and analysis of total suspended solids, total and soluble COD, and individual VFA have been applied throughout the VFA-test, in order to evaluate hydrolysis and fermentation. A strong hydrolysis of solids has been detected through the evolution of total suspended solids and soluble COD. The behaviour of total suspended solids, soluble COD, and VFA is compatible with a partial utilisation of hydrolysed COD, though more experimentation is required for definitive conclusions.
KEYWORDS
COD fractionation; enhanced biological phosphorus removal; fermentation; readily biodegradable; VFA potential; Volatile fatty acids.
INTRODUCTION
Volatile fatty acid (VFA) uptake during anaerobic stages has been characterised as a key step in enhanced biological phosphorus removal (EBPR). Moreover, the availability of VFA to phosphorus-accumulating organisms (PAO) has proved to be a determining factor in anaerobic phosphorus release. In a full-scale plant VFAs are expected to be supplied by influent wastewater, since external VFA addition is usually avoided. Low-strength wastewaters are usually unable to supply enough VFA for anaerobic phosphorus release. Some parameters −or their ratios to phosphorus− have been used to characterise the suitability of a wastewater for EBPR, namely: chemical oxygen demand (COD), biochemical oxygen demand (BOD), readily biodegradable COD (RBCOD), VFA concentration, and VFA potential.
Fermentable matter can be converted to VFA in anaerobic stages. According to Activated Sludge Model No. 2 (Henze et al., 1991), anaerobic hydrolysis of particulate, slowly-biodegradable COD can produce fermentable matter, that can be further fermented to VFAs. The contribution of this reaction pathway to VFA formation is still under discussion (Ekama and Wentzel, 1999).
Oxygen is previously purged from the wastewater and the headspace of the bottle, with nitrogen gas. After sealing with a butyl-rubber stopper, wastewater samples are drawn at predetermined times with a syringe through the stopper. Then the samples are filtered through 0.45 µm filters, and kept frozen until VFA analysis.
In this work, the original VFA potential method (Lie and Welander, 1997) has been modified in order to avoid the need for nitrogen usage. Stirring has been applied to the samples after fermentation, in order to ensure a homogeneous VFA concentration. COD fractionation has been applied to wastewater before fermentation, in order to compare VFA formation to initial COD fractions. The modified method has been applied to a urban wastewater fed to two bench-scale EBPR plants. Evolution of VFA, total and soluble COD, total suspended solids (TSS), and oxidation-reduction potential (ORP) has been studied.
MATERIALS AND METHODS
Wastewater sampling and previous analysis
Daytime composite samples were taken from a nearby street sewer in the residential area around the university laboratory. Samples were analysed for TSS, volatile suspended solids (VSS), COD, VFA, dissolved oxygen (DO), pH, alkalinity, COD fractionation, and VFA potential. Wastewater COD fractionation was determined according to the method by Park et al. (1997). In this method, readily-biodegradable COD is determined according to Mamais et al. (1993).
VFA potential
For each determination, nine to eleven 300-ml BOD glass flasks were completely filled with a given wastewater. The flasks were capped with ground-glass stoppers, avoiding bubble formation, and stored in darkness at 20ºC for fermentation. No stirring was applied during fermentation. The flasks were successively opened for analysis at predetermined times, in order to observe the kinetics of VFA formation. The maximum time considered was 168 hours. This technique differs from the original method (Lie and Welander, 1997) in that several flasks are used −instead of one− and that no nitrogen gas is required.
The contents of each flask were stirred, and subsequently analysed for soluble COD, and VFA. TSS, and total COD were also determined in one of the VFA-potential tests. A flask was set apart in one of the tests in order to monitor the ORP. Samples for soluble COD, VFA, pH, and alkalinity were filtered through 0.45 µm membrane filters. Filtered samples for VFA analysis were kept frozen until analysed. Volatile fatty acids were analysed by an external team, using solid-phase microextraction (SPME) and high-resolution gas chromatography coupled with mass spectrometry (HRGC/MS). The method has been described elsewhere (Abalos et al.).
RESULTS AND DISCUSSION
Table 1. Wastewater parameters before the VFA test TSS
[mg/l]
VSS [mg/l]
COD [mg/l]
VFA [mg COD/l]
DO [mg/l]
pH Alkalinity [mg CaCO3/l]
Sample no. 1 300 270 396 2.6 < 0.05 8.11 271
Sample no. 2 375 320 616 16 < 0.05 8.47 388
Table 2. COD fractionation before the VFA test
Total biodegradable and unbiodegradable
Biodegradable Unbiodegradable
TCOD [mg/l]
TBCOD [mg/l]
TUCOD [mg/l]
RBCOD [mg/l]
SBCOD [mg/l]
USCOD [mg/l]
UPCOD [mg/l]
Sample no. 1 396 319 77 38 281 52 25
Sample no. 2 616 502 114 140 362 60 54
TCOD: total COD SBCOD: particulate slowly biodegradable COD TBCOD: total biodegradable COD USCOD: unbiodegradable soluble COD TUCOD: total unbiodegradable COD UPCOD: unbiodegradable particulate COD RBCOD: soluble readily biodegradable COD
Figure 2 shows the evolution of ORP with time. Very low ORP potential prevailed during most of the test. ORP fell from +117 to –412 mV in six hours, and remained well below this value for the rest of the test. This confirms that purging with nitrogen is not required if initial DO is low and no headspace is allowed in the flask. A second test was run, using another wastewater sample (Figure 3), for a total time of 168 h. TSS were determined throughout the test. Figure 3 shows the evolution of total and soluble COD, TSS, and VFA for this sample. The VFA potential (150 mg/l) was, again, much higher than the initial VFA concentration. VFA potential was also greater than in test No. 1. TSS and soluble COD curves indicate strong hydrolysis throughout the test. VFA concentration shows a rapid growth during the first 54 hours (from 16 to 128 mg COD/l) and a slower growth for the next 114 hours (from 128 to 150 mg COD/l). The slope change coincides with the VFA concentration (128 mg/L) approaching the RBCOD (140 mg/l). This change in the slope can be interpreted as a decrease in the availability of readily fermentable COD. The second, slow stage of VFA generation can be interpreted as a slow utilisation of the hydrolysed COD. Figure 4 shows the evolution of specific volatile fatty
0 50 100 150 200 250 300 350 400 450
0 20 40 60 80 100 120 140 Time (h)
mg COD/l
Total COD Soluble COD VFA
-600 -400 -200 0 200
0 20 40 60 80 100 120 140 Time (h)
ORP (mV)
the end of the test. At that point, VFA concentration is greater than initial RBCOD, which would indicate a utilisation of soluble COD from anaerobic hydrolysis.
CONCLUSIONS
The Lie and Welander (1997) method for VFA-potential has been simplified, eliminating the need for nitrogen gas. The modified test has provided an estimation of the VFA availability for EBPR. A strong anaerobic hydrolysis has been detected throughout the VFA-potential test, through the evolution of TSS and soluble COD. The VFA potential has been greater than initial RBCOD, which is compatible with a partial utilisation of hydrolysed COD as a substrate for fermentation. Analysis of TSS and COD-fractionation in the VFA-potential test can help in evaluating the contribution of both RBCOD and SBCOD to VFA formation. More experimentation is required to achieve definitive conclusions.
AKNOWLEDGEMENT
This research was possible thanks to funding from the spanish Instituto de Cooperacion Iberoamericana (ICI) and the mexican Consejo Nacional de Ciencia y Tecnologia (CONACYT).
REFERENCES
Abalos, M., Pawliszyn, J., and J.M. Bayona. Development of a Headspace Solid-Phase Microextraction Procedure for the Determination of Free Volatile Fatty Acids in Wastewaters. Journal of Chromatography (A), in press.
Ekama, G.A. and Mark C. Wentzel (1999). Difficulties and developments in biological nutrient removal technology and modelling. Wat. Sci. Tech.39(6), 1-11.
Henze, M, Gujer, W., Mino, T., Matsuo, T., Wentzel, M.C., and Marais, G. v. R. (1991). Activated Sludge Model No. 2, IAWQ Scientific and Technical Report No. 3, IAWQ, London. 32 pp. Mamais, D., Jenkins, D., and P. Pitt (1993). A rapid physical-chemical method for the determination
of readily biodegradable soluble COD in municipal wastewater. Wat. Res., 27(1) 195-197. Lie, E. And Welander, T. (1997). A Method for Determination of the Readily Fermentable Organic
Fraction in Municipal Wastewater. Wat. Res., 31(6), 1269-1274.
Park, J.K., Wang, J., and Novotny, G. (1997). Wastewater characterization for evaluation of biological phosphorus removal. Wisconsin Department of Natural Resources. Research Report 174. 29 pp.
Figure 4. Specific VFA in test No. 2.
0 20 40 60 80 100 120 140 160
0 50 100 150 200
Time (h)
VFA (mg COD/l)
VFA Acetic Propionic Butyric Valeric
0 100 200 300 400 500 600 700
0 50 100 150 200
Time (h)
mg COD/l
Total COD Sol. COD VFA TSS
Lie and Welander (1997) developed the VFA-potential method, a fermentation technique for estimating the total maximun amount of volatile fatty acids (VFA) that can be available for the bio-P bacteria in the anaerobic stage of an enhanced biological phosphorus removal process. In this work, the original method has been modified in order to avoid nitrogen usage, and applied to urban wastewater. TSS and soluble COD evolution has indicated a strong hydrolisis throughout the test. VFA potential has been greater than initial readily biodegradable COD (RBCOD). This can be interpreted as a mismatch between aerobically determined RBCOD and anaerobic readily-fermentable matter, as pointed by Lie and Welander (1997). However, it is also compatible with a partial utilisation of hydrolysed COD as a substrate for fermentation.
Wastewater parameters
Determined before the VFA-potential test. The samples show different compositions.
SBCOD: particulate slowly biodegradable COD
Total and soluble COD, and VFA throughout test N° 1. VFA concentration consistently increased without reaching a steady valve.
Oxidation-reduction potencial (ORP). Very low ORP prevailed. Purging with nitrogen is not required.
Total and soluble COD, TSS and VFA throughout test N° 2. TSS and soluble COD indicate strong hydrolysis.
Evolution of specific volatile fatty acids during test N° 2.
TSS [mg/l] TCOD [mg/l] VFA [mgCOD/l] RBCOD [mg/l] SBCOD [mg/]
Sample Nº 1 300 396 2.6 38 281
Sample Nº 2 375 616 16 140 362
in a Modified VFA-Potential Test
M.G. Barajas*, J. Knobelsdorf*, A. Escalas**, and R. Mujeriego*
* Department of Hydraulic, Maritime, and Environmental Engineering, Universitat Politecnica de Catalunya, Campus Nord, Edifici D-1, Gran Capita s/n, 08034 Barcelona, Spain
** Dep. of Chem. Engineering, Univ. Politecnica de Catalunya, Colom 1, 08222 Terrassa, Spain
0 20 40 60 80 100 120 140
Time, h
0 100 200 300 400 500
mg COD/l
Total COD Soluble COD VFA
0 50 100 150 200
Time, h
0 20 40 60 80 100 120 140 160
VFA,
mg COD/
l
Acetic Propionic Butyric Valeric VFA
0 50 100 150 200
Time, h
0 100 200 300 400 500 600 700
mg/l
Total COD Soluble COD VFA TSS
0 20 40 60 80 100 120 140
Time, h
-600 -400 -200 0 200
APÉNDICE B
HIDRÁULICA DEL REACTOR DE MEZCLA COMPLETA
B.1 REACTOR DE MEZCLA COMPLETA (flujo no ideal)
El modelo de flujo en un reactor real se encuentra en algún punto entre las condiciones de mezcla de los reactores ideales (reactor de mezcla completa (RMC) y reactor de flujo en pistón (RFP)). Las variaciones del comportamiento hidráulico de un reactor respecto al modelo de mezcla ideal pueden ser evaluadas experimentalmente, pero a menudo su correcta interpretación matemática no es posible. Uno de los modelos que describen las desviaciones del flujo ideal es el RMC en serie. Este implica la hipótesis de que el volumen del reactor puede ser representado por un conjunto de n RMC de igual tamaño conectados en serie. El estudio del comportamiento de flujo se realiza mediante un ensayo de trazador; las curvas de salida del trazador que resultan de un conjunto de n tanques en serie pueden ser determinadas mediante un balance de masa de la concentración del trazador alrededor del nvo tanque (Horan, 1993):
volumen total = V volumen de cada tanque = Vn
1 2 3 4 n-1 n
C1 C2 C3 C4 Cn-2 Cn-1 Cn
Asumiendo que el trazador es inerte y que no reacciona en el tanque:
-1
Tasa de variación
Cantidad de trazador Cantidad de trazador de la cantidad de
que entra en el reactor que sale del reactor trazador en el reactor
V
ndC
nQ C
nQ C
ndt
⎡
⎤ ⎡
⎤ ⎡
⎤
=
−
⎢
⎥ ⎢
⎥ ⎢
⎥
⎣
⎦ ⎣
⎦
⎢
⎥
⎣
⎦
=
⋅
−
⋅
donde,
n
dC
dt
= tasa de variación del trazador en el reactor-1 n
C = concentración del trazador en el flujo entrante
n
C = concentración del trazador en el flujo saliente
Entonces, para el tanque n de volumen V:
-1
V
-nn n
dC
Q C
Q C
n dt
= ⋅
⋅
(B.1)Esta ecuación tiene una solución general para n tanques iguales conectados en serie (Orhon y Artan, 1994):
1 θ t
o
C
Q
C
(
)
siendo =
C
( - 1)!
V
n n
n
n
e
t
n
− −
=
=
θ
θ
(B.2)La Figura B.1 muestra una familia de curvas C teóricas para diferentes valores de n.
0.0
0.5
1.0
1.5
2.0
θ
= Q
V
t
.
0.0
0.2
0.4
0.6
0.8
1.0
1.2
1.4
1.6
1.8
2.0
C/Co
n = 10
n = 5 n = 1
n = 2
[image:20.595.116.464.307.656.2]n =
Figura B.1 Familia de curvas C para RMC de igual tamaño conectados en serie (Orhon y Artan, 1994).
tanque, teniendo en cuenta la fracción de volumen por tanque. Para el caso de nuestra planta piloto, el balance de materia es el siguiente:
C1 C2 C3
V1 V2 V3
C1 C2 C3
Q Q
Tanque 1: balance de masa para el trazador en el primer tanque
1
1 o 1 o
V
dC
Q C Q C
-
para t= 0
C
0
dt
= ⋅
⋅
→
=
(B.3)1
1 1
Q Q
V V
1 1 1
1 1
Q V o
C t t t
o o
C o
dC dt C e C e
C C C
− −
= − → = → =
∫
∫
(B.4)Tanque 2: balance de masa para el trazador en el segundo tanque
2
2 1 2
V
dC
Q C Q C
-dt
= ⋅
⋅
(B.5)sustituyendo el valor de C1 del primer reactor:
1 Q V 2
2 o
2 2
Q Q
V V
t
dC C C e dt
−
+ = ⋅ (B.6)
resolviendo la ecuación diferencial como una ecuación de tipo dy dx yP x+ ( )=Q x( ) se llega a una solución de tipo ye∫P x dx( ) =
∫
Q( )x e∫P x dx( ) dx k+ , es decir:2 1 2
Q Q Q
V V V
2 o
2
Q V
t t t t
o
C e⋅ =
∫
C e⋅ − ⋅e dt k+ (B.7)siendo k una constante y V1 = V2 , se tiene que para t = 0, C2 = 0 y k = 0, así:
2 2
Q Q
V 2 V
2 o
2 2
Q Q
V V
t t
o
C
C e C t t e C
−
Tanque 3: balance de masa para el trazador en el tercer tanque
3
3 2 3
V
dC
Q C Q C
-dt
= ⋅
⋅
(B.9)sustituyendo el valor de C2:
2 Q 2 V 3 3 o
3 2 3
Q Q
V V V
t
dC
C C t e dt
−
+ = ⋅ ⋅
⋅ (B.10)
resolviendo la ecuación diferencial como una ecuación de tipo dy dx yP x+ ( )=Q x( ):
3 2 3 1 1 Q 2 Q V V V 3 o 2 3
Q
V V
t t t oC e
C
t e
dt k
⎛ − ⎞ ⎜ ⎟ ⎝ ⎠
⋅
=
⋅
+
⋅
∫
(B.11)dado que V2 es diferente de V3, la solución a la ecuación B.11 no es directa, por lo que se
aplica el programa Maple7 para resolver la integral, resultando:
2 3
2 3 3 2
3 2
3 2
Q( V - V )
Q( V - V ) V V
V V
2 2 2 3
3 2 3 2 1 1 Q V V 2 2 2 3
Q(V - V )
v v V V ( ) t t t t o
t e e
t e dt
Q V V
⎛ ⎞ ⎜ ⋅ ⎟ ⎛ ⎞ ⎝ ⎠ ⎜ ⋅ ⎟ ⎝ ⎠ ⎛ − ⎞ ⎜ ⎟ ⎝ ⎠ ⎡ ⎤ ⎢ ⎥ ⋅ ⎢ − ⎥ ⋅ ⎢ ⎥ ⎣ ⎦ ⋅ = −
∫
(B.12)sustituyendo en la Ecuación B.11 y reagrupando términos, la ecuación resultante para el caso de tres RMC diferentes conectados en serie es:
3 3 2 Q 1 1 V Q V V 3 2
o 3 2
2 3
3 2
1
1
1
Q
1
V
V
1
1
V V
V
V
t tC
e
e
t
C
− ⎛ ⎞ − ⎜ ⎟ ⎝ ⎠⎡
⎛
⎛
⎞
⎞
⎤
⎢
⎥
=
+
⎜
⎜
⎜
−
⎟
−
⎟
⎟
⎢
⎥
⎛
⎞
⎣
⎝
⎝
⎠
⎠
⎦
⋅
⎜
−
⎟
⎝
⎠
(B.13)0.0
0.2
0.4
0.6
0.8
1.0
C/Co
0
0.5
1
1.5
2
Tiempo, h
Reactor completo
[image:23.595.153.458.119.353.2]teórico práctico
Figura B.2 Curvas teórico y práctica para el RMC diseñado con tres tanques de volumen diferente conectados en serie.
Figura B.3 Serie fotográfica de la inyección de un trazador. (a) reactor anaerobio, (b) reactor aerobio.
a
[image:23.595.108.500.429.683.2]APÉNDICE A
CALIBRACIÓN DE LAS BOMBAS PERISTÁLTICAS
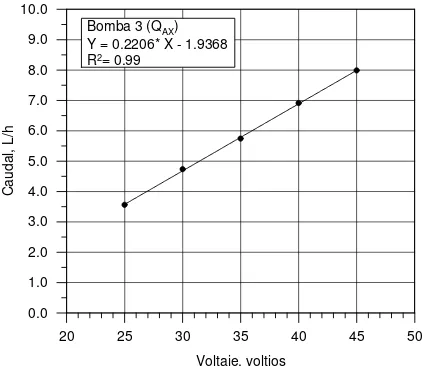
El bombeo del afluente, así como el de las distintas recirculaciones, se realizó mediante cuatro bombas peristálticas tipo L/S Quick Load de la marca Masterflex (modelo 7021-20) con capacidad de giro entre 10 y 120 rpm, que empleaban tuberías de silicona de 5 mm de diámetro interior conectadas a otras de 8 mm que conducían el agua hasta los distintos tanques. La tubería de silicona se eligió por su flexibilidad y resistencia al ambiente agresivo del agua residual, así como por su escasa obturación. Dada la imprecisión del mecanismo regulador de caudal (numeración de 0 a 10) fue necesario calibrar las bombas, determinando los caudales en función de un parámetro fácilmente medible (voltaje (Vcc)). Se construyó un voltímetro que se conectó a la alimentación de las bombas, a fin de medir el voltaje del motor de la bomba en cada punto de la escala, estableciéndose para cada una de ellas una recta de regresión de los caudales en función del voltaje. Esta recta debía ser ajustada siempre que se cambiaban las tuberías. A continuación se presentan las rectas de calibración para cada bomba empleada.
20 25 30 35 40 45 50
Voltaje, voltios 0.0
1.0 2.0 3.0 4.0 5.0 6.0 7.0 8.0 9.0 10.0
Ca
udal, L/h
Bomba 1 (QA) Y = 0.2179 * X - 1.8077 R2= 0.99
20 25 30 35 40 45 50 Voltaje, voltios
0.0 1.0 2.0 3.0 4.0 5.0 6.0 7.0 8.0 9.0 10.0
Caud
al, L/h
Bomba 2 (QAE) Y = 0.2020 * X - 1.4426 R2= 0.99
Figura A.2 Calibración bomba 2 (QAE).
20 25 30 35 40 45 50
Voltaje, voltios 0.0
1.0 2.0 3.0 4.0 5.0 6.0 7.0 8.0 9.0 10.0
Caud
al, L/h
[image:25.595.184.397.92.274.2]Bomba 3 (QAX) Y = 0.2206* X - 1.9368 R2= 0.99
Figura A.3 Calibración bomba 3 (QAX).
20 25 30 35 40 45 50
Voltaje, voltios 0.0
1.0 2.0 3.0 4.0 5.0 6.0 7.0 8.0 9.0 10.0
Ca
udal
, L/h
Bomba 4 (QRF) Y = 0.2109* X - 2.0741 R2= 0.99
[image:25.595.185.396.319.502.2]CAPÍTULO 9
REFERENCIAS BIBLIOGRÁFICAS
Ábalos, M., Bayona, J.M. and Pawliszyn, J. (2000). Development of a headspace solid-phase microextraction procedure for the determination of free volatile fatty acids in waste waters. Journal of Chromatography A., 873, 107-115.
Abu-ghararah, Z.H. and Randall, C.W. (1991). The effect of organic compounds on biological phosphorus removal. Wat. Sci. Tech., 23, 585-594.
Albertson, O.E. (1987). The control of bulking sludges: from the early innovators to current practice. Journal WPCF, 59, 4, 172-182.
Alleman, J.E. and Prakasam, T.B.S. (1983). Reflections on seven decades of activated sludge history. Journal WPCF, 55, 5, 436-443.
Andreasen, K., Petersen, G., Thomsen, H. and Strube, R. (1997). Reduction of nutrient emission by sludge hydrolysis. Water Sci. Tech., 35, 79-85.
APHA-AWWA-WPCF (1995). Standard Methods for the Examination of Water and Wastewater. 19th edition, American Public Health Association. Washington, DC. Araújo, L.S, Catunda, P.F.C. and van Haandel, A.C. (1998). Biological sludge stabilisation
Part 2: Influence of the composition of waste activated sludge on anaerobic stabilisation. Water SA, 24, 3, 231-236.
Aravinthan, V., Mino, T., Takizawa, S., Satoh, H. and Matsuo, T. (2000). Sludge hydrolysate as a carbon source for denitrification. 1st World Congress of the International Water Association, 3, 146-153, Paris 3-7 Julio 2000.
Ardern, E. and Lockett, W.T. (1914). Experiments on the oxidation of sewage without the aid of filters. J. Soc. Chem. Ind., 33, 523-525.
Arthur, C.L., Killam, L.M., Motlagh, S., Lim, M., Potter, D.W. and Pawliszyn, J. (1992). Analysis of substituted benzene compounds in groundwater using solid-phase microextraction. Environ. Sci. Technol., 26, 5, 979-983.
Baeza, J., Gabriel, D. and Lafuente, F.J. (1996). Monitorización y control de una planta piloto de eliminación de nutrientes. 21 Curso de Ingeniería Ambiental: Eliminación Biológica de Nutrientes en Aguas Residuales. Lérida, 28-30 octubre, 187-224. Baeza, J., Gabriel, D. and Lafuente, F.J. (2002). In-line fase OUR (oxygen uptake rate)
measurements for monitoring and control of WWTP. Wat. Sci. Tech., 45, 4-5, 19-28.
Banister, S.S. (1996). Optimisation of Primary Sludge Acidogenic Fermentation for Biological Nutrient Removal. M.Sc. Dissertation, Univ. of Pretoria, South Africa. Banister, S.S., Pitman, A.R. and Pretorius, W.A. (1998). The Solubilisation of N and P
during Primary Sludge Fermentation and Precipitation of the Resultant P. Water SA, 24, 4, 337-342.
Banister, S.S. and Pretorius, W.A. (1998). Optimisation of primary sludge acidogenic fermentation for biological nutrient removal. Water S.A. 24, 1, 35-41.
Barajas, M.G., Knobelsdorf, J., Escalas, A. and Mujeriego, R. (2000). Hydrolysis and Fermentation in a Modified VFA-potential Test. Póster presentado en Paris 2000 1st World Congress of the International Water Association. Paris 3-7 Julio 2000. [CD-ROM] ISBN 2-9515416-0-0.
Barajas, M.G., Knobelsdorf, J., Escalas, A. and Mujeriego, R. (2003). Solubilization and Fermentation in a Modified VFA-potential Method. Environ. Eng. Sci., 20, 4, 329-336.
Barnard, J.L. (1976). A review of biological phosphorus removal in the activated sludge process. Water SA, 2, 136-144.
Barnard, J.L. (1983). Design Consideration Regarding Phosphate Removal in Activated Sludge Plants. Water Sci. Technol. 15, 319-328
Barnard, J.L. (1984). Activated Primary Tanks for Phosphate Removal. Water S.A. 10, 121-126.
Brinch, P.P., Rindel K. & Kalb, K. (1994). Upgrading to nutrient removal by means of internal carbon from sludge hydrolysis. Wat. Sci. Tech., 29, 12, 31-40.
Bécares, E. (1994). Biología de una planta depuradora de fangos activados de doble etapa tratando aguas residuales de la industria farmacéutica. Tesis Doctoral, Facultad de Biología, Área de Ecología de la Universidad de León, España.
Bortone, G., Chech, J.S., Germirli, F., Bianchi, R. and Tilche, A. (1993). Experimental approaches for the characterisation of a nitrification/denitrification process on industrial waste water. Proc, 1st Int. Spec. Conf. on Microorganisms in Activated Sludge and Biofilm Processes,129-136, Sept 27-28, Paris.
Brdjanovic, D., Slamet, A., van Loosdrecht, M.C.M., Hooijmans, C.M., Alaerts, G.J. and Heijnen, J.J. (1998). Impact of excessive aeration on biological phosphorus removal from wastewater. Wat. Res., 32, 1, 200-208.
Brinch, P.P., Rindel, K. and Kalb, K. (1994). Upgrading to nutrient removal by means of internal carbon from sludge hydrolysis. Wat. Sci. Tech., 29, 12, 31-40.
Carlsson, H., Aspegren, H. and Hilmer, A. (1996). Interactions between wastewater quality and phosphorus release in the anaerobic reactor of the EBPR process. Wat. Res., 30, 6, 1517-1527.
Cecchi, F., Battistoni, P., Pavan, P., Fava, G. and Mata-Alvarez, J. (1994). Anaerobic digestion of OFMSW (organic fraction of municipal solid waste) and BNR (biological nutrient removal) processes: a possible integration- Preliminary Results. Wat. Sci. Tech., 30, 8, 65-72.
Charlton, J. (1994). Biological nutrient removal applied to weak sewage. Wat. Sci. Tech., 29, 12, 41-48.
Christensson, M. (1997). Enhanced biological phosphorus removal. Carbon source, nitrate as electron acceptor, and characterisation of the sludge community. Ph.D. Thesis, Department of Biotechnology, Lund University, Sweden.
Christensson, M., lie, E., Jönsson, K., Johansson, P. and Welander, T. (1998). Hydrolysis and fermentation of sludge in primary clarifiers - A simple method to improve enhanced biological phosphorus removal. Wat. Env. Res., 70, 2, 138-145.
Chuang, S-H., Ouyang, C-F., Wang, Y-B. (1996). Kinetic Competition between Phosphorus Release and Denitrification on Sludge under Anoxic Condition. Wat. Res., 30, 12, 2961-2968.
Chudoba, J. (1985). Quantitative Estimation in COD Units of Refractory Organic Compounds Produced by Activated Sludge Microorganism. Wat. Res., 19, 37-43. Cloete, T.E. and Steyn, P.L. (1988). A combined membrane filter-immunofluorescent
technique for the in situ identification and enumeration of Acinetobacter in activated sludge. Wat. Res., 22 (8), 961-969.
Cloete, T.E. (1997). Introduction. In Microbial Community Analysis: the Key to the Design of Biological Wastewater Treatment Systems (eds. Cloete, T.E. and Muyima, N.Y.O.), Scientific and Technical Report, IAWQ, England.
Cloete, T.E. and Muyima, N.Y.O. (1997). Microbial Community Analysis: the Key to the Design of Biological Wastewater Treatment Systems. Scientific and Technical Report, IAWQ, England.
organisms. Microscopy Research and Technique 25: 398-405.
Comeau, Y., Hall, K.J., Hancock, R.E.W. y Oldham, WK. (1986). Biochemical model for enhanced biological phosphorus removal. Wat. Res., 20, 1511-1521.
Cortacáns, J.A. (1997). Investigación sobre la eliminación simultánea de nutrientes por vía biológica. Tesis doctoral por la Universidad Politécnica de Madrid, Madrid. Curtis, T.P. and Craine, N.G. (1998). The comparison of the diversity of activated sludge
plants. Wat. Sci. Tech., 37 (4/5), 71-78.
Daigger, G.T., Robbins, M.H. and Marshall, B.R. (1985). The design of a selector to control low-F/M filamentous bulking. Journal WPCF, 57, 3, 220-226.
Daigger et al., (1987). Factors affecting biological phosphorus removal for the VIP process, a high-rate University of Capetown type process. Proc.IAWPRC Spec. Conf. Biological Phosphate Removal Wastewater, Rome, Italy.
Daigger, G.T., Waltrip, G.D., Romm, E.D. and Morales, L.M. (1988). Enhanced secondary treatment incorporating biological nutrient removal. Journal WPCF, 60, 10, 1833-1842.
Daigger et al., (1990). Full-scale and pilot-scale experience with the VIP process. Paper presented at First Aust. Conf. Biol. Nutrient Removal, Bendigo, Aust.
Danesh, S. and Oleszkiewicz, J.A. (1997). Use of a new anaerobic-aerobic reactor system to enhance biological phosphorus removal. Wat. Sci. Technol., 35, 1, 137-144. Deakyne, C. W., Patel, M.A. and Krichten, D.J. 1(984). Pilot plant demonstration of
biological phosphorus removal. Journal WPCF, 56, 7, 867-873.
Dewisme, E. (1997). Características de las aguas residuales. En XV Curso sobre Tratamiento de Aguas Residuales y Explotación de Estaciones Depuradoras. CEDEX, Madrid.
Directiva 91/271/CEE. DOCE L-35, 30-5-1991.
Dold P.L., Ekama G.A. and Marais G.v.R., (1980). A general model for the activated sludge process. Prog. Water Tech., 12, 47-77.
Dold et al., (1986). Measurement of readily biodegradable cod fraction in municipal waste water by ultrafiltration. UCT Report No. W57, Dept. Civil Eng., Univ. of Cape Town, Rondebosch 7700, South Africa.
Droste, R.L. (1997). Theory and practice of water and wastewater treatment. Jhon Wiley and Sons, Inc. Canada.
Drysdale, G.D., Kasan, H.C. & Bux, F. (2000). Assessment of denitrification by the ordinary heterotrophic organisms in a NDBEPR activated sludge system. Proceedings of the 1st World Water Congress of the International Water Association (IWA), Paris 3-7 Jul 2000, 3:108-114.
Eastman, J.A. and Ferguson, J.F., (1981). Solubilization of particulate organic carbon during the acid phase of anaerobic digestion. Journal WPCF., 53, 352-366.
Eikelboom, D.H. (1975). Filamentous organisms observed in activated sludge. Wat. Res., 9, 365-388.
Eikelboom, D.H. and van Buijsen, H.J.J. (1983). Microscopic sludge investigation manual. 20ed, TNO Research Institute for Environmental Hygiene, Delft, Holland.
Eikelboom, D.H. (1991). The role of competition between floc forming and filaments bacteria in bulking of activated sludge. Biological Approach to Sewage Treatment Process: Current Status and Perspectives. Madoni, P.Perugia. Italy: Luiggi Bazzuchi Center, pp.143-149.
Ekama, G.A., Marais G. v. R. (1977). The activated sludge process part ii. Dynamic behaviour. Water SA. 1, 18-50.
Ekama, G.A. and Marais G. v. R. (1984). Nature of municipal wastewaters. Theory, design and operation of nutrient removal activated sludge process. Pretoria, South Africa, Water Research Commission.
Ekama G.A. and Wentzel M.C., (1999). Difficulties and developments in biological nutrient removal technology and modelling. Wat. Sci. Tech., 39, 6, 1-11.
Elefsiniotis P. and Oldham W.K. (1994). Influence of pH on the acid-phase anaerobic digestion of primary sludge. J. Chem. Tech. Biotechnol., 60, 89-96.
EMASESA, (1997). Microorganismos Filamentosos en el Fango Activado. Varios autores. Ayuntamiento de Sevilla, España.
EPA (1982). Handbook for sampling and sample preservation of water and wastewater. EPA-600/4-82-029. Environmental Monitoring and Support Lab, Cincinnati, Ohio, Estados Unidos, 402.
EPA (1987). Design manual phosphorus removal. EPA/625/1-87/001.
EPA (1992). Wastewater Treatment/Disposal for Small Communities. EPA/625/R-92/005. United States Environmental Protection Agency, Washington D.C., EEUU.
EPA (1993). Manual nitrogen control. EPA/625/R-93/010.
Escaler, I. (1997). Eliminació biológica de nutrients (nitrógen i fósfor) mitjançant el procé discontinu de fangs activats. Tesina de especialidad, ETSECCPB, UPC.
Fernández-Galiano, D., Guinea, A., Serrano, S., Martín, M., Arregui, L., Rodríguez, B., Campos, I., Calvo, P. and Suárez, J. (1996). Guía práctica de identificación de protozoos ciliados en estaciones depuradoras de aguas residuales por lodos activados de la Comunidad Autónoma de Madrid. Dpto. Microbiología, Facultad de Biología, Universidad Complutense de Madrid.
Fuhs, G. W. and Chen, M. (1975). Microbiological basis of phosphate removal in the activated sludge process for the treatment of wastewater. Microb. Ecol., 2, 119-138.
García J. (1996). Eliminació de Matèria Orgànica i Nutrients en Llacunes d´Alt Rendiment. Tesis doctoral, Departament de Productes Naturals, Biología Vegetal i Edafología de la Facultat de Farmàcia, Universitat de Barcelona.
García, P.A. and Fernández-Polanco, F. (1996). Parámetros de operación en sistemas de eliminación de nutrientes. En: 2n Curs d'Enginyeria Ambiental. Eliminació de nutrients en aigües residuals. Xavier Flotats. Lleida: Paperkite Editorial.
Ginestet, P. Maisonnier, A. and Spérandio, M. (2002). Wastewater COD characterization: biodegradability of physico-chemical fractions. Wat. Sci. Tech., 45, 6, 89-97.
Gerber, A., Mostert, E.S., Winter, C.T. and de Villiers, R.H. (1987). Interactions between phosphate, nitrate and organic substrate in biological nutrient removal process. Wat. Sci. Tech., 19, 183-194.
Goel, R., Mino, T., Satoh, H., Matsuo T. (1998). Intracellular Storage Compounds, Oxygen Uptake Rates and Biomass Yield with Readily and Slowly Degradable Substrates. Wat. Sci. Tech., 38, 8-9, 85-93.
Gonçalves, R.F., Charlier, A.C., Sammut, F. (1994). Primary fermentation of soluble and particulate organic matter for wastewater treatment. Wat. Sci. Tech., 30, 6, 53-62. Grady, C.P.L. Jr. and Lim, H.C. (1980). Biological wastewater treatment, theory and
applications. Marcel Dekker, New York., pp. 895.
Gujer, W., Henze, M., Mino, T., Matsuo, T., Wentzel, M.C. and Marais, G.v.R. (1995). The activated sludge model No. 2: biological phosphorus removal. Wat. Sci. Tech., 31, 2, 1-11.
Gujer, W., Henze, M., Mino, T., and Van Loosdrecht, M. (1999). Activated sludge model No. 3. Wat. Sci. Tech., 39, 1, 183-193.
Hallin, S. and Pell, M. (1998). Metabolic properties of denitrifying bacteria adapting to methanol and ethanol in activated sludge. Wat. Res., 32, 1, 13-18.
Hart, M.A. and Melmed, L.N. (1982). Microbiology of nutrient removing activated sludge. Wat.Sci.Tech., 14 (9/11), 1501-1502.
Hatziconstantinou, G.J., Yannakopoulos, P. and Andreadakis, A. (a1996). Primary sludge hydrolysis for biological nutrient removal. Wat. Sci. Tech., 34 (1/2), 417-423. Helmer, C. and Kunst, S. (1998). Low temperature effects on phosphorus release and
Henze, M. (1986). Nitrate versus Oxygen Utilization Rates in Wastewater and Activated Sludge Systems, Wat. Sci. Tech., 18, 6, 115.
Henze, M., Grady, C.P.L. Jr., Gujer, W., Marais, G.v.R., Matsuo, T. (1987). Activated Sludge Model No 1, IAWPRC Scientific and Technical Reports, No 1, IAWPRC, Londres.
Henze, M. (1991). Capabilities of biological nitrogen removal from wastewater. Water Sci. Technol., 23, 4-6, pp. 669-679.
Henze, M. et al. (1992). Characterization of Wastewater for Modelling of Activated Sludge Processes. Water Sci. Technol. 25, 6, 1-15.
Henze, M., Gujer, W., Mino, T., Matsuo, T., Wentzel, M.C. and Marais, G.v.R. (1995a). Activated Sludge Model No. 2, IAWPRC Scientific and Technical Reports, No 3, IAWPRC, Londres.
Henze, M., Gujer, W., Mino, T., Matsuo, Wentzel, M.C., Marais, G.v.R. (1995b). Wastewater and biomass characterization for the activated sludge model No. 2: Bilogical phosphorus removal. Wat. Sci. Tech., 31, 2, 13-23.
Henze, M., Harremoes, P., Cour Janse, J. and Arvin, E. (1997). Wastewater Treatment: Biological and Chemical Processes. 2ed. Springer-Verlag Berlin.
Horan, N.J. (1993). Biological wastewater treatment systems: theory and operation. Jhon Wiley and Sons, Ltd, England.
HRSD (1991). VIP, Virginie Initiative Plant. Informe de la Hampton Roads Sanitation District, Virginia.
Hvitved-Jacobsen, T., Raunkjær, K. and Nielsen, P.H. (1995). Volatile fatty acids and sulfide in pressure mains. Wat. Sci. Tech., 31, 7, 169-179.
Irvine, R.L., Wilderer, P. A., Flemming, H.C. (1997). Controlled Unsteady State Processes and Technologies- an Overview. Wat. Sci. Tech., 35, 1, 1-10.
Iwema, A. and Meunier, A. (1985). Influence of nitrate on acetic acid induced biological phosphate removal. Wat. Sci. Tech., 17, 11, 289-294.
Janssen, P. M. (1994). Operating experiences on two full-scale plants, retrofitted for biological phosphorus removal. Nutrient removal from wastewaters. Horan, N. J., P. Lowe and E. Stentiford, Editors. Pennsylvania: Technomic Publishing Co., Inc. Jardin, N. and Pöpel, H.J. (1997). Waste activated sludge production of the enhanced
biological phosphorus removal process. Wat. Env. Res., 69, 3, 375-381.
Jenkins, D., Richard, M.G. and Daigger, G.T. (1986). Manual on the causes and control of activated sludge bulking and foaming. Water Research Commission, Pretoria, Sur Africa.
Jenkins, D. and Tandoi, V. (1991). The applied microbiology of enhanced biological phosphate removal- accomplishment and needs. Wat. Res., 25, 12, 1471-1478. Jenkins, D. (1992). Towards a Comprehensive Model of Activated Sludge Bulking and
Foaming. Wat. Sci. Tech., 25, 215-230.
Jenkins, D., Richard M. G. and Daigger, G. T. (1993). Manual on the causes and Control of Activated Sludge Bulking and Foaming, 2a. Ed. Lewis Publishers, Michigan, USA. Jorgensen, P.E. Bilogical Hydrolysis of Sludge from Primary Precipitation. En Hahn, H.H.,
Klute, R., editors, Chemical Water and Wastewater Treatment, 521-529. Springer-Verlag, Berlin, Heidelberg.
Kappeler, J. and Gujer W. (1992). Estimation of Kinetic Parameters of Heterotrophic Biomass under Aerobic Conditions and Characterization of Wastewater for Activated Sludge Modelling. Wat. Sci. Tech., 25, 6, 125-140.
Karlsson, I. and Smith, G. (1990). Pre-precipitation facilitates nitrogen removal without tank expansion. Wat. Sci. Tech., 22, (7/8), 85-92.
Kaufman, L. and P. J. Rousseeuw 1990. Finding groups in data: an introduction to cluster analysis. New York: John Wiley & Sons.