Forward-link Throughput Optimization for Wireless Cellular Packet Data
Networks
Moses E. Ekpenyong
Department of Computer Science
University of Uyo, PMB. 1017, 520003, Uyo, NIGERIA (ekpenyong_moses@yahoo.com, mosesekpenyong@gmail.com)
ABSTRACT
An attempt has been made in this paper to access the control layer of the General Packet Radio Service (GPRS) network base station (BS), using throughput optimization. We focus on the effect of packet transmissions on the throughput of forward-link (downforward-link) power balancing, with specific interest on the relative throughput of the four GPRS coding schemes for a realistic GPRS network operating in Nigeria. We derive a model capable of improving the channel quality and simulate the throughput and choice of optimum coding scheme over diverse packet sizes using the MATrix LABoratory toolkit. Simulation results show that the
existing system requires effective network
optimization to improve the system’s throughput performance.
Keywords: GSM/GPRS coding, payload, SINR, payload length, optimization
1. INTRODUCTION
Throughput is defined as the average rate of successful message delivery over a communication channel and is therefore a good measure of the channel capacity of a communication link. The message or information delivery may be over a physical or logical link, or over a wireless channel passing through the cellular network. The throughput of a cellular network depends on a number of variables namely, the packet size, transmission rate, number of overhead bit in each packet, received signal power, received noise power spectral density, modulation technique and channel conditions. The key to maximizing throughput is maintaining the signal-to-interference-and-noise ratio (SINR) at an optimum level [1]. Cellular networks use a scheme called handoff to minimize signal breakup as a mobile user migrates from one cell to another. They also employ spread-spectrum technology and special coding schemes (where each base station is assigned a code) to enable the multiplexing of multiple users over the same physical channel.
The effect of additive noise and interference from other cells is common to all cellular networks.
The total power of these impairments is
σ
2 watts.To be precise, we refer to the impairments (collectively) as noise. Noise appears at the receiver as an additional signal that does not contribute to the overall throughput. The system has to use some of
its power and bandwidth resources to overcome the effect of noise.
In cellular networks, transmission from a base
station say i, to a node j, is seen as interference by
transmission from any node n to any other node k,
such that
(
n
,
k
) ( )
≠
i
,
j
, and consequently,reducing the bit service rates for link (n,k). This interaction introduces a negative feedback (into the system) in the form of temporary congestion in the network, caused by fluctuations in the wireless channel quality, thus reducing the network throughput around the congested area and increasing further the congestion and fading rates, thereby obstructing the transmission of packets and hindering the propagation of network signals.
This paper emulates a realistic network by using empirical data from the field. Firstly, we obtain realistic data measurements from Airtel Nigeria (formally, Zain communications limited), using a dashboard Motorola cell monitor. The data were obtained from base station controllers within the southeast region of Nigeria during busy hours. In studying the network, we observe the behaviour (of important parameters) of the system, operating under ideal conditions and derive a system model that depicts the system.
2. GPRS: BACKGROUND ISSUES
Due to growing interest in mobile data
applications, the global system for mobile
communications (GSM) has been extended by the general packet radio service (GPRS). GPRS allows the transmission of packet data at moderate bit rates using random access channels within the existing GSM infrastructure. GPRS is a packet data overlay to GSM, which has the largest number of subscribers in the world among all wireless systems [2]. It provides the necessary functionalities to handle packet data in GSM networks. Mobile terminals such as notebooks, personal digital assistants (PDAs), mobile phones and pagers can give access to a wide range of new mobile data services. There are three main parameters that determine the link layer performance of a GPRS network. They include frequency reuse, error coding scheme (CS) and data packet delay [3].
(i) Frequency Reuse
one cell). GPRS systems typically use universal frequency reuse, as oppose to earlier networks, where the mobile stations and base stations use the whole bandwidth to transfer and receive information. Since GSM voice services usually require a frequency reuse of 3 or 7, as separate overlaying networks, GPRS provides better resource utilization and maximizes the number of users fulfilling the specified QoS requirements. The cellular network has a predetermined range of frequencies to exchange information between the base stations and mobile stations. Therefore, the smaller the frequency reuse factor which a cellular network can employ, the higher the network capacity.
(ii) Error Coding Scheme (CS)
[image:2.595.314.526.97.266.2]Table 1 shows the four coding schemes employed by GPRS systems:
Table 1. GPRS Coding Schemes Coding
Scheme
Code Rate
PLC data block payload
(bytes)
Service data rate
kb/s
CS – 1 ½ 22 8.8
CS – 2 ≈2/3 32 12.8
CS – 3 ≈ ¾ 38 15.2
CS – 4 1 52 20.8
The payload of each Radio Link Control (RLC) block is added to the Radio Link Control/Media Access Control (RLC/MAC) header and a block check sequence. For CS-1, CS-2 and CS-3, the radio block is convolutionally coded with code rate ½ and then punctured to the desired code rate. CS-4 does not contain forward error correction. The service data rate is calculated from the 240ms duration of a GPRS super-frame. The super-frame consists of 52 GSM frames including 48 traffic frames and 4 control frames. The 48 traffic frames carry 12 RLC blocks. Therefore the data rate is computed as follows:
)) / ( ( 4
. 0
) sup / ( 240
) / ( 8 ) sup
/ ( 12 ) / (
s kb bytes payload
erframe ms
byte bits frame er block block
bytes payload
× =
× − ×
Among the 4 coding schemes, CS-1 has the least coding rate. It is also the most robust coding scheme. Therefore, CS-1 is used for all control messages. CS-2 and CS-3 have lower coding rates and more information bits. CS-4 is the most data efficient coding scheme, but is most vulnerable to channel impairments. The base station sub-system can select any of the coding schemes to optimize the throughput and delay performance.
The GSM system uses a combined
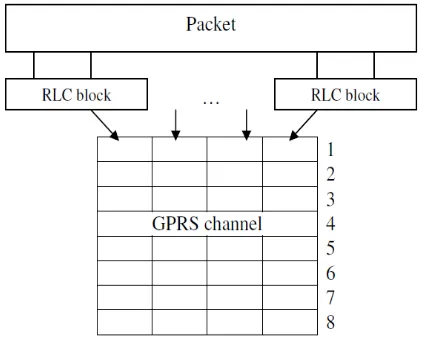
FDMA/TDMA air interface, where one TDMA frame is sent at 4.615ms, in a 200KHz wide frequency band. Each TDMA frame is divided into eight slots and a mobile terminal is often assigned to a slot. A sequence of these slots is called a channel. In GPRS, four TDMA frames are combined with additional control information to form one Logical
Link Control (LLC) frame. Each of the eight channels in a TDMA frame can be used for GPRS.
Figure 1. A simplified GSM frame structure with GPRS (packet data) channels.
At the link layer, there are a maximum of eight GPRS packet data channels (PDCHs) per allocated frequency. Each of them capable of transferring one Radio Link Control (RLC) block every 20ms, providing a raw bit rate of 23Kbps per channel. All mobile stations requiring data services in a particular cell share the available PDCHs.
3. RELATED LITERATURE
Several research publications exist on
throughput analysis of cellular networks [4-5]. Also, many models have been developed to suit the resource issues investigated. These include choosing an optimal power level to maximize throughput [6]. In [7], coding of GPRS networks by forward error correction, using punctured convolutional codes at different coding rates and retransmission of RLC blocks containing unrecoverable errors, usually referred to as Automatic Repeat Request (ARR) is used to strengthen the throughput of cellular networks. Sung and Wong [8] have presented forward-link throughput maximization, where the interference is modeled by the aid of the orthogonality factor and determined by the transmission strategy for a range of the orthogonality factor values and user’s channel gains, so as to maximize the system throughput, subject to a total power constraint. Most of the previous works found have taken specific look at throughput in different cellular network technologies (such as TDMA, FDMA, CDMA, etc.) and consider various system parameters in their analysis.
4. DOWNLINK QUALITY MEASUREMENT
Due to the success of cellular telephone services in the 1990’s, the global communication system has
shifted attention to data transmission [9].
[image:2.595.65.292.275.375.2]Maximum Throughput with No Additive Noise
Before carrying out a performance analysis for
arbitrary number of terminals, N, let us examine a
two terminal case (N=2), to provide a clue on the effect of power levels on base station throughput.
(i) Two terminals case
According to [8], the simplest nontrivial throughput maximization of
2
1
σ
γ
+
=
∑
≠ =
j i j j
i i
Q
Q
G
(1)occurs when N=2 and
σ
2= 0. In this case, thenormalized throughput U, is a function of just one
variable,
Z
=
Q
1/
Q
2 andγ
1=
G
/
Z
. However,2
2
=
G
γ
. By adopting the notation)
/
(
)
(
)
(
2
Z
f
GZ
f
G
Z
U
=
+
as the normalizedthroughput when N=2 and
σ
2=
0
, it is found that1
0
2
=
=
Z
at
dZ
dU
. This suggests that
)
(
2
)
1
(
2
f
G
U
=
, could be a local maximum,depending on the sign of the second derivative at Z=1. Examining the second derivative for arbitrary
S-shaped
f
( )
γ
, we find that U2(1) is a localminimum at low values of G, and a local maximum at high values.
Specifically,
[
]
(
)
x G Zx
f
d
dx
d
G
G
f
G
f
G
G
dZ
U
d
= =
′
=
′
+
′′
=
)
(
2
)
(
)
(
2
1 2
2 2
(2)
The sign of the second derivative of U2 is the same
as that of the derivative of
x
f
′
(
x
)
. For the class offunctions
f
(
x
),
x
f
′
(
x
)
has a bell shape reachinga single maximum at some point
x
=
G
*
.Therefore, the derivative of
x
f
′
(
x
)
is positive forany x, to the left of G*, and is negative otherwise.
This implies that U2(1) is a local maximum when G
is large enough to exceed G*, and is a local minimum otherwise. It is determined whether there is a global maximum at the boundaries of the feasible region when Z=1 yields a local minimum;
i.e. at Z=0 and Z=
∞
. Even when Z=1 is a localmaximum, the probability that the global maximum lies at the boundary of the feasible region must also be considered. This suggests that we compare the equal-received-power condition (Z=1) with the condition that terminal two, does not transmit at all (Z=0). The comparison reveals that Z=1 produces
higher throughput when
2
f
(
G
)
>
1
, while Z=0produces higher throughput when
2
f
(
G
)
>
1
.Accordingly, the critical processing gain Gc, is
defined as the value of G for which
f
(
G
)
=
0
.
5
.Gc has the property that single terminal transmission
(Z=0 or Z=
∞
) is better than equal-received-powertransmission when G<Gc and conversely, when
G>Gc. Since G is proportional to the bandwidth, we
can state that the system requires a bandwidth
corresponding to at least G=Gc to support two data
terminals.
(ii) Arbitrary Number of Terminals
Let’s consider
0
;
0
20
=
=
∂
∂
=
σ
i Q i
Q
u
(3)
and
0
;
0
20
>
=
∂
∂
=
σ
i Q i
Q
u
(4)
Equations (3) and (4) are used to explore power balancing to determine whether they provide maximum or minimum throughput. We extend the approach adopted in the case of N=2. To do so, we
assume that signals f from k transmitters arrive at the
base station with equal power and that the other N-k
terminals turn off their transmitters when Qi = Q for
i = 1, 2, …, k and
σ
2=
0
and
−
=
1
)
(
k
G
kf
k
U
(5)where
)
(
k
U
is the power balancing throughput and afunction of k.
k are the transmitters
f are the signals transmitted by k transmitters
G is the processing gain
For values of G>Gc, U(k) has a maximum value at
2
*
≥
=
N
k
. Throughput is maximum when N*signals are received with equal power and the other N-N* signals are not transmitted at all.
5. THROUGHPUT AND DELAY MODELING: PARAMETERS DEFINITION
The expected throughput of the system can be represented mathematically as:
[
]
( )
(
kb s)
t
length packet t
N throughput E
t /
_
lim ×
= ∞ →
(6)
where
N(t) is the number of packets transmitted in the
system
packet_length is the length of packets (assuming equal length of packets)
t is the expected service time
Let
( )
=
1
t
t
N
, represent the inverse of the expected
packet service time. As t approaches infinity, we
have
[
]
(
kb s)
T legnth packet throughput
where
T
is the average transfer delay excluding the random access phase that takes place before the uplink channel assignment.To compute the packet transmission delay, we segment the total delay into several components starting with channel assignment till the final acknowledgement: ack final correction error tx
assign
T
T
T
T
T
=
+
+
−+
− (8)where
assign
T
is the duration of the channel assignmentprocedure for transmission and processing time.
Ttx is the data block’s first time transmission
period based on the packet length and coding scheme.
Terror-correction is the handling time for backward
error control including retransmission.
Tfinal-ack is the final acknowledgement (ACK)
message including control acknowledgement message processing and transmission time.
For our model, Tassign= 2 (blocks) and Tfinal-ack = 4
(blocks)
)
(
blocks
n
T
tx=
(9)where − − − − = = 4 52 3 38 2 32 1 22 _ , _ _ CS for bytes CS for bytes CS for bytes CS for bytes length block length block length packet n
Terror-correction can be split into two:
Terror-correction = Tretx + Tnack (10)
where
Tretxis the retransmission time of erroneous data
blocks
Tnack is the negative acknowledgement (NACK)
message processing and transmission times.
(
1 ( , ))
( )) , ( blocks ci cs bler n ci cs bler Trectx − ×
= (11)
where bler is the block error rate
Let m(n) be a random variable representing the number of NACK messages successfully sent during the transmission of a packet consisting of n RLC blocks, which is equivalent to the number of
retransmission cycles for the frame. Let Tone-nack
denote the transmission time for one NACK message (Turina and Ludiving, 1997),
[
m
(
n
)
]
E
T
T
nack=
one−nack×
(12)To account for errors in the downlink ACK/NACK messages, we note that the process of sending one NACK message consists of 2 parts: initial transmission and retransmission of the message.
Here Tinitial-nack = 3. The initial after-frame NACK
message is transmitted with CS-1. It is correctly
received with probability
(
1
−
bler
(
CS
−
1
,
Ci
))
.If the NACK is not received by the Mobile Station (MS), the MS will resend the oldest block with errors or the oldest unacknowledged block, expecting the base station (BS) to re-send the
ACK/NACK message. Our model assumes that if the data block is again in error, the whole process is repeated. Only if both the resent data block and the NACK are successful, will the NACK transmission process complete. The round trip delay is 4 blocks. Assuming there is no limit on the number of transmissions allowed for one NACK message,
(
)
(
)
(
blerCS Ci)
(
bler(
CsCi)
)
Ci CS bler T
Tonenack initialnack
, 1 , 1 1 , 1 4 − × − − − + = −
− (13)
6. THE SYSTEM MODEL
Recall from equation (6) that the throughput is given by
( )
t
P
t
N
Thr
L t×
=
∞ →lim
T
P
Thr
=
L∴
(14)where the delay
( )
and
P
Lt
t
N
T
=
is the packetlength. Also recall from equation (8) that
ack final correction error tx
assign
T
T
T
T
T
=
+
+
−+
−where
Tassign is taken as 2 (blocks)
Tfinal-ack is taken as (4 blocks)
L L tx
B
P
n
T
=
=
−
−
−
−
=
4
52
3
38
2
32
1
22
CS
for
bytes
CS
for
bytes
CS
for
bytes
CS
for
bytes
B
L ,which represents the block length or payload. Now, substituting the respective parameters into equation (10) gives:
( )
[
mn]
E T
bler n bler
Terror correction + one nack ×
− ×
= −
−
1
(
bler)(
bler)
E[
m( )
n]
blerTinitial nack ×
− − + = − 1 1
4 (15)
Hence, equation (14) can be rewritten as
(
)
(
) (
) (
)
− − − × − + + − × + + =∑
= − − n i n n i nack initial L L assign L m bler bler bler i n n bler bler T bler n bler B P T P Thr 1 1 1 1 1 1 4 1 (16) wherem is the number of messages sent during
transmission
The throughput can also be related to bler and the
R
bler
Thr
=
(
1
−
)
×
where R is the data rate
(
)
(
bler
)
R
P
T
R
bler
T
P
L L
−
=
×
−
=
∴
1
1
(17)
But
R
=
0
.
4
×
payload
(
bler)(
x payload)
P
T L
4 . 0 1− =
∴ (18)
7. EXPERIMENTAL DATA ANALYSIS
Figure 2 reveals that for the duration under study, the system throughput fluctuates at the various base station locations. This could be attributed to network instability caused by propagation impairments that distort the received data packets, resulting in poor delivery at the receiver’s end. In Figure 3, we plot the average throughput as a function of the base stations over the study period. We observe that the
throughput performance is not significantly
influenced by the base stations, as evident from the
obtained correlation coefficient (R2) value (i.e.
R2=0.0013). However, other factors such as
increased number of users, fading, interference due to noise, equipment malfunctioning or downtime, etc., could contribute to a great extent and explain better the instability that has threatened the system’s performance. Airtel Nigeria therefore requires an optimized technique to deal with these impairments.
0 5
10 15
20
0 10 20 30 40 50
0 10 20 30 40 50 60
Days BSC
T
h
ro
u
g
h
p
u
t
0 0.1 0.2 0.3 0.4 0.5 0.6 0.7 0.8 0.9 1
Figure 2. Forward-link Throughput analysis at various BSs during the study period
y = 0.0055x + 29.087 R2
= 0.0013
0 5 10 15 20 25 30 35
0 5 10 15 20 25 30 35
Duration (days)
A
v
e
ra
g
e
t
h
ro
u
g
h
p
u
[image:5.595.71.285.71.210.2]t
Figure 3. Graph of average throughput vs. number of days
8. SIMULATION INPUT
To evaluate the proposed system model, sample inputs were used to simulate the model. Some of the input data were drawn from the field, under ideal conditions. Table 2 shows the parameters used for the research.
Table 2. Sample simulation parameters and their values
Parameter Value
The packet length (PL) 200 – 1,600 kb/s
The block length or payload (BL)
CS-1 =22 bytes CS-2=32 bytes CS-3=38 bytes CS-4=52 bytes
Duration of the channel assignment procedure for transmission and processing time (Tassign)
2 blocks
Average forward-link throughput from the field (Thr)
29.114 kb/s
Block error rate (bler) 0.001-0.009
Number of packet transmitted (n)
40 bytes
Initial after-frame negative
acknowledgment message(s)
transmitted (Tinitial_nack)
3 blocks
Number of message(s) sent during
transmission(m)
1-10
[image:5.595.313.534.75.245.2] [image:5.595.305.528.386.713.2] [image:5.595.85.267.469.653.2]9. DISCUSSION OF RESULTS
Figure 4 shows the effect of messages transmitted on the system throughput using diverse block lengths or payload sizes. We observed that as the coding scheme increases, the throughput also
increases, which validates our optimization
technique. As more messages are sent, throughput tends to slowdown for the different coding schemes, except for CS-4, which shows improved system performance.
Shown in Figure 5, is a relationship between the throughput and packet length. Comparing the throughput using varied packet lengths, we observed that the packet length had dominant effect on the system throughput. The throughputs for shorter packets are substantially lower than longer packets. Again, the throughput seems inhibited for other coding schemes except CS-4, which shows improved system performance.
1 2 3 4 5 6 7 8 9 0
5 10 15 20 25 30 35 40 45
50 Graph of Throughput vs. Number of messages sent during packet transmission
No. of message sent during transmission
T
h
ro
u
g
h
p
u
t
CS-1 CS-2 CS-3 CS-4
Figure 4. Graph of throughput vs. number of massages sent
0 200 400 600 800 1000 1200 1400 1600
0 5 10 15 20 25 30 35 40 45
50 Graph of Throughput vs. Packet length
Packet length
T
h
ro
u
g
h
p
u
t
[image:6.595.327.519.147.340.2]CS-1 CS-2 CS-3 CS-4
Figure 5. Graph of throughput vs. packet length
As expected in Figure 6, the throughput increases with the block error rate (bler). At lower
bler, the throughput increases rapidly but as the bler exceeds 0.02, the throughput slows down, indicating network congestion as a result of more users accessing the system. This may lead to the possibility of poor message delivery at the receiver’s end.
1 2 3 4 5 6 7 8 9
x 10-3 0
5 10 15 20 25 30 35 40 45
50 Graph of Throughput vs. Block error rate
Block error rate
T
h
ro
u
g
h
p
u
t
CS-1 CS-2 CS-3 CS-4
Figure 6. Graph of throughput vs. block error rate
In Figure 7, we examine the performance of the system by studying the effect of packet length on system’s delay using the four coding schemes. We observed that the longer the packet length, the longer (time) it takes to deliver the desired message. However, as the coding scheme is increased (from CS-1 to CS-4), the delay in transmission shortens. This explains the robustness score of the various
coding schemes in dealing with channel
impairments. Therefore, network operators should implement efficient coding schemes that will optimize the system’s performance and guarantee effective message deliveries.
0 200 400 600 800 1000 1200 1400 1600 0
0.5 1 1.5 2
2.5 Graph of Delay vs. Packet length
Packet length
D
e
la
y
[image:6.595.90.284.294.481.2]CS-1 CS-2 CS-3 CS-4
[image:6.595.90.285.522.708.2] [image:6.595.327.526.541.725.2]10. CONCLUSION
Due to sharing of common communication channel by users, interference in form of noise is always generated and is the main limitation for determining the optimum throughput. A general overview of GPRS technology has been presented and a summary of those attractive features, which demonstrates GPRS technologies superiority over 2G cellular network technologies and other 3G technologies given.
This paper has been able to optimize the throughput in GPRS cellular network through forward-link (downlink) transmit power balancing by simulating a model with relevant parameters. Some practical issues regarding the application of this research have been considered and series of investigations identifying the key features and parameters, as well as the functionality of the GPRS coding schemes have been presented. Simulation results show that the system’s throughput has been optimized by the proposed model. This technique will aid in transmitting signals from the GPRS base station with equal possible power.
REFERENCES
[1] Rodriguez V. and Goodman D. J. (2003). Prioritized Throughput Maximization via Rate and Power Control for 3G CDMA: The Two
Terminal Scenario. In Proceedings of 40th
Allerton Conference Communication, Control and Computing.
[2] Goodman D. (2005). Performance Analysis of Radio Link/Media Access Control of General Packet Radio Service System, Ph.D. Thesis Report. WINLAB TR 209.
[3] Hamalainen D. and Kari P. (1995). Handover and Dynamic Channel Allocation Techniques in Mobile Cellular Network. IEEE Transaction on Vehicular Technology. 44(20):229-237.
[4] Bali S. A. (2001). Study of the Throughput of General Packet Radio Service (GPRS) for Internet Applications. M.Sc. Thesis, University of Jordan, Jordan.
[5] Lindemann C. and Thümmler A. (2001). Evaluating the GPRS Radio Interface for Different Quality of Service Profiles. In
Proceedings of 12th GI/ITG Fachtagung
Kommunikation in Verteilten Systemen (KiVS), Hamburg, Germany: 291-301.
[6] Larson R. and Olofsson D. (1998). Handover and Dynamic Channel Allocation Techniques in Mobile Cellular Network. IEEE Transaction on Vehicular Technology. 44(2):120-143.
[7] Cai J. and Goodman D. (1997). General Packet Radio Service in GSM. IEEE Communication Magazine. 35: 122-131.
[8] Sung C. W. and Wong W. S. (2002). Power Control and Rate Management for Wireless Multi-media CDMA system. IEEE Transactions on Communication. 49(7): 1215-1226.
[9] Goodman D. and Marantz Z. (2003).
Maximizing the throughput of CDMA Data
Communications. In Proceedings of 58th IEEE