Department of Computer Science
University School of Computer Science
Ph.D. Thesis
Evolutionary Framework for DNA Microarray
Cluster Analysis
Presented by
Jos´
e Antonio Castellanos Garz´
on
A dissertation submitted to the University of Valladolid for the Ph.D. Degree
Supervised by theProf. Ph.D. Fernando D´ıaz G´omez
c
2012, by Jos´e Antonio Castellanos Garz´on.
The reproduction of all or part of this work is permitted whenever for educational and non-commercial purposes, citing the source and the author.
(CCIA) de la Universidad de Valladolid, HAGO CONSTAR:
Que el trabajo de investigaci´on que se recoge en la presente memoria, titulado Evolutionary Framework for DNA Microarray Cluster Analysisy presentado porD. Jos´e Antonio Castellanos Garz´onpara optar al Grado de Doctor Internacional, ha sido realizado bajo mi direcci´on en el Departamento de Inform´atica de la Universidad de Valladolid.
Valladolid, 10 de octubre del 2012.
Contents vii
Index of Tables xi
Index of Figures xiii
Summary xix
Resumen xxvii
Agradecimientos xxxvii
1 Introduction 1
1.1 Motivation . . . 2
1.2 Research Hypothesis . . . 4
1.3 Research Evolution . . . 7
1.4 Outline . . . 8
2 Microarray Technology and its Challenges 11 2.1 Measuring mRNA Levels . . . 12
2.2 Gene Expression Data Preprocessing . . . 15
2.3 Clustering for Gene Expression Data Analysis . . . 16
2.4 Clustering Categories of Gene Expression Data . . . 17
2.4.1 Gene-based Clustering . . . 18
2.4.2 Sample-based Clustering . . . 19
2.4.3 Subspace Clustering . . . 20
2.5 Microarray Data Sources and their Uses . . . 21
3 Data Clustering 25
3.1 Cluster Analysis . . . 26
3.2 Data Representation . . . 28
3.3 Data Types and Scales . . . 29
3.4 Data Normalization and Visualization . . . 30
3.5 Methods and Algorithms for Clustering . . . 32
3.5.1 Hierarchical Clustering . . . 34
3.5.2 Algorithms for Single-link and Complete-link Methods . . . 35
3.5.3 Agglomerative algorithm for single-link and complete-link methods . . . 37
3.6 Cluster Validation . . . 38
3.6.1 Homogeneity and Separation . . . 39
3.6.2 Silhouette Width . . . 40
3.6.3 Agreement with Reference Partition . . . 40
3.7 Clustering and Visualization Methods for DNA Microarrays . . . 41
3.7.1 Gene-Based Clustering Approaches . . . 41
3.7.2 Visualization Techniques for DNA Microarrays . . . 46
4 Evolutionary Algorithms 53 4.1 Evolutionary Computation . . . 54
4.2 Evolutionary Algorithm Structure . . . 55
4.3 Optimization Aim . . . 56
4.3.1 Multiple Objective Optimization . . . 58
4.3.2 Combinatorial Optimization . . . 59
4.4 Genetic Algorithms . . . 60
4.4.1 Genetic Algorithm Structure . . . 63
4.4.2 Criteriums and Mechanisms used in GAs . . . 64
4.4.3 Basic Procedures of a Genetic Algorithm . . . 66
4.4.4 Pseudocode of a Genetic Algorithm . . . 68
4.5 Difficulties in the use of Genetic Algorithms . . . 70
4.6 Genetic Algorithms and Hierarchical Clustering . . . 71
5 Complexity of the Research Hypothesis 75 5.1 The Problem . . . 76
5.2 NP-Completeness . . . 76
5.3 Proof of the Fundamental Theorem . . . 79
6.1.1 Individuals and Encoding . . . 87
6.1.2 Length of an Individual . . . 87
6.1.3 Fitness Function . . . 89
6.1.4 Improving the Fitness Function Cost . . . 92
6.1.5 Mutation Operator . . . 95
6.1.6 Crossover Operator . . . 99
6.1.7 EvolCluster Algorithm . . . 102
6.2 Execution Strategy of EMHC . . . 103
6.2.1 LocalSearch Algorithm . . . 104
6.3 Adding a New Objective to the Fitness Function . . . 105
6.4 Implementing EMHC . . . 108
7 Theory of the Visual Framework 109 7.1 Boundary Points: Background . . . 109
7.2 Metric-based Cluster Boundaries and Surfaces . . . 111
7.2.1 Boundary Points of a Cluster . . . 112
7.2.2 Multidimensional Algorithm to Obtain Cluster Boundaries . . . 113
7.2.3 ClusterBoundary Algorithm . . . 113
7.2.4 Surface Reconstruction based on Boundary Points . . . 117
7.2.5 BoundaryShapeAlgorithm . . . 119
7.3 The 3D-VC Framework . . . 122
7.3.1 Exploring the Tool . . . 122
7.3.2 Implementing the Framework . . . 126
8 Results from DNA Microarray Data 129 8.1 Used Data Sets . . . 130
8.2 Used Clustering Methods . . . 130
8.3 Experimental Evaluation of the EMHC Evolutionary Model . . . 131
8.3.1 Evaluation of EMHC According to Genetic Operators . . . 131
8.3.2 EMHC Evaluation from cellcycle . . . 138
8.3.3 EMHC Evaluation from sorlie . . . 142
8.3.4 EMHC Evaluation from lung . . . 147
8.4 Experimental Evaluation of the 3D-VC Framework . . . 148
8.4.1 A Case Study . . . 148
8.5 Visual Analysis of the Results of the EMHC Evolutionary Model . . . . 154
8.5.2 lung Dendrograms . . . 160
9 Conclusions 167
9.1 Conclusion on EMHC . . . 169 9.2 Conclusion on 3D-VisualCluster . . . 171 9.3 Future Work . . . 171
9 Conclusiones 173
9.1 Conclusi´on sobre EMHC . . . 175 9.2 Conclusi´on sobre 3D-VisualCluster . . . 177 9.3 Trabajo Futuro . . . 178
A Scientific Works, Conferences and Publications of this Research 181
B Data Dimensionality Reduction 183
B.0.1 Principal Component Analysis . . . 183
C Metric Spaces 185
D Theoretical Results of Chapter 7 189
3.1 Comparative table of visualization tools versus existing visualization components. Tools: Cluster and TreeView of [1], TM4 of [2], Gen-Cluster 2.0 of [3], HCE 3.5 of [4], Visual Exploration 3D of [5] and
3D-VisualCluster as 3D-VC.. . . 50
8.1 Parameter settings of EMHC for the evaluation of the genetic operators. 132
8.2 Parameter settings to evaluate the individuals of EMHC. . . 136
8.3 Parameter settings to evaluate EMHC from thecellcycle, sorlieandlung data set. . . 140
8.4 Cluster validity of EMHC vs. five hierarchical clustering methods on the cellcycledata set. . . 140
8.5 Comparison of six clustering methods vs. the reference partition of the cellcycledata set. . . 141
8.6 Cluster validity of six clustering methods with respect to the reference partition of thecellcycledata set. . . 142
8.7 Cluster validity of EMHC vs. five hierarchical clustering methods on the sorlie data set. . . 143
8.9 Cluster validity of EMHC based on the solutions of other methods on thesorlie data set. . . 146 8.10 Cluster validity of EMHC vs. five hierarchical clustering methods on the
lung data set. . . 147 8.11 Cluster validity of EMHC vs. five hierarchical clustering methods based
on the best clustering of each output dendrogram on the lung data set. 148 8.12 Comparative table of agreement and disagreement of clustering results
1 Evolutionary Framework for cluster analysis from DNA microarray data. xxi 2 F ramework Evolutivo para el an´alisis de cluster sobre datos de
DNA-microarrays. . . xxx
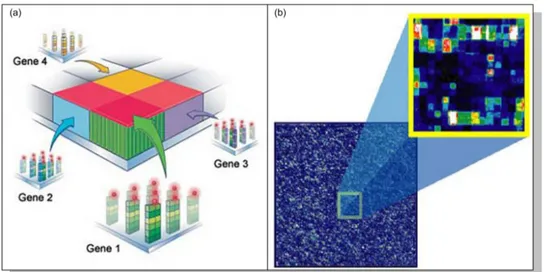
1.1 Evolutionary Framework for cluster analysis from DNA microarray data. 5 2.1 a) displays a GeneChip array of Affimetrix and b) displays the grid surface of it, where DNA probes of known sequences are attached. . . . 14
2.2 Summary of the hybridization process from DNA complementary se-quences to the DNA probe array of the chip. . . 14
2.3 a) displays the intensity levels (through colors) captured by grids of some genes after the hybridization. b) displays the resulting image of the whole microarray from the scanning process. . . 15
2.4 Gene expression matrix of a microarray. . . 16
3.1 Formats, types and scales for representing data. . . 31
3.2 Tree of classification types. . . 33
3.3 Example of a dendrogram. . . 36
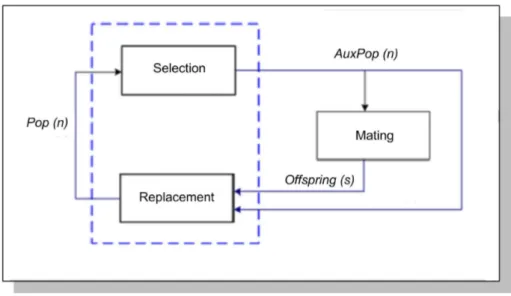
4.1 Basic loop of a genetic algorithm. . . 63
4.2 Crossover of two chromosomes in one single point. . . 67
5.1 A representation of the dendrogram space in form of tree (a weighted graph). Every vertex denotes a clustering, the edges are connections between clusterings nested within the same dendrogram andwis a weight function. A simple path from node C1,1 to Cn,1 means a dendrogram of
the search space. . . 80
6.1 A dendrogram structure through sets (on the left side), representing each clustering of the hierarchy. The right side shows the associated dendrogram graph. . . 87
6.2 A hypothetical example summarizing the running of the mutation op-erator defined for the EMHC method. (A) shows the mutation process from the internal structure of the dendrograms whereas (B) shows the same, but from the graph of the dendrograms. . . 97
6.3 A hypothetical example summarizing the running of the crossover op-erator defined for the EMHC method. (A) shows the crossover process from the internal structure of the dendrograms whereas (B) shows the same, but from the graph of the dendrograms. . . 101
iterations. Intermediate computations are shown on (b1) and (b2). Re-maining cluster and boundary of each iteration are respectively shown on{(a2), (a3)} and {(c1), (c2), (c3)}. . . 118
7.3 Convex hull of the boundary points of a cluster. . . 121
7.4 General view of the tool. There are eight linked views: microarray, den-drogram and parallel coordinates views at the top of the figure; 3D scat-ter plot views at the bottom; clusscat-ter boundary points, reference partition surfaces and cluster surface reconstruction. . . 123
7.5 (a) compares the current cluster by changing the shape of the points (with cubes) vs. remaining points of the data set; (b) compares the current cluster (colored) vs. remaining points of the data set (white circle) and (c) displays only the current cluster. . . 126
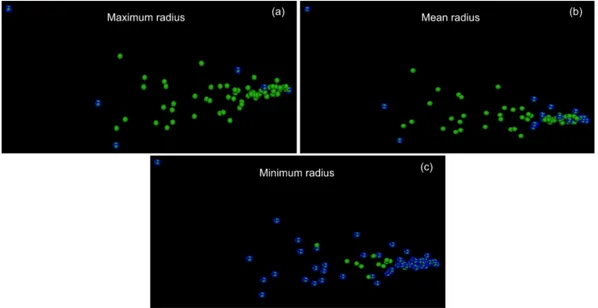
7.6 Shows boundary point options; (a) displays the boundary points com-puted from maximum radius; (b) boundary points comcom-puted from mean radius; and (c) boundary points computed from minimum radius. . . 127
8.1 Four graphs of the same experiment, showing the fitness of the most fit individual in 100 generations of EMHC for 20 values of mutation probability (curve in blue color). The mean fitness from the four graphs (curve in green color) is shown along with its corresponding standard
error bars. . . 133
8.2 Four graphs of the same experiment, showing the fitness of the most fit individual in 100 generations of EMHC for 20 values of crossover probability (curve in blue color). The mean fitness from the four graphs (curve in green color) is shown along with its corresponding standard
8.3 Fitness profile for four dendrograms of an initial population from the cellcycle data set, showing the fitness values for each clustering of these dendrograms. . . 137
8.4 Fitness profile for four output dendrograms of EMHC from thecellcycle data set, showing the fitness values for each clustering of these dendro-grams. . . 139
8.5 A view of parallel coordinates of five measures, representing six curves formed by the values reached from each method in tables 8.5 and 8.6 on thecellcycle data set. . . 143
8.6 A view of parallel coordinates for four measures, representing six curves of the values reached by each method in Table 8.8 on the sorlie data set. 145
8.7 A view of parallel coordinates for four measures, representing six curves with values scored by each method in Table 8.11 (lungdata set). . . 149
8.8 Dendrogram and microarray of cellcycleforAgnes method, showing the level of 13 clusters. Clusters are enumerated from left to right. . . 151
8.9 Dendrogram and microarray ofcellcycle for theDiana method, showing the level of 13 clusters. . . 152
8.10 Dendrogram and microarray ofcellcycle forEisenmethod, showing the level of 13 clusters. . . 153
8.11 cellcycle reference partition. Each r-cluster has been displayed as a 3D surface. . . 154
8.12 Shapes of the cellcycle reference partition and the clusters that better match each r-cluster, Agnes method. . . 155
8.13 Shapes of the cellcycle reference partition and the clusters that best match each r-cluster, Diana method. . . 156
8.16 Visualization of the dendrogram and the microarray for EMHC onsorlie. Clusters of the level selected in the dendrogram are highlighted. . . 160 8.17 3D scatter plot of the gene-points of sorlie. . . 161 8.18 Visualization of dendrogram and microarray for EMHC (using gd, see
Definition 6.10) on sorlie from the solutions given by other methods. Clusters of the level selected in the dendrogram are highlighted. . . 162 8.19 Visualization of dendrogram and microarray for EMHC (using grd, see
Definition 6.14) on sorlie from the solutions given by other methods (external solutions). Clusters of the level selected in the dendrogram are
highlighted. . . 163 8.20 Visualization of dendrogram and microarray forTSVQonlung. Clusters
of the level selected in the dendrogram are highlighted. . . 164 8.21 Visualization of dendrogram and microarray for EMHC onlung. Clusters
T
HIScal clustering represented by an evolutionary model, a set of cluster validationresearch proposes anevolutionary framework where a method of hierarchi-measures and a cluster visualization tool have been fused to create a suitable environment of knowledge discovery from DNA microarray data. On one hand, the clustering evolutionary model of our framework is a novel alternative that attempts to solve some of the problems faced by the existing clustering methods. On the other hand, our alternative of cluster visualization given by a tool couples new properties and visual components, allowing us to validate and analyze clustering results. It also allows a visual checking environment of the cluster validation measures. This way, the fusion of the clustering evolutionary model with the cluster visual model becomes our framework a novel application of data mining compared to the conventional methods of machine learning.Motivation, Hypothesis and Goals
In order to reach our proposal, we have focused our efforts on the combination of ar-eas such as evolutionary computation, data mining and visual analytics to build the framework on the domain of gene expression data. Each of these areas provides tech-niques that play a major role for the analysis and resolution of the current challenges inBioinformatics.
identification of new genes that are key in the genesis and development of diseases. However, the exploration of these large data sets is an important but difficult problem. Information visualization techniques can help to cope with this problem. Visual data exploration has high potential and many applications in data mining use information visualization technology for an improved data analysis.
Consequently, the part of the clustering evolutionary model of our framework has been motivated by the fact that the biological data representation in form of a den-drogram is one of the ways of knowledge discovery. Due to this, if the best denden-drogram on a data set is found, then the following challenges could be reached:
• The optimum data representation is given by that dendrogram.
• This way, the optimum data partition is given from one of the levels (clusterings) of such a dendrogram.
• And the optimum cluster number is also obtained from one of the clusterings of such a dendrogram.
All these challenges describe forms of knowledge discovery from the problem domain, for which, the existing clustering methods are insufficient to capture knowledge from the complex processes at cellular level.
The need of defining an extensible visualization tool of cluster analysis (extensi-ble, in the sense that new clustering methods as well as new statistical measures can be added without making meaningful changes in the tool) able to combine existing visualizations with the novel ideas of our approach, which is addressed to capitalize on added value gained from the interaction between the approaches and thus maximize the benefits to the user; it has motivated us to introduce the visual analytics part as a tool in order to reach our final goal, the evolutionary framework. Based then on the foregoing, our research hypothesis states that:
novel method of hierarchical clustering able to improve the existing hierarchical cluster-ing techniques, faccluster-ing the problem of convergence towards local optimums. This method has been given from an evolutionary computational model as a theoretical-practical re-sult of this research.
Figure 1: Evolutionary Framework for cluster analysis from DNA microarray data.
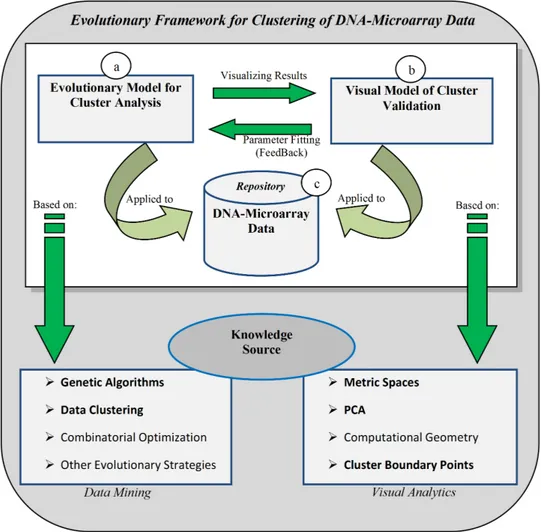
evaluating (and comparing) the results provided by the used clustering methods from the final user point of view in the context of DNA microarray data. We have introduced a visual framework based on visual analytics, where clustering methods (including our method), cluster validity measures and visual components of cluster exploration are integrated to improve the global process of cluster analysis. Figure 1 shows a general scheme of our evolutionary framework, where Figure 1-a represents the evolutionary model of clustering that setting its parameters, we obtain a specific clustering method on the data repository in Figure 1-c. This way, parameters and results are validated using the visual model in Figure 1-b. Moreover, both models in this figure are based on a well-known knowledge source. Note that our evolutionary framework has been extended to analyze any other hierarchical clustering method different from our evolutionary method in Figure 1-a. To develop our global framework as a join of an evolutionary model of clustering and a visual tool for cluster analysis, the following goals have been proposed:
• Characterizing the whole search space to obtain better understanding of the space and the relationships between the dendrograms. This allows us to introduce heuristics to improve the search process.
• Introducing an clustering evolutionary method able to find better solutions than other methods on the domain of gene expression data analysis.
• Building a visualization tool that represents the visual part of our evolutionary framework in order to verify and validate the results achieved by the clustering methods.
• Comparing our results with the ones of other methods on gene expression data, aimed at knowledge discovery from both, the data and the used methods.
Evolutionary Model and Visual Framework
Even though there are a few studies that attempt to use GAs for building hierarchical clustering, they do not include constraints that allow us to reduce the complexity of the problem. Therefore, these studies become intractable problems for large data sets. On the other hand, the deterministic hierarchical clustering methods generally face the problem of convergence towards local optimums due to their greedy strategy. The method introduced here is an alternative to solve some of the problems existing methods face.
According to the previously mentioned, the goal of this approach has been the search of clustering hierarchies of high quality on DNA microarray data. For reaching that aim, other contributions have been given, such as: a specific method (called EMHC, Evolutionary Model for Hierarchical Cluster1) from a clustering evolutionary model is
obtained by prefixing the parameters of such a model [6, 7]. This method provides a novel fitness function to evaluate dendrograms based on the cluster definition. In this context several strategies (constraints) are introduced to reduce the complexity of the search space. That is, reduction of the level number of a dendrogram based on non-valuable information, reduction of the fitness function runtime by introducing two fundamental lemmas, and the partition of the search space in neighborhoods to state differences between local and global optimum.
We have also introduced two novel genetic operators (mutation and crossover) performing an agglomerative and divisive strategy to build the child dendrograms. In order to carry out in-depth search to improve the solutions given by our method, several evolutionary strategies of local search have been built. Another important result found from our experiments is that the use a genetic algorithm is not enough to deal with the problem of finding an optimum dendrogram in the search space. Hence, we have introduced several constraints and heuristics to make our intractable problem, feasible in an approximate way. All these contributions have allowed our method to find better solutions compared to the other methods.
Finally, note that this evolutionary approach has gone further than just defining an algorithm as in other researches. The idea consists of creating an evolutionary
1
model where a set of parameters can be pre-fitted based on some criterium, so that we can obtain a concrete clustering method able to adapt to the analyzed problem, but varying those parameters we will possibly achieve a different method. Such an approach is possible thanks to evolutionary computation.
The Visual Framework
To complement our evolutionary model of clustering we have developed a visual ana-lytics framework to be used in cluster analysis from gene expression data. In addition, this visual framework has presented a novel method of finding cluster boundaries based on the theory of metric spaces. Our visual approach links a set of visualizations able to interact with parallel coordinates, cluster boundary points on a 3D scatter plot (using dimensionality reduction) and DNA microarray visualizations. Thus, it is also a visual alternative with respect to the cluster validity measures currently used. Besides that, the method of computing cluster boundary is also used to estimate the shape that a cluster has on a 3D-space, and represent reference partitions (on a 3D-space) coming from the problem domain.
This visual framework has introduced data exploration for aggregating, sum-marizing and visualizing information generated during interactive cluster analysis from DNA microarray data [8–11]. As a result of the visual part of our global framework (the evolutionary framework), we have developed a prototype tool called 3D-VisualCluster (or 3D-VC) [12], which is able to explore dendrograms, clusterings and clusters inter-actively with different views [13, 14]. This prototype usesprincipal component analysis (PCA) to reduce data dimensionality to R3, so that a first approximation of data
distribution can be analyzed on a 3D scatter plot. Furthermore, parallel coordinate visualization [15] and DNA microarray data views (heat map) have also been presented by using a color scale corresponding to gene expression levels.
This section presents the results reached in the evaluation studies of the defined evo-lutionary framework through the 3D-VisualCluster tool (3D-VC) and the proposed evolutionary method (EMHC). To do that, we have analyzed the 3D-VC reliability of providing new knowledge through its visualizations from the clustering results and the cluster validity measures applied to gene expression data. Additionally, we have studied the behavior of EMHC on three public data sets of gene expression data and compared the results with other methods according to cluster validity measures. The results of EMHC have also been analyzed with visualizations given by framework 3D-VC.
The analysis of the results have been made by detailing the scenario where 3D-VC and EMHC have been tested, that is, stating data sets, hierarchical clustering methods and cluster validation measures to use. After that, firstly, the evaluation and analysis of framework 3D-VC have been made on a practical case study. Secondly, EMHC has been evaluated from a wide number of statistical tests and visualizations given by 3D-VC.
On 3D-VC, three types of validation for the results of three hierarchical clustering methods have been completed. That is, we have validated the results using indices of internal cluster validation, using the dendrogram and microarray view, and finally by visual comparison with a reference partition of the used data set. In this context, the most meaningful clusters according to the reference partition have been identified. Moreover, a set of tasks has been defined from the views of the tool in order to introduce a methodology to follow by the user in visual cluster analysis and validation of clustering results. All this have shown the importance of the 3D-VC tool in cluster analysis of DNA microarray data2.
Furthermore, the evaluation of EMHC has been made on its genetic operators and afterwards, the goodness of the individuals generated by the evolutionary process of the method has been evaluated. After that, three sections have been given, one for each data set, dedicated to compare the results of EMHC with regard to the considered methods and using the 3D-VC tool. We can say that EMHC performs better than the others, on cluster separation measures and on measures that combine homogeneity and separation (such as, silhouette width), but it does not have the same performance on
2
homogeneity. It should be taken into account that most of the hierarchical clustering methods focus on cluster internal quality (homogeneity) and not on cluster external quality (adding separation), that is, global quality. For this reason, the other methods work better on homogeneity. However, EMHC looks for two or three indicators, homo-geneity, separation and number of genes in each cluster, so that we can check two or three objectives on the clusters at a time. What is more, the visualizations of 3D-VC have also shown that EMHC performs well and EMHC can even improve its solutions from solutions given by other methods. All these results have been possible because we have carried out a study of the complexity of the given problem (proving that PFBD is NP-complete), which allowed us to extract knowledge of the search space. This way, we have focused our efforts on finding good approximated solutions to the problem instead of trying to find a polynomial algorithm that solves the problem in a non-approximate way (that is, an algorithm running in polynomial time with respect to its input).
E
Nm´etodo de clustering jer´esta investigaci´on se propone unarquico basado en un modelo evolutivo, un conjunto deframework evolutivo donde se fusionan un medidas de validaci´on de agrupamientos (clusters) de datos y una herramienta de visualizaci´on de clusterings. El objetivo es crear un marco apropiado para la extracci´on de conocimiento a partir de datos provenientes de DNA-microarrays. Por una parte, el modelo evolutivo declustering de nuestrof rameworkes una alternativa novedosa que intenta resolver algunos de los problemas presentes en los m´etodos de clusteringexistentes. Por otra parte, nuestra alternativa de visualizaci´on declusterings, materializada en una herramienta, incorpora nuevas propiedades y nuevos componentes de visualizaci´on, lo cual permite validar y analizar los resultados de la tarea declustering. Elf rameworkpropuesto permite a su vez, disponer de un medio para comprobar la ade-cuaci´on de las medidas de validaci´on de agrupamientos. De este modo, la integraci´on del modelo evolutivo de clustering con el modelo visual de clustering, convierta a nuestro f rameworkevolutivo en una aplicaci´on novedosa de miner´ıa de datos frente a los m´etodos convencionales de aprendizaje autom´atico.Motivaci´
on, Hip´
otesis y Objetivos
Para llevar a cabo nuestra propuesta, nos hemos basado en disciplinas como la com-putaci´on evolutiva, la miner´ıa de datos y laanal´ıtica visualpara construir elf ramework sobre el dominio de datos de expresi´on g´enica. Cada una de estas ´areas proporciona t´ecnicas que juegan un papel importante en el an´alisis y resoluci´on de los retos actuales en Bioinform´atica.
inter´es en Bioinform´atica (y en gen´omica funcional) ya que ´este permite analizar niveles de expresi´on de cientos de miles de genes en una muestra de un organismo vivo. Esta caracter´ıstica hace que el an´alisis de expresi´on g´enica, sea una herramienta fundamental en la investigaci´on de la salud humana, proporcionando as´ı, un medio para identificar nuevos genes, claves en la g´enesis y desarrollo de enfermedades. Sin embargo, si bien es cierto que la exploraci´on de estos grandes conjuntos de datos es una tarea impor-tante, tambi´en es cierto que es un problema dif´ıcil. Las t´ecnicas de visualizaci´on de la informaci´on pueden ayudar a resolver el problema. La exploraci´on visual de datos, tiene un gran potencial y muchas aplicaciones de miner´ıa de datos emplean t´ecnicas de visualizaci´on para mejorar el rendimiento del an´alisis de cluster (an´alisis de agru-pamientos).
Consecuentemente, la inclusi´on del modelo evolutivo de clustering (jer´arquico) en nuestrof rameworkse debe a que la representaci´on de datos biol´ogicos en forma de un dendograma, es una de las formas de extracci´on de conocimiento. Debido a esto, si se encuentra el mejor dendograma sobre un conjunto de datos, entonces ser´ıa posible alcanzar la siguientes metas:
• La representaci´on ´optima de los datos est´a dada por ese dendograma.
• De esta manera, la partici´on ´optima de los datos estar´ıa en uno de los niveles (clusterings) de tal dendograma.
• Y el n´umero ´optimo de agrupamientos (clusters) estar´ıa tambi´en en uno de los niveles de ese dendograma.
Cualquiera de estas metas representan una forma de extraer conocimiento “pr´actico” a partir del dominio del problema, para el cual, los m´etodos declustering actuales son a´un insuficiente en la extracci´on de conocimiento de los complejos procesos ocurridos a nivel celular.
anterior, nuestra hip´otesis de investigaci´on plantea que:
El problema de encontrar el mejor dendograma sobre un conjunto de datos (que denom-inaremos PFBD), es decir, el problema de encontrar un dendograma ´optimo sobre un conjunto de datos y respecto a una funci´on objetivo que mide la calidad de los dendogra-mas, es un problema NP-completo. En consecuencia, proponemos t´ecnicas evolutivas para enfrentar dicho problema en el dominio de datos de DNA-microarrays.
Partiendo de la complejidad computacional que implica el problema PFBD, surge la segunda parte de nuestra hip´otesis de trabajo, la cual establece que bas´andonos en t´ecnicas evolutivas, podemos definir un nuevo m´etodo de clustering jer´arquico, capaz de mejorar las t´ecnicas existentes de clustering jer´arquico, las cuales presentan, en general, el problema de convergencia hacia ´optimos locales. Tal m´etodo ha sido desarrollado a partir de un modelo computacional evolutivo, siendo un resultado pr´actico-te´orico de esta investigaci´on.
Figure 2: F ramework Evolutivo para el an´alisis de cluster sobre datos de DNA-microarrays.
desarrollar el f rameworkevolutivo como uni´on de un modelo evolutivo declustering y una herramienta visual de an´alisis decluster, se propusieron los siguientes objetivos en el marco del presente trabajo de investigaci´on:
• Caracterizar el espacio de b´usqueda, para as´ı, comprender mejor el espacio y las relaciones existentes entre los dendogramas. Esto permitir´a introducir heur´ısticas que mejoren el proceso de b´usqueda.
• Construir una herramienta de visualizaci´on que represente la parte visual de nuestrof rameworkevolutivo, con el objetivo de verificar y validar los resultados alcanzados por los m´etodos declustering.
• Comparar nuestros resultados con los resultados de otros m´etodos, a partir de datos de expresi´on g´enica, todo ello dirigido a la extracci´on de conocimiento, tanto a partir de los datos como de los m´etodos empleados.
Modelo Evolutivo y Framework Visual
En esta investigaci´on se ha propuesto, como parte delf rameworkevolutivo, un nuevo m´etodo de clustering jer´arquico basado en algoritmos gen´eticos (AGs) y orientado al an´alisis de datos de expresi´on g´enica. Este m´etodo est´a sustentado sobre la de-mostraci´on formal de varios resultados te´oricos, mostrando de esta manera, su efectivi-dad respecto a otros m´etodos de clustering. En en el ´ambito de la Bioinform´atica, la aplicaci´on de los AGs al an´alisis de agrupamientos, ha revelado buenos resultados sobre datos biol´ogicos y consecuentemente, se han realizado m´ultiples estudios en este sen-tido, aunque la mayor´ıa de ellos se centran en los m´etodos declustering particionales. A´un cuando existen unos pocos estudios que intentan aplicar los AGs a la construcci´on de clustering jer´arquico, ´estos no incluyen restricciones que permitan reducir la com-plejidad del problema. En consecuencia, tales estudios se convierten en problemas intratables para grandes conjuntos de datos. Por otra parte, los m´etodos deterministas de clustering jer´arquico, presentan el problema de convergencia hacia ´optimos locales, debido al car´acter voraz de sus estrategias algor´ıtmicas. De aqu´ı que, nuestro m´etodo sea una alternativa para resolver algunos de los problemas existentes en los m´etodos de clustering actuales.
De acuerdo con lo anterior, el objetivo de este enfoque ha sido encontrar jerarqu´ıas de clusterings de alta calidad sobre datos de DNA-microarrays. Para alcanzar dicho objetivo se han realizado varias contribuciones en el marco de esta investigaci´on, tales como: la definici´on de un m´etodo espec´ıfico (llamado EMHC, modelo evolutivo para clustering jer´arquico3) construido a partir de prefijar los par´ametros de un modelo
3
evolutivo de clustering[6, 7]. Junto con este m´etodo, se define una funci´on de aptitud que eval´ua los dendogramas bas´andose en la definici´on de agrupamiento (cluster). En este contexto, se han introducido varias estrategias (y restricciones) con el objetivo de reducir la complejidad del espacio de b´usqueda. A saber, la reducci´on del n´umero de niveles de los dendogramas bas´andonos en la informaci´on no valiosa de ´estos, la reducci´on del tiempo de ejecuci´on de la funci´on de aptitud a partir de la introducci´on de dos lemas fundamentales, y la partici´on del espacio de b´usqueda en vecindades con el fin de diferenciar un ´optimo local de un ´optimo global.
Por otra lado, tambi´en hemos introducido dos nuevas versiones de operadores gen´eticos de mutaci´on y cruce, las cuales, a partir de una estrategia aglomerativa y divisiva, permiten construir los dendogramas hijos. Con el objetivo de realizar una b´usqueda en profundidad, y mejorar as´ı las soluciones encontradas por nuestro m´etodo, se han implementado tambi´en varias estrategias evolutivas de b´usqueda local. Otro resultado importante, obtenido a partir de los experimentos realizados, fue que, un algoritmo gen´etico no es suficiente para tratar con el problema de la b´usqueda de un dendograma ´optimo. En consecuencia, hemos introducido varias restricciones y heur´ısticas para transformar este problema intratable,a priori, en un problema tratable. Todas estas contribuciones han permitido que nuestro m´etodo pueda encontrar mejores soluciones que los otros m´etodos.
Finalmente, ha de hacerse notar que el enfoque propuesto ha tratado de ir m´as all´a de la mera definici´on de un algoritmo declustering. La idea ha consistido en crear un modelo evolutivo parametrizable, de modo que el establecimiento de un conjunto de par´ametros, en base a diferentes criterios, permita obtener un m´etodo declustering concreto, capaz de adaptarse al problema tratado. De este modo, variando dichos par´ametros se obtendr´a, posiblemente, un m´etodo declusteringdiferente. Tal enfoque es posible gracias a la computaci´on evolutiva.
El Framework Visual
Complementando nuestro modelo evolutivo de clustering, se ha desarrollado un com-ponente de anal´ıtica visual para su uso en la tarea del an´alisis declustersobre datos de expresi´on g´enica. Adicionalmente, en este modelo visual se ha definido un nuevo m´etodo de construcci´on de la frontera de uncluster, basado en la teor´ıa de los espacios m´etricos.
un espacio 3D (a trav´es de la reducci´on de la dimensionalidad) y visualizaciones de DNA-microarrays. Por tanto, este enfoque visual es tambi´en una alternativa respecto a las medidas de validaci´on decluster, actualmente usadas. Por otra parte, el m´etodo que calcula la frontera de un cluster se utiliza tambi´en para estimar la forma de un cluster y para representar particiones de referencias (en un espacio 3D) provenientes del dominio del problema.
De acuerdo con lo anterior, nuestro enfoque visual se ha introducido con el objetivo de agregar, resumir y visualizar, la informaci´on generada durante el proceso de an´alisis de cluster interactivo, a partir de datos de DNA-microarrays [8–11]. En-tonces, como un producto final de nuestro f ramework global (el f ramework evolu-tivo), se ha desarrollado una herramienta prototipo, llamada 3D-VisualCluster (3D-VC) [12], que permite explorar interactivamente, dendogramas,clusterings yclusters sobre diferentes vistas [13, 14]. En este prototipo, se utiliza el an´alisis de componentes principales (PCA) para reducir la dimensionalidad de los datos a R3, para de este
modo, poder realizar un an´alisis preliminar de los datos mediante una vista de puntos 3D. Adem´as, a todo esto se une las visualizaciones de coordenadas paralelas [15] y las vistas de DNA-microarrays (heat map), las cuales se generaron a partir de una escala de colores que se corresponde a los niveles de expresi´on g´enica.
Resultados y Conclusiones
En este apartado comentamos los resultados obtenidos, a partir de los estudios de evaluaci´on delf rameworkevolutivo, a trav´es de la herramienta 3D-VisualCluster (3D-VC) y del m´etodo evolutivo propuesto EMHC. Para llegar a ´esto, por una parte, se ha analizado la utilidad de 3D-VC en la extracci´on de conocimiento a partir de los resulta-dos clustering y de las medidas validaci´on declusters en los experimentos realizados sobre datos de expresi´on g´enica. Por otra parte, se estudi´o tambi´en, el comportamiento del m´etodo EMHC sobre tres conjuntos de datos p´ublicos de expresi´on g´enica y com-paramos los resultados con otros m´etodos conocidos, utilizando medidas convencionales de validaci´on de clusters. En la evaluaci´on de los resultados del m´etodo EMHC, nos basamos tambi´en, en el f rameworkvisual 3D-VC.
As´ı pues, para llevar a cabo el an´alisis de los resultados, primero, se detall´o el escenario donde se evaluar´ıan 3D-VC y EMHC, es decir, se detallaron los conjuntos de datos, los m´etodos declustering y las medidas de validaci´on declusters a utilizar. Como siguiente paso, se realiz´o la evaluaci´on y el an´alisis delf ramework 3D-VC sobre un caso de estudio pr´actico. Finalmente, se evalu´o el m´etodo EMHC, empleando un amplio n´umero de pruebas estad´ısticas y visualizaciones de la herramienta 3D-VC.
Sobre la herramienta 3D-VC, se plantearon tres escenarios de validaci´on a par-tir de los resultados obtenidos por tres m´etodos de clustering. A saber, validaci´on utilizando ´ındices internos de validez de clusters, utilizando vistas de dendogramas y microarrays (heat maps), y finalmente, comparando visualmente, los resultados con una partici´on de referencia del conjunto de datos utilizado por los tres m´etodos de clustering. En este contexto, tambi´en se identificaron los agrupamientos (clusters) m´as significativos dentro de los resultados obtenidos, desde el punto de vista de la par-tici´on de referencia. Adem´as, se defini´o un conjunto de tareas sobre las visualizaciones de la herramienta, que establecen un metodolog´ıa a seguir por el usuario en el an´alisis cluster visual y en la validaci´on de los resultados de clustering. Todo esto demostr´o la validez de la herramienta 3D-VC en el an´alisis declusters de datos provenientes de DNA-microarrays4.
Respecto al m´etodo EMHC, primero se evalu´o la validez de los operadores gen´eticos (de cruce y mutaci´on) definidos, para luego, evaluar la bondad de los individuos generados
4
comparar los resultados del m´etodo EMHC frente a los resultados obtenidos por otros m´etodos clustering bien conocidos, utilizando asimismo, la herramienta 3D-VC para este fin. De estos experimentos, se obtuvo que EMHC funcion´o mejor que los dem´as m´etodos en lo que respecta a medidas de separaci´on de clusters y medidas que com-binan, separaci´on y homogeneidad (como por ejemplo, el ancho de silueta), no siendo as´ı para medidas exclusivas de homogeneidad. En este sentido, se debe considerar que la mayor´ıa de los m´etodos de clustering centran su atenci´on en mejorar la calidad in-terna de los clusters (homogeneidad o distancia intra-cluster) y no sobre la calidad externa (considerando la separaci´on o distancia inter-cluster), que puede entenderse como una medida m´as global de la calidad del clustering. Debido a esta raz´on, los dem´as m´etodos de clustering funcionan mejor sobre medidas de homogeneidad. Sin embargo, EMHC optimiza dos o tres objetivos a la vez, como son, homogeneidad, separaci´on y n´umero de genes en cadacluster. Adem´as, las visualizaciones mediante la herramienta 3D-VC demostraron tambi´en el buen desempe˜no de EMHC en relaci´on con la mejora de soluciones previas, considerando para ello, la inclusi´on como poblaci´on ini-cial (de individuos) en proceso evolutivo de EMHC, las soluciones obtenidas mediante otros m´etodos. Todos estos resultados fueron posibles, debido al estudio realizado sobre la complejidad del problema tratado (demostrando que PFBD es NP-completo), lo que permiti´o obtener m´as conocimiento del espacio de b´usqueda, y as´ı, enfocar todos los esfuerzos en encontrar buenas soluciones aproximadas al problema en vez de intentar de encontrar un algoritmo eficiente que resuelva el problema de forma no aproximada (o sea, un algoritmo que se ejecute en tiempo polinomial respecto a su entrada).
Sin lugar a dudas, el trabajo presentado en esta memoria, no hubiese sido posible sin la orientaci´on, ayuda y experiencia de mi director de tesis, el Prof. Dr. Fernando D´ıaz G´omez. Al cual, quiero agradecer todo su esfuerzo, dedicaci´on y valor humano, emplea-dos en el desarrollo de esta investigaci´on para que la actual memoria fuese posible.
Quiero dar las gracias tambi´en a Carlos A. Garc´ıa (investigador en formaci´on de la Universidad de Salamanca), compa˜nero de doctorado, por su colaboraci´on desintere-sada y su gran ayuda en el desarrollo de la herramienta3D-VisualCluster, la cual juega un papel fundamental en esta investigaci´on.
Agradecer al Prof. Dr. Luis Alonso Romero, Universidad de Salamanca, cuyos oportunos comentarios sobre formalizar ciertos conceptos en los inicios de esta investi-gaci´on, dio un vuelco positivo a la investigaci´on hacia su avance.
Agradecer tambi´en, al Prof. Dr. Miguel A. Borges Trenard de la Universidad de Oriente (director de mi tesis de master en matem´atica), Cuba, del cual he obtenido formaci´on en el campo de las matem´aticas y me he nutrido hasta los d´ıas actuales, de su experiencia tanto en la investigaci´on como en la vida.
De mi formaci´on como doctor, agradezco las oportunas discusiones, comentarios y en su caso, ayuda, de mis compa˜neros de doctorado, en especial, Antonio Gonz´ales, Saddys Segrera, el Prof. Dr. Cristian Pinz´on, Diego A. G´omez y el Dr. Juan F. Garc´ıa, sobre diferentes temas de la investigaci´on y el doctorado.
partir del 2011) del Gobierno de Espa˜na y la Uni´on Europea, ERDF (TIN2009-14057-C03-02).
Por otra parte y a nivel afectivo, agradecerle a Mar´ıa, mi esposa y compa˜nera, su amor, paciencia, comprensi´on y ayuda a lo largo de las diferentes etapas del desarrollo de mi doctorado. De hecho, destacar su aporte en la revisi´on de la gram´atica de muchos de los textos en ingl´es, relacionados a esta investigaci´on. Al mismo nivel, agradecerle a mi querida hermana Laertys por su ayuda, suministrando apoyo, preocupaci´on y su esp´ıritu luchador, inculcado por nuestros padres, en todo mi recorrido acad´emico, incluso, desde que estuve haciendo la licenciatura. Finalmente, dar las gracias por su apoyo a mi querida familia (cubana, espa˜nola y griega), en especial a mi familia en Cuba (el resto de mis hermanos), que sin dudas ha llevado la peor parte, viviendo mi ausencia todos estos a˜nos.
Introduction
I
Nhierarchical clustering represented by an evolutionary model, a set of cluster vali-this research work, we propose an evolutionary framework where a method of dation measures and a cluster visualization tool are integrated to create a suitable environment of knowledge discovery from DNA microarray data. On one hand, the clustering evolutionary model of our framework is a novel alternative that attempts to solve some of the problems faced by the existing clustering methods. On the other hand, our alternative (for cluster visualization) given by a tool couples new properties and visual components, allowing us to validate and analyze clustering results. It also creates a visual checking environment for cluster validity measures. This way, the fu-sion of the clustering evolutionary model with the cluster visual module becomes our framework a novel application of data mining compared to the conventional methods of machine learning.According to the all above, we have focused our efforts on the combination of areas such as evolutionary computation, data mining andvisual analytics to build the framework on the domain of gene expression data. Each of these areas provides tech-niques that play a major role for the analysis and resolution of the current challenges inBioinformatics.
2 1.1. Motivation
providing optimization processes that are usually applied to very large, complex and multidimensional search spaces.
The application of evolutionary algorithms to data mining is still of great impor-tance in classification problems. Particularly, we can highlight, the use of evolutionary strategies to unsupervised classification in the knowledge discovery process. Cluster analysis as an unsupervised classification task is part of machine learning as well as a way of finding out structures on the data of a given problem. Classification of similar objects into groups is an important task of human activity, being part of daily learning process.
In recent years, there has been a growing interest in applying evolutionary, clus-ter analysis and visualization techniques to Bioinformatics, which is one of the most controversial areas of research at present, since it deals with the development and/or ap-plication of methods and algorithms to turn biological data into knowledge of biological systems, often requiring further experimentation from initial data [38].
Consequently, the study of gene expression data from DNA microarrays is of great interest for Bioinformatics (and functional genomics), because it allows us to simultaneously analyze expression levels from hundreds of thousands of genes in a living organism sample. This feature makes gene expression analysis a fundamental tool of research for human health. It provides identification of new genes that are key factors in the genesis and development of diseases. However, the exploration of these large data sets is an important yet difficult problem. Information visualization techniques can help to face this problem. Visual data exploration has high potential and many applications in data mining use information visualization technology for an improved data analysis.
In conclusion, the present research has been motivated by all issues previously raised, providing a starting point to state the research hypothesis. This chapter ad-ditionally introduces the global motivation, evolution and structure of this research work.
1.1
Motivation
these databases in order to understand the relationship between their items. Traditional approaches are oriented to discover evolutionary relationships between genes or proteins by analyzing their sequence and structure similarities [13].
Future work involves the tight integration of visualization techniques with tra-ditional techniques from disciplines asstatistics, machine learning, operations research and simulation. Integration of visualization techniques within these more established methods would combine fast automatic data mining algorithms with the intuitive power of the human mind, improving the quality and speed of the visual data mining pro-cess [14].
Moreover, it is known that gene expression data generated by microarray exper-iments provide tremendous potential for advances in molecular biology and functional genomics. According to that, there is a great number of clustering algorithms applied to the analysis of DNA microarray data. However, most of them only provide a crisp set of clusters and may not be flexible to different user requirements on cluster gran-ularity for different subsets of the data [137]. Evolutionary methods are more flexible with respect to the above problems, due to both, their non-deterministic nature that allows them to find more than one solution to the same problem, and their ability to consider user requirements.
Consequently, the part of the clustering evolutionary model of our framework is motivated by the fact that the biological data representation in the form of a dendro-gram is one of the ways of knowledge discovery. Due to this, if the best dendrodendro-gram on a data set is found, then the following challenges could be reached:
• The optimum data representation is given by that dendrogram.
• This way, the optimum data partition is given from one of the levels (clusterings) of such a dendrogram.
• Consequently, the optimum cluster number is also obtained from one of the clus-terings of such a dendrogram.
All these challenges describe forms of knowledge discovery from the problem domain, for which, the existing clustering methods are insufficient to capture knowledge from the complex processes at cellular level.
4 1.2. Research Hypothesis
statistical measures can be added without making meaningful changes in the tool) able to combine existing visualizations with the novel ideas of our approach, addressed to capitalize on added value gained from the interaction between the components and thus maximize the benefits to the user. All these issues motivated us to introduce the visual analytics part as a tool addressed to reach our final goal, the evolutionary framework. Therefore, based on the success of the evolutionary techniques applied to cluster analysis from DNA microarray data, and the benefits obtained by their integration with information visualization techniques; this research proposes an evolutionary hi-erarchical clustering method that combined with a cluster visualization tool, builds a framework able to improve the results given from other hierarchical clustering methods and provides new visualization components to explore and validate clustering results.
1.2
Research Hypothesis
Starting from the premises given in the above section, we can state our research hy-pothesis as follows:
The problem of finding the best dendrogram on a data set (denoted as PFBD), that is, the problem of finding an optimum dendrogram from a data set, according to an objective function measuring the dendrogram quality is an NP-complete problem. In consequence, we propose evolutionary techniques to face it on the domain of DNA mi-croarray data.
According to the computational complexity shown by PFBD, arises the second part of our hypothesis, which states that based on evolutionary techniques, we can define a novel method of hierarchical clustering able to improve the existing hierarchi-cal clustering techniques, which face the problem of convergence towards lohierarchi-cal opti-mums. This method is given by an evolutionary computational model in Chapter 6 as a theoretical-practical result.
Figure 1.1: Evolutionary Framework for cluster analysis from DNA microarray data.
6 1.2. Research Hypothesis
evaluating (and comparing) the results provided by the current clustering methods from the end user point of view in the context of DNA microarray data. We have introduced a visual framework based on visual analytics techniques, where clustering methods (including our method), cluster validity measures and visual components of cluster exploration are integrated to improve the global process of cluster analysis. Figure 1.1 shows a general scheme of such an evolutionary framework, where Figure 1.1-a represents the evolution1.1-ary model of clustering which by setting its p1.1-ar1.1-ameters, gives us a specific clustering method for a data set stored in our repository in Figure 1.1- c. This way, parameters and results are validated using the visual model in Figure 1.1- b. Moreover, both models in this figure are based on a well-known source of knowledge. Note that this framework can be extended to analyze any other hierarchical clustering method different from our evolutionary method.
The definition and theoretical results of this visual framework are given in Chap-ter 7. According to this, the global reliability of the visual framework and the evaluation of the introduced evolutionary method (both form the evolutionary framework) from DNA microarray data are empirically proven in Chapter 8. Based then on all fails previously explained, the following goals will be met:
• Characterizing the whole search space to obtain better understanding of the space and the relationships between the dendrograms. This allows us to introduce heuristics to improve the search process.
• Introducing a clustering evolutionary method able to find better solutions than other methods on the domain of gene expression data analysis.
• Building a visualization tool that represents the visual part of our evolutionary framework in order to verify and validate the results achieved by any clustering method.
1.3
Research Evolution
This research had its starting point on the results and experiments concluded from the implementation of a genetic algorithm for data clustering given in [46], which was applied to DNA microarray data. Although in this case, good results were achieved on the studied data set, this algorithm presented several drawbacks requiring improvement in such a way that it can perform on larger data sets.
Therefore, the above work has successively been improved and validated through a series of contributions presented in conferences and published in journals (see Ap-pendix A). Each of these works meant an improvement of our global research. The first step was to study the nature of the problem from the theoretical point of view, for which we introduced constraints and new properties to improve the performance on DNA microarray data. Another important consequence of the study above was to change the previous approach (build a genetic algorithm for hierarchical clustering) by the one that studiesthe problem of finding the best dendrogram on a data set. This last study allowed us to characterize (and understand) the search space and so, define a new evolutionary model of cluster analysis in such a way that by setting its parameters, we can obtain a specific method.
In particular, the inclusion of the neighborhood concept, the reduction of the size of the dendrograms based on non-valuable information (noise) and the reduction of the computation complexity of the used objective function, allowed us to introduce new heuristics that improved the search process and the effectiveness of the genetic operators of our current evolutionary method, yielding high quality dendrograms from DNA microarray data. The implementation of the evolutionary model has been carried out on R Project [16] and is publicly available at http://cran.r-project.org/web/ packages/clustergas.
8 1.4. Outline
1.4
Outline
The present work has been divided into nine chapters plus several appendices, for which the first chapter brings, in general aspects, the problems to solve, the starting hypothesis with the goals and the evolution stages of this research, concluding with the organizational structure in this PhD Thesis.
Chapter 2 deals with microarray technology, development stages and its chal-lenges. This chapter gives an introduction to DNA microarray data analysis. Further-more, we give a literature review of the available main sources of biological knowledge and their use for the interpretation of results from DNA microarray data.
Chapter 3 outlines domain, metric and representation of the data before dealing with clustering methods. It defines the concepts of clustering, hierarchical clustering, clustering method, cluster validity and the importance of visualizing the results. We finally give a literature review describing the existing clustering and visualization tech-niques used for the interpretation of results from DNA microarray data.
Chapter 4 deals with concepts, principles and problems when we model a given problem with evolutionary algorithms. It describes the main goal of an optimization process according to the use of genetic algorithms as well as tips to improve their performance. We also give a literature review of evolutionary algorithms applied to hierarchical clustering analysis from DNA microarray data.
Note that at the end of the previous theoretical chapters, that is, Chapters 2, 3 and 4, we have made a literature review about the addressed subject from DNA mi-croarray data. This is very important since the reader can contrast the contributions and drawbacks of the existing techniques with regard to our proposal.
Chapter 5 states the first contribution of this work, namely, the fundamental theorem of this research based on our hypothesis. As a consequence of this theorem, we provide the characterization, understanding and complexity of the dendrogram search space, to finally give formal proof of the fundamental theorem. All these results will be of great importance for the following chapters.
As a result of Chapter 5 and the second part of our hypothesis, Chapter 6 defines an evolutionary computational model for hierarchical clustering analysis, which will be applied to DNA microarray data.
defines two algorithms, one to compute the boundary points of a cluster and the another one, to reconstruct 3D cluster surfaces. Both algorithms will be used later in visual cluster analysis. At the end of the chapter, we give an overview of the visualizations that this visual model provides and details of its implementation.
Chapter 8 shows the results of this research on DNA microarray data (results of the evolutionary framework). It presents the data sets of DNA microarrays and the hierarchical clustering methods used to generate the results. On one hand, we present the visual components coupled to our evolutionary framework, which are integrated as a tool of visual cluster analysis. The reliability of this tool is shown from a practical case. On the other hand, we show the results and discussion of our evolutionary clustering method, supporting us on such a visualization tool.
The conclusions of this research are presented in Chapter 9. We comment the results achieved from the experiments and their repercussion in the analysis of DNA mi-croarray data. We also explain the reached goals and the future lines of this work.
Microarray Technology and its
Challenges
D
atacomplete genome sequences as well as the human genome were published. Onemining and functional genomics have recently gained attention since several of the most advanced and challenging way of studying molecular events is the monitoring of gene expression patterns from DNA microarrays. Microarrays can view as a type of device (a chip) in which, a large number of diverse entities, such as peptides, oligonucleotides, biological molecules, cells, tissues, etc., are located on its surface in an ordered and accurate way. Once these entities are attached on the surface of the chip, they can simultaneously be evaluated in a single assay.DNA microarrays allow to attach hundreds of thousands of DNA fragments ( de-oxyribonucleic acid) with determined sequences, on specific and defined positions of their surfaces. This kind of microarray is primarily used in differential gene expression studies (that is, the comparison of the genes that express a tissue affected by some kind of disease with respect to healthy tissue). This way, expression profiles of samples can be obtained with a prognostic capacity.
12 2.1. Measuring mRNA Levels
important biological processes and across collections of related samples. So, DNA mi-croarrays are able to observe at the same moment and in response to the same stimulus, the gene expression levels of many genes under different samples.
This chapter presents a description of DNA microarray technology as well as a general vision of the related knowledge sources and their use. To do this, we first introduce DNA microarray technology explaining the manufacture process, technical characteristics and the different types of microarrays. Thereafter, we explicate the in-formation processing and the analysis techniques most commonly applied on DNA mi-croarrays. Through DNA microarrays are obtained the experimental data on which the framework proposed in this work is applied.
2.1
Measuring mRNA Levels
In contrast to the traditional approaches of genomic research, which focus on the lo-cal examination and collections of single genes, microarray experiments can monitor expression levels for tens of thousands of genes in parallel. The two types of DNA microarrays most commonly used are: cDNA microarrays (complementary DNA [168]) andoligonucleotide arrays(abbreviated oligo chip [212]). Both microarray types involve three basic processes in their implementations [238]:
• Chip confection: a microarray is formed by a solid basis of an area less than 20cm2
• Target preparation, labeling, and hybridization: typically, two mRNA samples, a test sample and a control sample (more than two samples for oligo chips) are reverse transcribed into cDNA (targets). Afterwards, these samples are labeled using either fluorescent dyes or radioactive isotopics, and then hybridized with the complementary sequences on the surface of the chip (see Figure 2.2). In a multi-step process, researchers extract RNA from the sample and make millions of copies. Copying the RNA allows it to be more easily detected on the array. The entire prepared RNA sample is washed over the array for 14 to 16 hours allowing that the hybridization occurs. The number of molecules involved in this wash is staggering. There are millions of copies of each DNA probe in every square on the chip. All of the RNA strands from expressed genes are swimming around, looking for their perfect molecular complement on the array. Note that if many target polynucleotides hybridize to complementary cDNA probe strands at one spot on the array then the fluorescent signals emitted and detected at that spot will have greater intensity.
• Scanning process: Chips are scanned to read the signal intensity that is emitted from the labeled and hybridized targets (Figure 2.3). Through this process we can measure how much of RNA strands have stuck to the DNA probe on the array. If a gene is highly expressed, many RNA molecules will stick to the probe, and the probe location will shine brightly when the laser hits it. If a gene was expressed at a lower level, less RNA will stick to the probe, and by comparison, that probe location will be much dimmer when it is hit with the laser.
14 2.1. Measuring mRNA Levels
Figure 2.1: a) displays a GeneChip array of Affimetrix and b) displays the grid surface of it, where DNA probes of known sequences are attached.
Figure 2.3: a) displays the intensity levels (through colors) captured by grids of some genes after the hybridization. b) displays the resulting image of the whole microarray from the scanning process.
2.2
Gene Expression Data Preprocessing
One experiment from a DNA microarray typically, evaluates a large number of DNA sequences (genes, cDNA clones, or expressed sequence tags) under multiplies conditions. These conditions may be a time series during a biological process (e.g., the yeast cell cycle) or a collection of different tissue samples (e.g., normal versus cancerous tissues). In this research, cluster analysis is made without considering distinctions between the types of DNA sequences, which are called genes. Similarly, the conditions uniformly refer to all kinds of experimental conditions, called samples or simplyconditions.
A gene expression data set from a microarray experiment is represented through a matrix of real valuesM ={wij/ 1≤i≤n,1≤j≤m}, calledgene expression matrix, wherenis the number of genes evaluated formsamples. RowsG={~g1, ~g2, . . . , ~gn}form the expression patterns of genes, columnsS ={~s1, ~s2, . . . , ~sm}represent the expression profiles of samples and every cellwij is the measured expression level of geneiin sample j, as shown in Figure 2.4.
16 2.3. Clustering for Gene Expression Data Analysis
Figure 2.4: Gene expression matrix of a microarray.
Thus, it is indispensable before any cluster analysis can be performed, to carry out a data preprocessing [8, 35, 100, 122, 134, 241].
2.3
Clustering for Gene Expression Data Analysis
Clusteringis the process of partitioning a data set into disjoint classes, which are called clusters. Thus, objects within a cluster are more similar than objects located in different clusters. Clustering carries out a unsupervised task, which means that it does not rely on predefined classes and training examples while classifies the data objects. The issue about clustering is addressed in more details in the next chapter.
approaches [20, 107].
2.4
Clustering Categories of Gene Expression Data
Currently, one microarray experiment, approximately includes between 103 and 106
genes. However, the number of samples involved in a microarray experiment is generally less than 100. One of the main characteristics in gene expression data is its capacity of carrying out clusterings of both genes and samples. Coexpressed genes can group in clusters based on their gene expression patterns [33,86]. In agene-based clustering, the genes are considered as the objects to make clusters, while the samples are treated as the features of these objects.
In contrast to gene-based clustering, the samples can also be partitioned into homogenous clusters. Then, each cluster may be related to some particular macroscopic phenotype, such as a clinical syndrome or some cancer type [107]. Hence, sample-based clustering treats the samples as the objects and the genes as the features.
The distinction between gene-based and sample-based clustering is focused on different characteristics of clustering tasks for gene expression data. Both types of clusterings look for exclusive and exhaustive partitions of objects that share the same feature space (genes or samples). Nevertheless, criteriums from molecular biology state thatonly a small subset of genes participate in any cellular process of interest and that a cellular process takes place only in a subset of the samples [137]. This belief leads to the emergence of subspace clustering (or biclustering), which captures clusters from a subset of genes under a subset of samples.
18 2.4. Clustering Categories of Gene Expression Data
2.4.1 Gene-based Clustering
This subsection discusses the clustering problem of genes through their expression levels. The aim of gene-based clustering is to group together coexpressed genes, indicating cofunction and coregulation. So that the challenges of this approach, which are still open problems [137] are focused on:
1. Clustering analysis is typically the first task in data mining and knowledge dis-covery. The purpose of gene expression data clustering is disclosing the natural structure of data and so, to obtain an initial understanding from data distribu-tion. Thereby, a good clustering algorithm should depend as little as possible on prior knowledge, which is usually not available before cluster analysis.
2. Since gene expression data coming from complex procedures of microarray exper-iments, often contains a huge amount of noise; a clustering algorithm for gene expression data should be able to extract valuable information from the high noise level in the data.
3. Empirical studies [135,136] have shown that gene expression data are oftenhighly connected, and clusters may be highly intersected with each other or even em-bedded one in another. Hence, algorithms for gene-based clustering should be capable of suitably handling this situation.
4. A clustering algorithm apart of partitioning gene expression data, should provide some graphic representation of the cluster structure. In that way, an algorithm would be more favored by the biologists. Because, users of microarray data could not only be concerned to the gene clusters, but also be concerned to the existing relationship between the clusters, and the relationship between the genes within the same cluster. Namely, which clusters are either closer or more remote to each other and on the other side, which gene can be considered as the representative of a cluster and which genes are at the boundary area of a cluster.