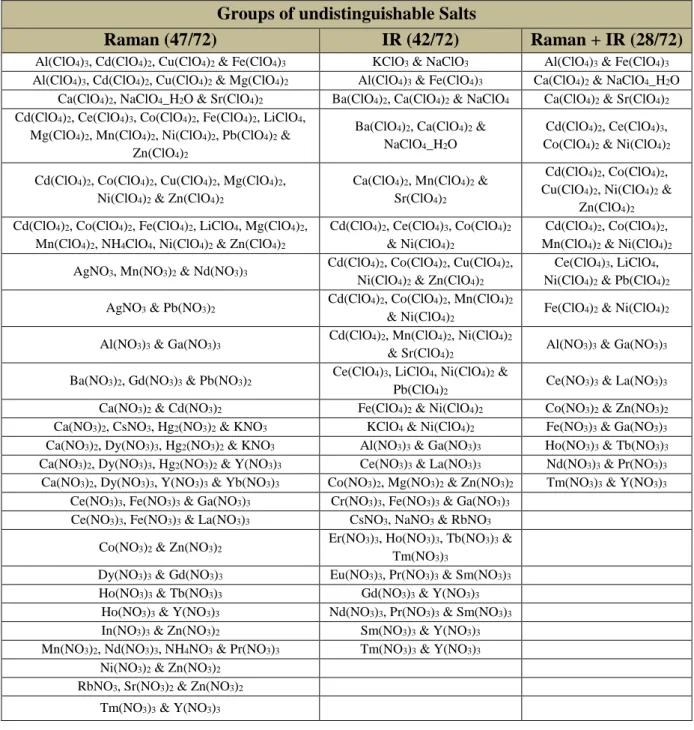
The discrimination of 72 nitrate, chlorate and perchlorate salts using IR and Raman spectroscopy
Texto completo
Figure
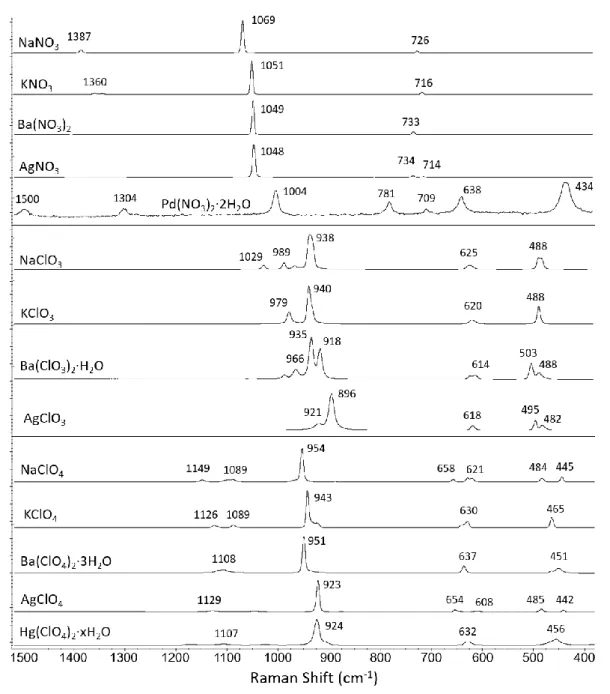
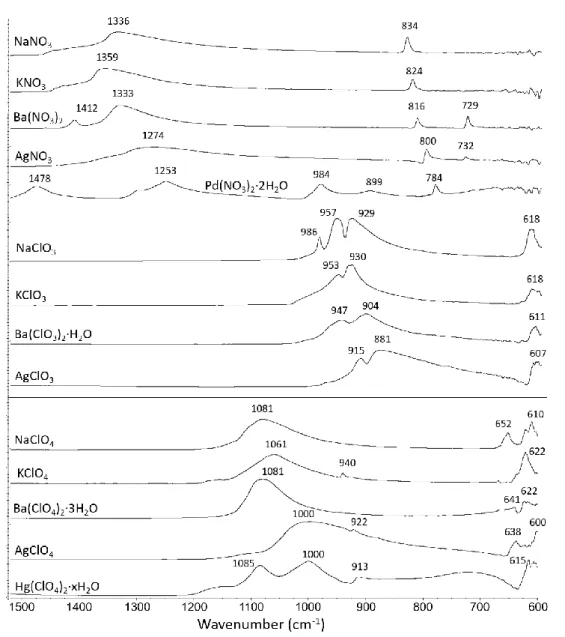
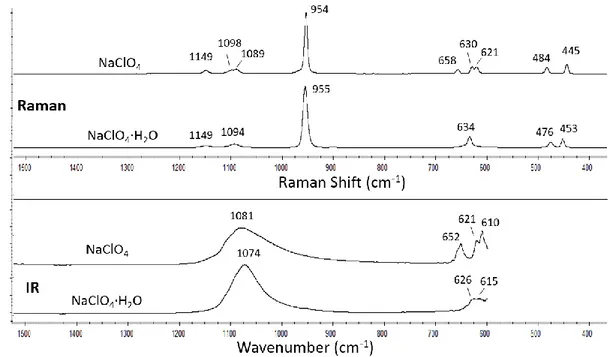
![Table 1. Vibrational modes of nitrates, chlorates and perchlorates [25-27] and the experimental Raman and IR ranges within which were located in this study](https://thumb-us.123doks.com/thumbv2/123dok_es/7337089.360241/14.892.101.795.456.824/table-vibrational-nitrates-chlorates-perchlorates-experimental-raman-located.webp)
Documento similar
It is well-known that the addition of salting-out species to aqueous media, like inorganic or organic salt ions, leads to a decrease on the solubility of hydrophobic ILs in water
· En el artículo “Characterization of macadamia and pecan oils and detection of mixtures from other edible seed oils by Raman spectroscopy” se caracterizan por Raman
chart of diameter distribution of ox-MWCNTs (black) and ox-MWCNTs@i-POP hybrids (red) measured from SEM, TEM and AFM images. a) Raman spectra showing the vibrational structure of
Ex situ Raman experiments were carried out by confocal Raman spectroscopy of the modified gold electrode surfaces immersed in the appropriated solution before and after
In the previous sections we have shown how astronomical alignments and solar hierophanies – with a common interest in the solstices − were substantiated in the
Blodgett (LB) transfer of the colloidal monolayer, (b) reactive ion etching (RIE), (c) plasma sputtering of Au, and (d) lift-off and surface enhanced Raman spectroscopy
Oxidation of the anion leads to the formation of reaction intermediates and final products (Figure 3). Concentrations of a) chlorate (black symbols) and perchlorate (white symbols)
This Raman image is colour-coded, where the intensity of the colour is correlated with the Raman intensity of three different bands: the A 1g mode of spinel Co 3 O 4 oxide (solid
