Non intrusive load monitoring techniques for activity of daily living recognition
205
0
0
Texto completo
(2)
(3)
(4) UNIVERSIDAD DE ALCALÁ ESCUELA POLITÉCNICA SUPERIOR. Programa de Doctorado en Electrónica Sistemas Electrónicos Avanzados. Sistemas Inteligentes. Doctoral Thesis. Non-Intrusive Load Monitoring techniques for Activity of Daily Living recognition. José Manuel Alcalá Orzáez. 2017.
(5)
(6) UNIVERSIDAD DE ALCALÁ ESCUELA POLITÉCNICA SUPERIOR. Programa de Doctorado en Electrónica Sistemas Electrónicos Avanzados. Sistemas Inteligentes. Non-Intrusive Load Monitoring techniques for Activity of Daily Living recognition. Author José Manuel Alcalá Orzáez. Supervisors Dr. Jesús Ureña Ureña Dr. Álvaro Hernández Alonso 2016 Doctoral Thesis.
(7)
(8) Resumen Entre los grandes desafíos de nuestra era, los que despiertan mayor interés, se puede destacar aquellos que son consecuencia directa del desarrollo de nuestra sociedad y de su sobrepoblación: el cambio climático, falta de recursos energéticos y el envejecimiento de la población. Respecto a los dos primeros, la demanda de energía es cada vez mayor y, en pocos años, ésta será superior a la producida. Por tanto, no sólo es necesario la sustitución de combustibles fósiles por energías limpias y renovables, sino también su consumo y distribución eficiente. De esta idea nace en la primera década de este siglo el concepto de Smart Grids. Numerosos países comienzan a realizar despliegues masivos de contadores inteligentes ("Smart Meters"), lo que despierta el interés de un gran número de investigadores que comienzan a desarrollar nuevas técnicas para predecir la demanda y promover la eficiencia. Entre ellas destacan los sistemas NILM (Non-Intrusive Load Monitoring) por el gran interés que han despertado. Éstos tratan de predecir qué dispositivos hay conectados y qué están consumiendo a partir de un único sensor: el contador inteligente. Sin embargo, el interés que despierta NILM entre investigadores y compañías eléctricas no es correspondido por los consumidores finales; quienes no encuentran beneficio al ahorro energético en sus facturas, en su mayor parte estancadas por tasas y tarifas fijas. Por otra parte, los grandes avances en la medicina moderna han permitido que nuestra esperanza de vida aumente considerablemente. No obstante, esta longevidad, junto con la baja fertilidad en los países desarrollados, tiene un efecto secundario: el envejecimiento de la población. Unos de los grandes avances es la incorporación de la tecnología en la vida cotidiana, lo que ayuda a los más mayores a llevar una vida independiente. El despliegue de una red de sensores dentro de la vivienda permite su monitorización y asistencia en las tareas cotidianas. Sin embargo, son intrusivos, no escalables y, en algunas ocasiones, de i.
(9) ii. Resumen. alto coste, por lo que no están preparados para hacer frente al incremento de la demanda de esta comunidad. Esta tesis doctoral nace de la motivación de afrontar estos problemas y tiene dos objetivos principales: lograr un modelo de monitorización sostenible para personas mayores y, a su vez, dar un valor añadido a los sistemas NILM que despierte el interés del usuario final. Con este objetivo, se presentan nuevas técnicas de monitorización basadas en NILM, aunando lo mejor de ambos campos. Esto supone un ahorro considerable de recursos en la monitorización, ya que únicamente se necesita un sensor: el contador inteligente; lo cual da escalabilidad a estos sistemas. Las contribuciones de esta tesis se dividen en dos bloques principales. En el primero se proponen nuevas técnicas NILM optimizadas para la detección de la actividad humana. Así, se desarrolla una propuesta basada en detección de eventos (conexiones de dispositivos) en tiempo real y su clasificación a un dispositivo. Con el objetivo de que pueda integrarse en contadores inteligentes. Cabe destacar que el clasificador se basa en modelos generalizados de dispositivos y no necesita conocimiento específico de la vivienda. El segundo bloque presenta tres nuevas técnicas de monitorización de personas mayores basadas en NILM. El objetivo es proporcionar una monitorización básica pero eficiente y altamente escalable, ahorrando en recursos. Los procesos Cox, log Gaussian Cox Processes (LGCP), monitorizan un único dispositivo si la rutina está estrechamente ligada a este. Así, se propone un sistema de alarmas si se detectan cambios en el comportamiento. LGCP tiene la ventaja de poder modelar periodicidades e incertidumbres propias del comportamiento humano. Cuando la rutina no depende de un único dispositivo, se proponen dos técnicas: una basada en gaussianas mixtas, Gaussian Mixture Models (GMM); y la otra basada en la Teoría de la Evidencia de Dempster-Shafer (DST). Ambas monitorizan y detectan deterioros en la actividad, causados por enfermedades como la demencia y el alzhéimer. Únicamente DST usa incertidumbres que simulan mejor el comportamiento humano y, por tanto, permite alarmas en caso de un repentino desvío. Finalmente, todas las propuestas han sido validadas mediante la evaluación de métricas y la obtención de resultados experimentales. Para ello, se han usado medidas de escenarios reales que han sido recopiladas en bases de datos. Los resultados obtenidos han sido satisfactorios, demostrando que este tipo de monitorización es posible y muy beneficioso para nuestra sociedad. Además, se ha dado a lugar nuevas propuestas que serán desarrolladas en el futuro..
(10) Abstract Among the great challenges of this era, those that raise the most interest, it can be highlighted those that are direct consequence of the development of our society and its overpopulation: the climate change, the lack of energy resources and the ageing population. With regard the two first challenges, the energy demand is dramatically increasing and it is envisaged that, in a matter of a few years, it will overcome the produced one. It is, hence, not only necessary to replace fossil fuels with clean and renewable energy, but also to reach an efficient energy consumption and distribution. Thus, the Smart Grid concept emerges from this idea during the first decade of this century and, since then, many countries have been largely rolling out Smart Meters to achieve this milestone. This fact is bringing in the interest of a large number of researchers who are devising new techniques to predict the demand and to promote efficiency. NILM (Non-Intrusive Load Monitoring) is among them and it is raising a great interest. It tries to foresee what devices are plugged and how much they are consuming from a single sensor: the Smart Meter. However, the motivation in NILM between researchers and electricity companies is not corresponded by end-consumers, who find no benefit on their bills from energy savings, mostly leveraged by taxes. Moreover, great achievements in the modern medicine is leading to a significant life expectancy incresing. Nonetheless, this longevity, along with low fertility in developed countries, entails a side effect: the ageing population. One of the greatest reached milestones is the technology integration in the daily life, which supports the elderlies to lead an independent life. The deployment of a sensor network within the household allows monitoring and assistance in everyday tasks. Although, they are not prepared to cope with the increasing demand of this community as they are intrusive, not scalable and, in cases, expensive. iii.
(11) iv. Abstract. This doctoral thesis is born from the motivation to address these issues. It has two main objectives: the achievement of a sustainable monitoring model for elderlies and, in turn, to give an added value to NILM that awakes the interest of the end-consumer. To this end, novel monitoring techniques based on NILM are presented, combining the best of both domanins. This represents considerable savings in monitoring resources since it only uses a sensor: the Smart Meter. Hence, scalability is at reach. The contributions of this Thesis are organised in two blocks. The first introduces new event-based NILM algorithm optimised for human activity detection. The proposal detects events in real time, such as appliance swithing-on; and it classifies them into appliance types, all aimed to be integrated in a Smart Meter. It is worth noting that the classifier is based on general models of appliance types and, hence, it does not need specific knowledge about household. It is an unsupervised training method and, consequently, it can be trained offline and loaded into Smart Meter memories at once for all households. Concerning the second block, three novel activity monitoring techniques for elderlies are presented. They are based on NILM and they use the appliance usage patterns to infer the human activity. The aim is to provide basic but efficient and highly scalable monitoring, saving resources during the deployment. Thus, the log Gaussian Cox Processes (LGCP) approach monitors a single appliance, in case the daily routine is strongly correlated to it. It implements an alarm system whether a rapid pattern deviation is detected. LGCP has the advantage of being able to model periodicities and uncertainties inherent to the human behavior. Whenever the routine does not depend on a single appliance, two techniques are proposed: the Gaussian Mixture Model (GMM) and the Dempster-Shafer Theory (DST) approach. Both monitor and detect deteriorations in the activity, possibly caused by diseases such as dementia and Alzheimer’s disease. Nevertheless, only the DST approach simulate uncertainties, due to the human’s free will, and, therefore, it allows to trigger alarms in case of a sudden pattern deviation in the behavior. All proposals have been validated by the evaluation of metrics and the obtaining of experimental results. To this end, real household measurements have been used, which have been collected in datasets. Satifactory results have been obtained, proving that this type of monitoring is feasible and very beneficial to our society. In addition, this thesis has yielded new proposals to be addressed in the future..
(12) A mis padres y hermano, y en especial, a Paloma y al pequeño ratoncín que está por llegar.. You do not really understand something unless you can explain it to your grandmother Ernest Rutherford.
(13)
(14) Agradecimientos En primer lugar, me gustaría agradecer a mis directores de tesis Jesús Ureña y Álvaro Hernández por su inestimable apoyo a lo largo de toda la tesis. Desde mis comienzos como becario, Jesús me ha dado la oportunidad de realizar este doctorado y ha sabido guiarme con maestría a la vez que darme la libertad para explorar nuevos campos. Álvaro ha sido clave en los momentos difíciles, donde me encontraba atascado y donde gracias a sus consejos y ánimos he conseguido avanzar. Sin lugar a dudas, he tenido suerte, pues no se me ocurren mejores directores para formarme como investigador. A mis padres Sebastián y Guadalupe quienes gracias a su apoyo y a su cariño incondicional me encuentro aquí. Podría decir sin equivocarme que la mitad del mérito es suyo. Me gustaría parafrasear la siguiente expresión: "con fuerza de voluntad y constancia todo se consigue". A mi hermano Jorge quien me ha visto crecer y ha influido tan positivamente en mi vida dándome tan buenos momentos. A Paloma, simplemente decirte: "bendito el lugar y el motivo de estar ahí, bendita la coincidencia..." To Victor Cionca who introduces me to Python and the Linux world during my first international research stay in Cork. To Alex Rogers and Oliver Parsons who collaborate to devise the LGCP algorithm presented in Chapter 5 and provide an excellent guidance during my international research stay in Southampton. I learned all I know of Pandas from Oli. Remember: "Do the hat!" A mis compañeros y al profesorado de la Universidad de Alcalá. En especial a Juan Jesús García por introducirme en la teoría de Dempster-Shafer y a David Gualda por ayudarme vii.
(15) viii. Agradecimientos. siempre con el papeleo, por las numerosas veces que me ha recogido a mi llegada del AVE y por todos esos buenos ratos en el fondo 31 junto con Pablo. También a Jorge por instruirme en el uso del cluster y otras herramientas muy útiles. Al resto de mis compañeros: siempre recordaré las míticas cenas de los viernes. A Lucía Palacios por ayudarme con la bibliografía, por ser una gran amiga durante todos estos años y por saber sacarme siempre una sonrisa. A mi abuela y a mi tío Fali, quien me ayudó con el montaje del sistema de monitorización. Aunque no he conseguido explicar la tesis a mi abuela, al menos he conseguido convencerla de que dejar "la lucecita" encendida durante la noche no va a quemar la casa. A Chelu Martin por introducirme en la Universidad de Alcalá y por ser el mejor amigo y compañero de piso que se puede tener. También a Lubna por esos buenos ratos bebiendo un Verdejo. Finalmente, aunque no menos importante, a todos aquellos amigos que me han soportado y me han dado tanto buenos momentos. En granada en las fiestas de pre-nochevieja con Lucía, Carlos, Macius, Marina y demás "criaturas". En los reencuentros con Javi, Juan, David, Víctor y demás "colegas". En Madrid con Lizette, Víctor y Mariajosé. En el extranjero con Bruno, Lorna, Levi, Eoin, Laura y Cecilia. Para concluir, me gustaría incluir la siguiente figura que dice mucho de la temática de esta tesis y resume estos duros pero gratificantes años de trabajo.. Acknowledgement disaggregation Procastination Friends Int. research stays Mentorship Family support Total. Thesis timelime.
(16) Contents. 1 Introduction. 1. 1.1. Overview . . . . . . . . . . . . . . . . . . . . . . . . . . . . . . . . . . . . .. 1. 1.2. Thesis framework. . . . . . . . . . . . . . . . . . . . . . . . . . . . . . . .. 5. 1.3. Thesis outline . . . . . . . . . . . . . . . . . . . . . . . . . . . . . . . . . .. 7. 2 State Of the Art 2.1. 11. Energy disaggregation . . . . . . . . . . . . . . . . . . . . . . . . . . . . . 11 2.1.1. Definition of energy disaggregation . . . . . . . . . . . . . . . . . . 11. 2.1.2. Evolution of NILM . . . . . . . . . . . . . . . . . . . . . . . . . . . 13. 2.1.3. NILM algorithms . . . . . . . . . . . . . . . . . . . . . . . . . . . . 15 2.1.3.1. Low-Frequency NILM algorithms . . . . . . . . . . . . . . 20. 2.1.3.2. High-Frequency NILM algorithms . . . . . . . . . . . . . . 27 2.1.3.2.1. Normalization . . . . . . . . . . . . . . . . . . . . . . . . . . . 27. 2.1.3.2.2. Event detection . . . . . . . . . . . . . . . . . . . . . . . . . . . 27. ix.
(17) x. Contents. 2.2. 2.1.3.2.3. Load Signature(LS) . . . . . . . . . . . . . . . . . . . . . . . . . . . 29. 2.1.3.2.4. Load signature identification . . . . . . . . . . . . . . . . . . . . . . . . . . . 33. 2.1.4. A new perspective for NILM . . . . . . . . . . . . . . . . . . . . . . 35. 2.1.5. Resources for NILM . . . . . . . . . . . . . . . . . . . . . . . . . . 37 2.1.5.1. Hardware resources . . . . . . . . . . . . . . . . . . . . . . 37. 2.1.5.2. Open Software . . . . . . . . . . . . . . . . . . . . . . . . 39. Activity Monitoring in Elderlies . . . . . . . . . . . . . . . . . . . . . . . . 40 2.2.1. Sustainability challenge in modern healthcare systems . . . . . . . . 40. 2.2.2. Healthcare monitoring systems. 2.2.3. . . . . . . . . . . . . . . . . . . . . 41. 2.2.2.1. Direct methods . . . . . . . . . . . . . . . . . . . . . . . . 43. 2.2.2.2. Indirect methods . . . . . . . . . . . . . . . . . . . . . . . 44. Enabling massive deployments in modern healthcare monitoring systems . . . . . . . . . . . . . . . . . . . . . . . . . . . . . . . . . 49. 3 General overview of the proposal. 51. 3.1. Requirements . . . . . . . . . . . . . . . . . . . . . . . . . . . . . . . . . . 51. 3.2. Proposals . . . . . . . . . . . . . . . . . . . . . . . . . . . . . . . . . . . . 53. 4 Energy Disaggregation Algorithm Proposal (PCA-PQD disaggregation) 57 4.1. Model description 4.1.1. . . . . . . . . . . . . . . . . . . . . . . . . . . . . . . . 58. Event Detection Algorithm . . . . . . . . . . . . . . . . . . . . . . . 58 4.1.1.1. Pre-processing . . . . . . . . . . . . . . . . . . . . . . . . 58.
(18) xi. Contents. 4.1.2. 4.2. 4.3. 4.1.1.2. Change Detection. 4.1.1.3. Peak Detector. . . . . . . . . . . . . . . . . . . . . . . 61. . . . . . . . . . . . . . . . . . . . . . . . . 62. Event Classification Algorithm . . . . . . . . . . . . . . . . . . . . . 63 4.1.2.1. Signal Pre-processing: extraction of SPQD Power Signatures 64. 4.1.2.2. PQD-PCA Classification Algorithm . . . . . . . . . . . . . 67. Experimental Results . . . . . . . . . . . . . . . . . . . . . . . . . . . . . . 71 4.2.1. Event detection performance . . . . . . . . . . . . . . . . . . . . . . 71. 4.2.2. PQD-PCA algorithm performance. . . . . . . . . . . . . . . . . . . 78. Conclusions . . . . . . . . . . . . . . . . . . . . . . . . . . . . . . . . . . . 87. 5 Activity Monitoring Proposals 5.1. 5.2. 5.3. Log Gaussian Cox Process . . . . . . . . . . . . . . . . . . . . . . . . . . . 92 5.1.1. Selection of a single appliance with a strong routine . . . . . . . . . 93. 5.1.2. The LGCP model description . . . . . . . . . . . . . . . . . . . . . 96. The GMM-Score Monitoring Algorithm . . . . . . . . . . . . . . . . . . . . 100 5.2.1. Modelling using Gaussian Mixture Models . . . . . . . . . . . . . . 102. 5.2.2. Scoring the activity . . . . . . . . . . . . . . . . . . . . . . . . . . . 103. The DST-Score Monitoring Algorithm . . . . . . . . . . . . . . . . . . . . 104 5.3.1. 5.4. 91. Basic Belief Assignments and Weighing . . . . . . . . . . . . . . . . 108. Experimental Results. . . . . . . . . . . . . . . . . . . . . . . . . . . . . . 110. 5.4.1. Single Appliance Monitoring: LGCP algorithm. . . . . . . . . . . . 110. 5.4.2. Multi-Appliance Monitoring: GMM and DST algorithms . . . . . . 113.
(19) xii. Contents. 5.4.3. 5.4.2.1. Datasets, preprocessing and selection of the training . . . 113. 5.4.2.2. Definition of Parameters and Constants in the DST algorithm . . . . . . . . . . . . . . . . . . . . . . . . . . . . 115. 5.4.2.3. Analysis of DST and GMM scores . . . . . . . . . . . . . 116 5.4.2.3.1. Single pensioner household no. 101017 in HES dataset . . . . . . . . . . . . . . . . . . . . . . . . . . . 118. 5.4.2.3.2. Single pensioner household no. 103034 in HES dataset . . . . . . . . . . . . . . . . . . . . . . . . . . . 120. 5.4.2.3.3. Single pensioner household no. 102003 in HES dataset . . . . . . . . . . . . . . . . . . . . . . . . . . . 122. 5.4.2.3.4. Family house in UK-DALE dataset . . . . . . . . . . . . . . . . . . . . . . . . . . . 125. Conclusions . . . . . . . . . . . . . . . . . . . . . . . . . . . . . . . 128. 6 Conclusions and Future Works. 131. 6.1. Conclusions . . . . . . . . . . . . . . . . . . . . . . . . . . . . . . . . . . . 131. 6.2. Publications . . . . . . . . . . . . . . . . . . . . . . . . . . . . . . . . . . . 136 6.2.1. International Journals . . . . . . . . . . . . . . . . . . . . . . . . . 136. 6.2.2. International Conferences . . . . . . . . . . . . . . . . . . . . . . . 136. 6.2.3. National Conferences . . . . . . . . . . . . . . . . . . . . . . . . . . 137. 6.2.4. International Workshops . . . . . . . . . . . . . . . . . . . . . . . . 137. 6.3. Other research contributions . . . . . . . . . . . . . . . . . . . . . . . . . . 138. 6.4. International Research Stays . . . . . . . . . . . . . . . . . . . . . . . . . . 138. 6.5. Future Works . . . . . . . . . . . . . . . . . . . . . . . . . . . . . . . . . . 138.
(20) Contents. Appendix A Data Sets. xiii. 143. A.1 The BLUED dataset: Building-Level fUlly-labeled dataset for Electricity Disaggregation . . . . . . . . . . . . . . . . . . . . . . . . . . . . . . . . . 143 A.2 The PLAID dataset: The Plug Load Appliance Identification Dataset . . . 144 A.3 The HES dataset: Household Electricity Survey dataset . . . . . . . . . . . 144 A.4 The UK-DALE dataset: UK Domestic Appliance-Level Electricity dataset 145 A.5 The Colden Common dataset . . . . . . . . . . . . . . . . . . . . . . . . . 145 Appendix B Metrics. 147. B.1 Evaluation of the event detector performance . . . . . . . . . . . . . . . . . 147 B.2 Evaluation of the Load Signature Classification . . . . . . . . . . . . . . . 150 B.3 Others NILM metrics: . . . . . . . . . . . . . . . . . . . . . . . . . . . . . 152 Bibliography. 155.
(21)
(22) List of Figures. 1.1. Total energy of computing versus World’s energy production, adapted from [Beall, 2016]. . . . . . . . . . . . . . . . . . . . . . . . . . . . . . . . . . . .. 2. 1.2. Elderly dependency ratio by 2050 in the United States [Short, 2013]. . . . .. 4. 1.3. Abstract diagram of the synergy pursued on this thesis.. 5. 2.1. The energy disaggregation process in an UK-DALE household during a single day: (a) The Smart Meter data; (b) The appliance-level consumption. . . . . . . . . . . . . . . . . . . . . . . . . . . . . . . . . . . . . . . . 12. 2.2. Evolution of NILM publications by year [Parson, 2015a]. . . . . . . . . . . 13. 2.3. Smart Metering installations in Europe by countries: installed, planned and forecasted by 2020. Source: [van der Zanden, 2011]. . . . . . . . . . . 14. 2.4. Disaggregation accuracy related to the sampling frequency.. 2.5. Available signatures by frequency sampling. . . . . . . . . . . . . . . . . . 19. 2.6. The knapsack problem.. 2.7. Graphical representation of a Factorial Hidden Markov Model, [Kolter and Johnson, 2011]. . . . . . . . . . . . . . . . . . . . . . . . . . . . . . . . . . 23. 2.8. Comparison between CO, FHMM and Neural NILM using NILMTK, by [Kelly and Knottenbelt, 2015a]. . . . . . . . . . . . . . . . . . . . . . . . . 26. . . . . . . . . . .. . . . . . . . . 17. . . . . . . . . . . . . . . . . . . . . . . . . . . . . 21. xv.
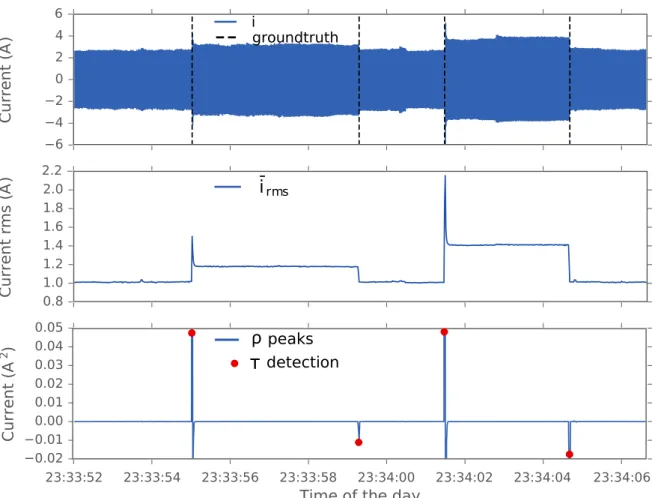
(23) xvi. List of Figures. 2.9. PQ plane and cluster of appliances, by [Hart, 1992].. . . . . . . . . . . . . 31. 2.10 Harmonics signatures for four appliances: water boiler, air conditioner, TV set and induction cooker; by [Liang et al., 2010b]. . . . . . . . . . . . . . . 32 2.11 V-I trajectories for six different appliances, by [Hassan et al., 2014]. . . . . 33 2.12 Parameters measured by an Smart-me smart plug.. . . . . . . . . . . . . . 38. 2.13 Inversion of the population in Spain [Patricio, 2011, INE, 2004]. . . . . . . 41 2.14 State of the Art for Activity monitoring in elderlies. 2.15 ADL challenges, in [Debes et al., 2016].. . . . . . . . . . . . . 42. . . . . . . . . . . . . . . . . . . . 45. 2.16 Valuable information against intrusiveness, in [Debes et al., 2016].. . . . . 46. 2.17 Some of the 77 “tape of forget” sensors deployed in a house in [Tapia et al., 2004]. . . . . . . . . . . . . . . . . . . . . . . . . . . . . . . . . . . . . . . 48 3.1. Block diagram of the proposals and workflow. . . . . . . . . . . . . . . . . 54. 4.1. Block diagram for the proposed event detector . . . . . . . . . . . . . . . . 59. 4.2. Illustration of the event detection algorithm. (a) i Current waveform from the mains and ground-truth of events; (b) Envelope extraction: irms normalized rms value for the current; (c) ⇢ peak signal and ⌧ event detection.. 63. 4.3. Block diagram for the proposed PCA-PQD Classification. . . . . . . . . . . 64. 4.4. Extracting delta values from the aggregated current i. . . . . . . . . . . . . 64. 4.5. Representation of the PQD power cube used to model load behaviour. . . . 67. 4.6. Event-detection algorithm performance evaluated on a ROC curve.. 4.7. Two instances from a Microwave and a Heater: (a) current waveform for microwave; (b) PQD signatures for microwave; (c) current waveform for heater; (d) PQD signatures for heater. . . . . . . . . . . . . . . . . . . . . 79. . . . . 74.
(24) xvii. List of Figures. 4.8. Three different instances of fridges corresponding to different transient states. 81. 4.9. Cumulative Ranking Curve of the PQD-PCA algorithm performance over the 11 appliance classes on the PLAID data set. . . . . . . . . . . . . . . . 85. 4.10 Confusion Matrix for RForest using VI binary images in [Gao et al., 2015, Gao et al., 2014]. . . . . . . . . . . . . . . . . . . . . . . . . . . . . . . . . 87 5.1. LGCP Usage Pattern Model for one appliance.. . . . . . . . . . . . . . . . 93. 5.2. Appliance ownership in the UK [Alcalá et al., 2015a].. 5.3. Frequency of kettle usage in house no. 101017 from HES data set: (a) per hour of day; (b) per day of week; and (c) per week of year. . . . . . . . . 95. 5.4. Frequency of kettle usage in house no. 102003 from HES data set: (a) per hour of day; (b) per day of week; and (c) per week of year. . . . . . . . . 95. 5.5. Occurrences and histogram of kettle usage during a week. . . . . . . . . . . 96. 5.6. (a) The probability of a kettle being used at each point in the week for a single household. (b) The covariance function between each point in the week and midnight on Monday. . . . . . . . . . . . . . . . . . . . . . . . . 98. 5.7. (a) The probability of a kettle being used at each point in the week for a single household. (b) The covariance function between each point in the week and midnight on Monday. . . . . . . . . . . . . . . . . . . . . . . . . 100. 5.8. A week of switching-on events for manual appliances in household no. h102003 from HES dataset. . . . . . . . . . . . . . . . . . . . . . . . . . . 101. 5.9. Examples of Gaussian Mixture Models for three different appliances during Mondays: (a) GMM for a lamp; (b) GMM for a microwave; (c) GMM for a DVD player. . . . . . . . . . . . . . . . . . . . . . . . . . . . . . . . . . 103. . . . . . . . . . . . 94. 5.10 . Kettle’s BBA on Mondays with a time interval Ti of 3 hours. . . . . . . . 109 5.11 False positive count for various intervention times. Each line represents one day of week for one house. . . . . . . . . . . . . . . . . . . . . . . . . . 111.
(25) xviii. List of Figures. 5.12 Intervention times of our approach (LGCP) against fixed-time intervention benchmark. . . . . . . . . . . . . . . . . . . . . . . . . . . . . . . . . . . . 113 5.13 Training and test event samples for household no. 101017 in HES dataset. 115 5.14 Score for test events in household no. 101017 from HES dataset: a) Test events; b) DST score every 6 hours; c) DST score by day; d) Union probability score by day; e) Union probability score by week. . . . . . . . . . . 119 5.15 Score for test events in household no. 103034 from HES dataset: a) Test events; b) DST score every 6 hours; c) DST score by day; d) Union probability score by day; e) Union probability score by week. . . . . . . . . . . . 121 5.16 Score for test events in household no. 102003 from HES dataset: a) Test events; b) DST score every 6 hours; c) DST score by day; d) Union probability score by day; e) Union probability score by week. . . . . . . . . . . . 123 5.17 Score for test events in household no. 102003 from HES dataset during a week: a) Test events; b) DST score every 6 hours; c) DST score by day; d) Union probability score by day; e) Union probability score by week. . . . . 124 5.18 Score for test events in household no. 1 from UKDALE dataset: a) Test events; b) DST score every 6 hours; c) DST score by day: d) Union probability score by day; e) Union probability score by week. . . . . . . . . . . 126 5.19 Score for test events in household no. 1 from UKDALE dataset: a) Test events; b) DST score every 6 hours; c) DST score by day; d) Union probability score by day; e) Union probability score by week. . . . . . . . . . . . 127.
(26) List of Tables. 2.1. Table of acronyms for Figure 2.4. . . . . . . . . . . . . . . . . . . . . . . . 18. 2.2. Table of acronyms for Figure 2.5. . . . . . . . . . . . . . . . . . . . . . . . 19. 4.1. Event-detection algorithm performance. Metrics: False Positive Rate and True Positive Rate for the optimal detector (FPR, TPR) and Area Under Curve (AUC). . . . . . . . . . . . . . . . . . . . . . . . . . . . . . . . . . . 74. 4.2. Occurrence of events in the PLAID dataset per phase and appliance type.. 4.3. The proposed event detector performance compared with [Barsim et al., 2014] in the TPP and FPP metrics for the phase A of BLUED dataset. . . 76. 4.4. The proposed event detector performance compared with [Barsim et al., 2014] in the TPP and FPP metrics for the phase B of BLUED dataset. . . 76. 4.5. Comparison of the proposed event detector with three other approaches ([Wild et al., 2015, Anderson et al., 2012b, De Baets et al., 2016]) in recall, precision and F-scores metrics for the phase A of BLUED dataset. . . . . 77. 4.6. Comparison of the proposed event detector performance with three other approaches ([Wild et al., 2015, Anderson et al., 2012b, De Baets et al., 2016]) in recall, precision and f-scores metrics for the phase B of BLUED dataset. . . . . . . . . . . . . . . . . . . . . . . . . . . . . . . . . . . . . . 78. 4.7. Metrics to evaluate the performance of the PQD-PCA algorithm over the PLAID data set. . . . . . . . . . . . . . . . . . . . . . . . . . . . . . . . . 83 xix. 75.
(27) xx. List of Tables. 4.8. Extended comparison in accuracy from [Gao et al., 2015] with the PQDPCA performance. . . . . . . . . . . . . . . . . . . . . . . . . . . . . . . . 86. 5.1. Basic Belief Assignments for appliances X and Y (example). . . . . . . . . 107. 5.2. BBA fusion for appliances X and Y.. 5.3. Mass functions, Beliefs and Plausibility after fusion.. 5.4. Appliance labelling in Y-axis by house.. . . . . . . . . . . . . . . . . . . . . . 107 . . . . . . . . . . . . 107. . . . . . . . . . . . . . . . . . . . 117.
(28) List of Acronyms UK-DALE. The UK Domestic Appliance-Level Electricity dataset. NILMTK. Open source NILM ToolKit in python. NILM. Non Intrusive Load Monitoring. SIA. Semiconductor Industry Association. SG. Smart Grids. SM. Smart Meter. EV. Electric Vehicle. HVAC. Heating, Ventilation and Air Conditioning. EDR. Elderly Dependency Ratio. CO. Combinatorial Optimisation. HMM. Hidden Markov Models. DNN. Deep Neural Network. UK. United Kingdom. LGCP. Log Gaussian Cox Processes. GMM. Gaussian Mixture Model. DST. Dempster-Shafer Theory. PQD. Active, Reactive and Distortion power trajectories. NIALM. Non Intrusive Appliance Load Monitoring. PLC. Power Line Communication. HAN. Home Area Network. NALM. Nonintrusive Appliance Load Monitoring. DR. Demand Response xxi.
(29) xxii. List of Acronyms. LF. Low Frequency. HF. High Frequency. EMI. ElectroMagnetic Interference. P. Active Power. D. Distortion Power. HAR. Harmonics. SMPS. Switch Mode Power Supply. ILM. Intrusive Load Monitoring. DDSC. Disaggregation via Discriminative Sparse Coding. FHMM. Factorial Hidden Markov Model. CFHSMM. Conditional Factorial Hidden Semi Markov Model. dHMM. Difference Hidden Markov Model. ANN. Artificial Neural Network. LS. Generalised Likelihood Ratio. GLR. Load Signature. FFT. Fast Fourier Transform. CL. Composite Load. Q. Reactive Power. WS. Wave-Shaped feature. CW. Current Waveform. IAW. Instantaneous Admittance Waveform. IPW. Instantaneous Power Waveform. PCA. Principal Component Analysis. MS-NILM. Manual Setup NILM. AS-NILM. Automatic Setup NILM. NN. Neural Network. MLP. MultiLayer Perceptron. RBF. Radial Basis Function. SVM. Support Vector Machine.
(30) xxiii. List of Acronyms. LR. Least Residue. CDM. Committee Decision Mechanism. MLE. Maximum Likelihood Estimator. LUR. Least Unified Residue. MCO. Most Common Occurrence. PRIME. PoweRline Intelligent Metering Evolution. NILM-eval. NILM evaluation framework in Matlab. AAL. Ambient Assisted Living. AmI. Ambient Intelligence. ADL. Activities of Daily Living. BSN. Body Sensor Network. MEMS. Microelectromechanical Systems. ADLs. Activities of Daily Living. IADL. Instrumental Activities of Daily Living. CS. Guttman Coefficient. COPD. Chronic Obstructive Pulmonary Disease. AR. Activity Recognition. HHSMMs. Hierarchical Hidden semi-Markov Models. NB. Naive Bayesian. LHMMs. Layered Hidden Markov Models. LDA. Latent Dirichlet Allocation. rms. Root mean square value. S. Apparent Power. PLAID. The Plug-Level Appliance Identification Dataset. REDD. The Reference Energy Disaggregation Data Set. BLUED. Building-Level fUlly-labeled dataset for Electricity Disaggregation. TPR. True Positive Rate.
(31) xxiv. List of Acronyms. FPR. False Positive Rate. TPP. True Positive Percentage. ROC. Receiver Operating Characteristic. AUC. Area Under Curve. TP. True Positives. FN. False Negatives. FP. False Positives. TN. True Negatives. FPP. False Positive Percentage. P. Number of positives or events. CRC. Cumulative Ranking Curve. kNN. k-Nearest-Neighbors. GNB. Gaussian Naive Bayes. LGC. Logistic Regression Classifier. DTree. Decision Tree. RForest. Random Forest. GPy. Gaussian Process framework in Python. HES. Household Electricity Survey. BBA. Basic Belief Assignment. MLE. Maximum Likelihood Estimator.
(32) Nomenclature Sampling frequency.. fs P. Delta values of the active power: difference between two consecutives samples.. vn. Vote value for item n in the knapsack problem algorithm.. wn. Weight for item n in the knapsack problem algorithm.. x̂. Estimated values for vector x in a HMM algorithm.. (n). Unobserved variable at instant t for appliance or item n.. yt. (n). Observed variable at instant t for appliance or item n.. yt. Sum of observed variables along appliances or items N at instant t.. Vrms. Root mean square value of voltage.. Vnorm. Regularised voltage in mains (e.g. 230Vrms in Europe).. v(t). Voltage values over time t.. i(t). Current values over time t.. Pnorm (t). Normalized active power over t.. IAW (t). Instantaneous Admittance Waveform over t.. xt. xxv.
(33) xxvi. Nomenclature. IP W (t). Instantaneous Power Waveform over t.. vs. Voltage value vector for cycle s in the event detector.. is. Current value vector for cycle s in the event detector.. vrms,s. Voltage root mean square value in cycle s.. v rms. Voltage root mean square value vector over all cycles S.. vs,j. The j-th voltage value in the vector-cycle v s .. irms,s. The normalised current root mean square value in cycle s.. rirms. The derived vector of consecutive irms,s values over all cycles S.. ⇢. Output of the change detection block in the event detector algorithm.. Wd. Peak detector parameter of minimum distance between peaks.. ✓th. Peak detector parameter of minimum peak amplitude.. ⌧. Timestamp vector of event occurrences. Set of w aggregated current vector-cycles centered at the event e.. Ie. The de-energised current signal centered at event e and composed by w vector-cycles.. Irms,1. The root mean square value of the current first harmonic.. '. The displacement phase between voltage v and current i.. [P QD]am. Matrix of evaluated power P , Q and D for a certain sample m of the appliance type a.. ⌧ am. Matrix of evaluated power P , Q and D for a certain sample m of the appliance type a, rearranged in 1 column vector.. a. Averaged vector for the set of training M of the appliance type a in the PQD-PCA algorithm..
(34) xxvii. Nomenclature. a m. The variance vector of the training sample ⌧ am after subtracting the average vector a .. S aT. The Scatter matrix along all training samples ⌧ am in the set M .. ⌦am. The feature vector of the training sample ⌧ am .. U. A transformation matrix.. U aopt. The optimised transformation matrix of l eigenvalues for appliance type a.. uk. The k-th eigenvalue of an optimised transformation matrix. ⌧ˆe. Estimation of the arrival test sample ⌧ e .. ba. Estimation of the variance vector of the arrival test sample ⌧ e after substracting the average vector a of a appliance type a. "ae. Error reconstruction for arrival test sample e evaluated by classifier appliance type a.. e. a. C. opt. Maximum error reconstruction in the classifier appliance type a. Appliance class that labels the arrival test sample e in the PCAPQD algorithm. The optimal binary detector. The set of all binary detectors in the event detector performance.. Pi. Active power feature for sample i.. Si. Apparent power feature for sample i.. wrecall. Weight of metric recall.. wprecision. Weitgh of metric precision. The ratio between weights wrecall and wprecision .. F. The weighed mean between recall and precision..
(35) xxviii. F1 (x). Nomenclature. The harmonic mean between recall and precision. Intensity function over the temporal points.. m(x). Mean of a Gaussian Process over the temporal points in the LGCP algorithm.. x0. Predicted temporal points in a temporal point space X.. K(x, x0 ). Kernel function of a Gaussian Proccess over the temporal points x and given the predicted points x0 .. GP(m(x), K(x, x0 )). Gaussian Proccess given a mean and a kernel function. Variance of a Kernel function.. `. The lenght-scale window of a Kernel funcion within where neighbors have effect on the regression.. ⇢. The period of a Kernel function that models the regression in a Gaussian Proccess.. p(a0:t ). The cumulative probability that an appliance a was used at least once by time of day t.. Ej. The j-th event of m event occurrences within a day for an appliance.. P (Ej ). The probability of the event Ej occuring at a certain time TJ .. Ai. The set of all events m of the appliance i occurring within the day.. P (Ai ). The probablity of occurring the set of events Ai within a day.. hx. The hypothesis x.. Hx. The subset of hyphotesis x.. ⌦. The universe of hpythesis.. 2⌦. The power set of hypothesis in the Dempster-Shafer Theory..
(36) xxix. Nomenclature. mx (hx , Ti ). The mass function for appliance x in the hypothesis hx at the observation window Ti in the DST algorithm.. m1,2 (A). The resulting mass function for appliance 1 and 2 in hypothesis A in the DST algorithm.. bel(A). The belief in hypothesis A.. pl(A). The plausibility in hypothesis A.. C0. The used uncertainty constant whenever a event occurs in the DST algorithm.. C1. The used uncertainty constant in the absence of events in the DST algorithm.. mTi (hx ). In the DST algorithm, the total mass function for hypothesis hx after merging the all appliance mass functions in the observed window Ti ..
(37)
(38) Chapter 1. Introduction 1.1. Overview. We face harsh global challenges in the forthcoming years that are much related to the thriving of our species: climate change, lack of energy resources and ageing of the population. This dissertation encompasses our tiny contribution to cope with these challenges. These three concepts may be well studied separately in several thesis as they are not directly bonded, specially the last one related to the two others: “ageing of the population”. Although, we have found a synergy where improvements in one field may help to strengthen the weakest point of the others. Thus, this thesis devises technical solutions for monitoring the health of elderlies through the employ NILM (Non-Intrusive Load Monitoring) techniques, which are typically used to save energy resources, in relation to climate change. In an overpopulated World like ours, the potential danger of resource shortages is real. Concerning energy resources, this danger is doubled up as we tend to increase the energy consumption per capita. An increasing power demand means to increase the energy generation, whose main source is currently fossils fuels; and consequently, this leads to increase the CO2 emissions. Thus, the concern about the climate change is pushing forward the research of new renewable and clean energy sources. Nevertheless, this will not be enough as the power demand will shortly be greater than the world’s power generation and power shortages will eventually happen. Could you imagine the consequences of that in a digitalised world like ours? We may sound alarming and apocalyptic, nonetheless, there is not lack of studies that foresee this scenario. For instance, a report by the 1.
(39) 2. Introduction. Semiconductor Industry Association (SIA) predicts that, following the actual pattern of production and consumption, the total energy employed for computing (i.e. the total amount of energy per bit of all computers around the World) will exceed the World’s energy production by 2040 [Beall, 2016], (see Figure 1.1). Of course, it is not feasible that the whole energy production will be dedicated to computing, therefore, this shortage may be far before 2040, whether actions are not to be taken.. World's energy production. 1e+22. 1e+20. -14. - 10. ) em yst s ( ark bit -17 J/ chm n e 0 B )-1 em bit t s -21 J/ (sy t 0 e g x1 Tar )-3 e c evi it (d m i l er dau n a L. 1e+18. Joule/Year. t J/bi. 1e+16. 1e+14. 1e+12. 1e+10. 1e+8 2010. 2015. 2020. 2025. 2030. 2035. 2040. 2045. Years. Figure 1.1: Total energy of computing versus World’s energy production, adapted from [Beall, 2016].. From SIA, a realistic action is to improve the energy efficiency on transistors to reduce the amount of energy per bit; instead of reducing the World’s computation, which would affect our development as society. Analogically, we can translate the energy efficient problem to our whole society: we must be energy efficient in industry and residential and commercial buildings if we are to reach energy sustainability. Thus, the Smart Grid concept (SG) is born with the major goal of achieving the energy efficiency of our society. It changed the concept of a centralised distribution grid to a decentralised one to help the inclusion of small heterogeneous renewable sources (e.g. solar panels in households). Furthermore, it enables a better and a bidirectional communication (i.e. from the central station to the household and back) thanks to the use of Smart Meters that help gain insights and to anticipate great power demands whenever the electric vehicles (EV) are charged. The power grid has seldom changed since its inception and many appliances are.
(40) Introduction. 3. highly inefficient, therefore, one might think it may be easier to achieve energy efficiency than in transistors. In fact, buildings are highly inefficient and its thermal isolation can be far improved: they count for 41% of the total power demand and more than 63% is due to Heating, Ventilation and Air Conditioning (HVAC) systems. However, there is another factor that highly influences on the energy consumption: the pattern consumption of inhabitants. Therefore, we also need to be educated in healthy energy efficiency habits. Thanks to the breakthrough of the Smart Meters, a new research domain has born and it is gathering the interest from researches: Non-Intrusive Load Monitoring (NILM). This is the process of itemising the total energy consumption of a household, measured from the SM, into the individual consumption of all appliances connected to the mains. We will extensively cover this in the Section 2.1, nevertheless, we would like to anticipate that NILM pursues energy efficiency through the “energy awareness” and it has the major advantage of being non-intrusive. Thus, it may use the itemised energy information to give feedback to the inhabitants so they can consequently take actions to reduce their consumption. At large scale, NILM may contribute much to energy efficiency spreading healthy energy consumption habits within the population, however, it might be of less interest for individuals: changing their routines is hard and this effort might not be reflected on their annual bill (usually leveraged by taxes). Section 2.1.4 will give more insights about this, also other thesis dissertations address this issue [Kelly, 2016]; however, we would like to highlight here that the lack of motivation from inhabitants is preventing NILM from a widespread adoption that would benefit to our society in terms of energy efficiency. On the other hand, current advances on the modern medicine have made possible to us to have a longer and a quality life. Specially thanks to the development of antibiotics and vaccines, we have overcome many epidemics diseases (e.g. influenza, bubonic plague, smallpox and cholera) that decimated the world population; and now, the life expectancy has doubled up. Nevertheless, this prosperity is also reflected into profound demographic changes that arise new challenges. Likewise, in our modern world, the elderly dependency ratio (EDR), which is the ratio of the number of old age people (older than 65) to the number of productive people (between 20 to 64); is rapidly increasing since 2013 (see Figure 1.2), where the ratio is multiplied by 100. An ageing of the population inevitably entails consequences: this population is prone to suffer from diseases (e.g. alzheimer and dementia) and needs more medical and care assistance. If we are to maintain the wellness within the elderly community, more investment in health care is needed..
(41) 4. Introduction. Figure 1.2: Elderly dependency ratio by 2050 in the United States [Short, 2013]. Although they are more dependant in terms of assistance, they are eager to maintain their independent live as long as they can, living by themselves in their own houses. Hence, there has been a blooming of health care tele-monitoring systems (i.e. remotely monitoring their activity) that try to meet their requirements. These health care monitoring systems have been much welcomed by this community, as well as their relatives, who feels more secured knowing that they are being monitored; however, they often need to adapt their surroundings and to deploy sensors along the house. The deployment and maintenance of these systems are usually expensive and not feasible and, hence, this raises a sustainability problem where the majority of this increasing community has no access to the basis health care tele-monitoring systems (this is more deeply discussed in Section 2.2.1). In summary, in a near future (i.e. by 2050) we might experiment shortages in the energy distribution system and in the healthcare system, caused by an overpopulated and thriving world, that could severely affect the development of our society. Many studies have addressed these issues separately and solutions are being devised, but few have seen how these two worlds can be combined. How solutions for one problem can be applied to the other. Thus, healthcare monitoring systems may be a solution to avoid a collapse into the healthcare system, however, they are out of reach for the majority of the elderly community. If NILM approaches are to be applied to healthcare monitoring systems, the latter could much benefit from the low cost and non-intrusiveness to enable massive deployments. In turn, healthcare monitoring systems can give an added value to NILM to motivate individuals to adopt these approaches..
(42) 5. Introduction. This thesis dissertation aims to contribute to achieve energy efficiency and sustainability in healthcare systems. Our goal is to open new ways to monitor elderlies using NILM techniques so we can use the best of both world to achieve massive deployments and to bring both technical and social values to this thesis. This may be summarised on the abstract diagram depicted in Figure 1.3. Although, our contribution might be tiny into a global scale, we hope that more studies will follow us and, together, we make huge changes.. Technical value. Social value. Low cost. - Energy efficiency. NILM. Social interest. Healthcare monitoring. - Quality of life. Nonintrusive. Figure 1.3: Abstract diagram of the synergy pursued on this thesis.. In the remaining of this Chapter, we give the framework into which this thesis has been developed (i.e. fundings and research projects). Then, the thesis outline gives a summary of the forthcoming chapters.. 1.2. Thesis framework. The work developed in this thesis has been supported by the Spanish Ministry of Economy and Competitiveness and it has been developed under the following research projects: • ENERGOS (UAH-24/2010),.
(43) 6. Introduction. • LORIS (ref. TIN2012- 38080-C04-01), • DISSECT-SOC(ref. TEC2012- 38058-C03-03), • TARSIUS (ref. TIN2015-71564-C4-1-R), • SOC-PLC (ref. TEC2015-64835-C3-2-R MINECO/FEDER). Likewise, the LORIS project seeks for continuous tracking in large environments by using ultrasound and radio frequency as well as the integration of these Local Positioning Systems with other networks such as the Smart Grids and the Body Sensor Networks. Moreover, the TARSIUS project pursues the construction of ambient intelligence-based spaces where it is essential to detect the presence of agents (i.e. people and autonomous vehicles) and to provide local based services (LBS). Thus, the project’s objectives that influence more in this thesis deal with the exploration of new non-intrusive approaches (i.e. device-free) and opportunistic signals to the issue of people location, such as tomography, TDV cameras and the disaggregation of the electricity consumption. Apart from the position, additional signals, related to the human activity, can be obtained (e.g. appliance usage patterns) to give support during the activity performance. Besides, another remarkable objective is the development of a case study with the monitoring of elderly and diagnosis of sleep disorders (with support of clinicians) by using positioning data, BSN and disaggregation of energy, prioritising non-intrusive systems. Furthermore two research stays have been possible thanks to the fundings from the University of Alcalá fellowship program (FPI 2011) and its mobility program: a three month research stay in Tyndall National Institute (Cork, Ireland) and another three month research stay in the Agents, Interaction and Complexity Research Group (AIC) from the University of Southampton (Southampton, United Kingdom). This thesis has been also partially supported by other international institutions under the following projects: • The ORCHID project at the University of Southampton): http://www.orchid.ac.uk/ • The ITOBO project (Information and Communication Technology for Sustainable and Optimized Building Operation) at the University College Cork: http://careers.tyndall.ie/myprojects/project/11303.
(44) Introduction. 1.3. 7. Thesis outline. From the ground to the roof, the content of this thesis has been arranged in six different chapters, following a natural flow, that guides the readers from the basis knowledge to the conclusions, passing through the low-level contributions in the NILM field and the high-level contributions in activity monitoring. Because Chapter 4 and Chapter 5 present different proposals to overcome different challenges, it makes more sense to present results and conclusions just after each proposal. Hence, we have made these chapters selfcontained to facilitate the reading: the proposal, results and conclusions are sequenced in the chapter. The content of each chapter is as follows: • Chapter 2: “State of the Art” A thorough survey of literature is presented in this Chapter. Always keeping in mind our final goal: the use of NILM techniques for activity monitoring for elderlies. Therefore, the reader will be guided through the NILM basis methods that may differ according to the used sampling rate. A low sample rate allows a better integration in detriment to the accuracy and eventless NILM algorithm are predominant: Combinational Optimisation, Hidden Markov Models and Deep Neural Networks are the trend in the field. Higher sampling rates allow the implementation of event-based NILM algorithms that may have greater accuracy and are thought to work on real time. These algorithms are often divided into three stages: “event detection”, “load signature training” and “load signature classification”. Then, a discussion about the need of new applications for NILM will open the door to the survey of a high-level application: activity monitoring for elderlies. The importance of activity monitoring in healthcare monitoring methods is highlighted and different methods (i.e. direct and indirect ones) are evaluated according to its degree of intrusiveness and scalability. • Chapter 3: “General overview of the proposal” It serves as a nexus between the thesis contributions: Chapter 4 and Chapter 5; and the state of the art (Chapter 2). Thus, having identified the weakness and the strengths in NILM and activity monitoring, we proceed to present our approaches based on the acquired knowledge. A discussion about the chosen method is presented based on literature.
(45) 8. Introduction. and the goals are enumerated. Furthermore, we present a diagram that summarises all contributions as a whole, given a complete solution. • Chapter 4: “Energy disaggregation algorithm proposal” We present our contribution to the NILM field. In other words, this is what we call our low-level application. To adapt NILM to activity monitoring purposes, we have chosen to devise a new event-based NILM algorithm that has a high accuracy. The event detector is based on the envelope extraction through the evaluation of the root mean square value of the current and voltage. A novel load signature is presented, which has much information about the occurred event and minimise the signature overlapping. This method is based on the extraction of the active, reactive and distortion power over the transient and the steady states. To learn the signatures and to discriminate between them, a classifier based on Principal Component Analysis has been devised. This technique is often used in image processing to compress the variance and to reduce the file size. Thus, we train our classifier to obtain general compressions of different appliance types. Given a new instance, the model that generates the best compression will be the one which labels the instance. The general models only need to be trained once from a dataset, hence, we called this approach “unsupervised” method. Furthermore, experimental results are also presented in this Chapter. • Chapter 5: “Activity Monitoring proposals” Given the disaggregated data from a Smart Meter, what can we do to monitor the health of elderlies? This Chapter presents our three proposals. We have found that some appliances may have a strong correlations with daily patterns. For instance, the kettle is strongly correlated with the daily routines in the United Kingdom (UK). The Log Gaussian Cox Processes (LGCP) approach learns the usage pattern of a single appliance including an uncertainty, which is strongly correlated with the daily routing, and it infers the activity monitoring of the inhabitant. It triggers an alarm whenever the subject departs from his daily routine. Multi-appliance monitoring allows to detect pattern deviations in shortterm monitoring (i.e. within a day) and long-term monitoring (i.e. within months), this may be useful to detect degenerative diseases such as Dementia and Alzheimer. Therefore, we present two methods to evaluate someone’s routine over time based on learning.
(46) Introduction. 9. the usage pattern of several appliances: a Gaussian Mixture Model (GMM) approach and a Dempster-Shafer Theory (DST) approach. Furthermore, empirical results are also presented in this Chapter: LGCP approach is suitable when there is a strong correlation of the routine with one appliance; otherwise, the LGCP approach performs better than the GMM does because it models the uncertainty. This last one is important; it models the free will of the inhabitant and the sparsity of events, and, therefore, less false alarms are produced. • Chapter 6: “Conclusions” This last Chapter summarises the whole work of this thesis dissertation. What are the strengths and weakness of our approach? What are the benefits to the society from using our approach? What are the limitations? These and other questions will be answered in this Chapter. Furthermore, contributions to the research community will be presented in terms of publications, collaborations and etcetera. Important remarks about future work will be made to guide all research to come in this topic..
(47)
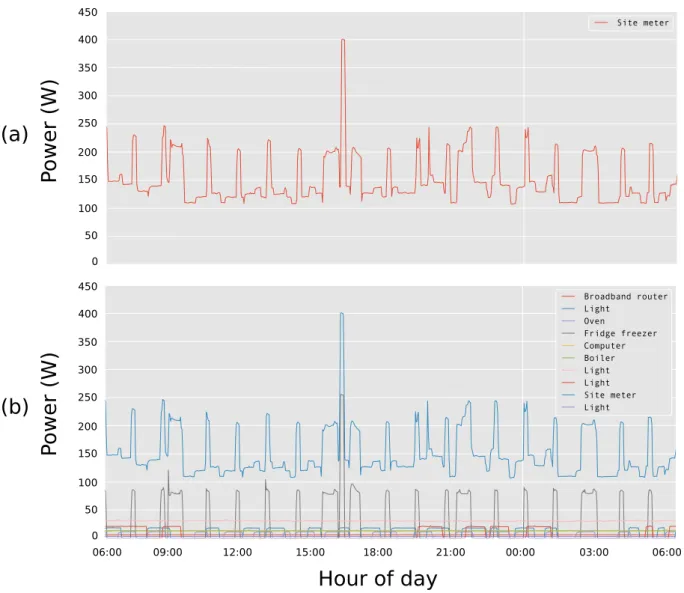
(48) Chapter 2. State Of the Art Through this chapter, we intend to give to the reader a through and detailed view of the current state of the art with regard to energy disaggregation and activity monitoring. This sets the scenario where developments of this thesis start from. Following the natural flow from low to high level application, we firstly present the current state on the energy disaggregation domain. Then, we delve into the last advances in activity monitoring, specially focused on elderly monitoring.. 2.1 2.1.1. Energy disaggregation Definition of energy disaggregation. The notion of energy disaggregation begins from a simple quest: given the total energy consumption from a building as the only input, can we unravel the energy consumption of every appliance plugged into the mains? Therefore, energy disaggregation embraces a collection of techniques (e.g. those based on machine learning and signal processing) aimed to answer that question. To illustrate the process, we select a single day from a random household in the UK-DALE dataset [Kelly and Knottenbelt, 2015b] (see also Apendix A) using the NILMTK toolkit [Batra et al., 2014]. Figure 2.1.a depicts the smart meter data where, from a visual inspection, we can recognise power steps due to connection and disconnection of appliances. Nevertheless, we do not know a-priori which appliances are responsible for this signal. Applying energy disaggregation algorithms and 11.
(49) 12. State of the Art. techniques, this aggregated consumption can be broken down to discover what appliances lay underneath and what their respective energy consumption are, as seen in Figure 2.1.b 450. Site meter. 400. (a). Power (W). 350 300 250 200 150 100 50 0 450. Broadband router Light Oven Fridge freezer Computer Boiler Light Light Site meter Light. 400. (b). Power (W). 350 300 250 200 150 100 50 0 06:00. 09:00. 12:00. 15:00. 18:00. 21:00. 00:00. 03:00. 06:00. Hour of day Figure 2.1: The energy disaggregation process in an UK-DALE household during a single day: (a) The Smart Meter data; (b) The appliance-level consumption.. Energy disaggregation is most commonly known as Non-Intrusive Load Monitoring (NILM) or Non-Intrusive Appliance Load Monitoring (NIALM) to highlight its most compelling attribute: the appliance monitoring inside a household without the need of an inner installation. In terms of non-intrusiveness, the ideal source of information is the smart meter data, which would have been already deployed by the utility company, accessed through Power Line Communication (PLC). Nevertheless, the sample rate is about one sample every 15 minutes and, consequently, only a coarse-grained disaggregation can be achieved..
(50) State of the Art. 13. Likewise, researches rely on the access to the Smart Meter data through either directly reading the sensor measurements, through a Home Area Network (HAN) or single-point sensors developed by third companies to achieve a greater accuracy on the disaggregation (see Section 2.1.5 ). Henceforth, we refer to energy disaggregation as NILM.. 2.1.2. Evolution of NILM. Energy disaggregation is not a new concept, the first appearance dated from 1992 in [Hart, 1992]. George Hart was the first to coin the term NALM (Non-intrusive Appliance Load Monitoring) and to set the basis of a number of NILM concepts, they will be following discussed in Section 2.1.3. However, it has not been until 2010 that NILM has arisen the interest within the research community. To support this statement, Figure 2.2, created by Oliver Parson ([Parson, 2015a]), shows the number of publications around NILM since early 90’s up to mid 10’s (it does not specify the range limits). It can be clearly observed a disruptive point in 2010 when the number of publications begins to increase exponentially.. Figure 2.2: Evolution of NILM publications by year [Parson, 2015a].. This reborn interest might well be related to the recent apparition of Smart Grids (SG). One of the major commitments that our society faces since the new century is to reach energy sustainability and this has motivated the breakthrough of Smart Grids (SG) as a.
(51) 14. State of the Art. new paradigm to achieve Energy Efficiency. Special attention is drawn over buildings and households that account for more than 41% of energy consumption in the European Union (EU), whereas residential use represents 63% of total energy consumption in the buildings sector, [Balaras et al., 2007]. Studies state that providing customers with real-time information at aggregate level may induce them to adopt energy-conserving behaviours that could lead to save 10-15% on power. Thus, Smart Meters (SM) are called to play an important role for customer, helping them to manage their Demand Response (DR) (changes in the pattern consumption in response to the electricity market) in a more efficient way. Consequently, many countries are massively deploying smart meters to achieve a finer-granularity on the DR. Figure 2.3 shows the numbers in Europe: around 35, 32, 32, 27 and 23 millions of total smart metering installations forecasted by 2020 in France, Germany, Italy, United Kingdom and Spain, respectively. This new scenario, where a fine-grained DR is needed and the presence of smart metering data is greater, has awaken a renew interest in NILM.. Figure 2.3: Smart Metering installations in Europe by countries: installed, planned and forecasted by 2020. Source: [van der Zanden, 2011]..
(52) State of the Art. 2.1.3. 15. NILM algorithms. The state of the art in NILM is often organised into event and eventless based algorithms. The former pursues the detection and classification of transient states (i.e. switching on/off events or state changes of appliances), whereas the latter aims to foresee the state of a set of appliances (i.e. those to be disaggregated) at each sample based on previous observations. Another popular classification falls into supervised and unsupervised algorithms. However, we prefer another type of classification, based on the frequency sampling: Low-Frequency (LF) and High-Frequency (HF) algorithms. This feels a more natural process for us to discuss the different features of NILM algorithms and their development. After all, NILM algorithms are designed to meet some sampling requirements either to be integrated into smart meters or third-party devices. The sampling rate also defines the resources that NILM algorithm can play with to achieve a better accuracy. With concern to the supervised and unsupervised methods, it is worth to note that these concepts may differ a bit from the classical machine learning approaches. In the machine learning domain, supervised algorithms are those that need labelled data during the training process, whereas unsupervised algorithms are only fed with unlabelled data. Back to the NILM domain, there is a subtle difference about the “unsupervised” concept. An unsupervised NILM algorithm is such that does not use labelled data from houses to be disaggregated (i.e. test houses), however, it may use unlabelled data from test houses and labelled data from training houses [Parson, 2015b]. For instance, eventless algorithms presented in this Section such as [Kelly and Knottenbelt, 2015a, Parson et al., 2014] are unsupervised. Back to the classification based on the frequency sampling, there is a trade-off between integration (also called intrusiveness) and the disaggregation accuracy, and, furthermore, both are strongly correlated with the sampling frequency. We depict this correlation in Figure 2.4, which illustrates the state of the art in terms of frequency. The disaggregation accuracy proportionally increases as the sampling frequency does, whereas the integration decreases. Besides, to facilitate the comprehension of this Figure, we provide the Table 2.1 that lists the acronyms used and whose studies will be detailed in the following subsections. With regard to the integration and intrusiveness, utility companies often use Power Line Communication (PLC) to transmit load curves that have been downsampled to 1 sample every 15 or 30 minutes. This sampling rate allows the lowest degree of intrusiveness,.
(53) 16. State of the Art. obtaining measurements directly from the central station, which collects the SM data through Power Line Communication (PLC). In some countries, such as UK, Smart Meters may include a wireless port (e.g. ZigBee) to enable higher resolutions (i.e. load curves sampled every 1 or 10 seconds) via the Home Area Network (HAN). Thus, a dummy device may capture this data and send it to the cloud for disaggregation. We enter in a higher intrusiveness degree, placing that device within the household. Nevertheless, communication through the HAN is not guaranteed in most countries. Finally, higher sample rates (i.e. higher than 1 Hz) may need a hardware plugged into the mains (i.e. as those presented in section 2.1.5) or to integrate the energy disaggregation algorithm into the smart meter, which could entail more complex integration. The smart metering standardization regulates the measurement of harmonics to evaluate distortion in the mains, [Sanduleac et al., 2015, Terzija et al., 2007]. That means regularised smart meters sample up to 8kHz, sometimes up to 1MHz, [Chen et al., 2011]. With concern to the disaggregation accuracy, at the very lowest position on the sampling frequency scale (i.e. a sampling interval of 15 or 30 minutes), the disaggregation is very coarse and only major appliances can be disaggregated ([Kolter et al., 2010]). In a medium scale, we have what we call LF NILM algorithms, which include the majority of the literature: [Kolter and Johnson, 2011, Hart, 1992, Kelly and Knottenbelt, 2015a, Kim et al., 2011, Kolter et al., 2012, Bonfigli et al., 2015, Parson et al., 2014]. Most recent efforts on NILM have been focused on this sampling rate, since measurements can be easily collected and sent to a cloud service where disaggregation is performed. The use of load curves sampled every 1 or 10 seconds makes the event detection (i.e. appliances switching on and off) impractical and, consequently, they are eventless methods in their majority, but for some exceptions [Baranski and Voss, 2004]. They are able to disaggregate the majority of appliances presented in a house and their disaggregation accuracy has been measured up to 87%. Finally, HF NILM algorithms are placed at the highest scale of the sampling frequency, where the recorded disaggregation accuracy has been up to 99.9%: [Liang et al., 2010a, Hassan et al., 2014, Srinivasan et al., 2006, Gao et al., 2015]. They are mostly event-based algorithms, which enables real-time activity monitoring applications. Furthermore, a few studies explore the potential of very high frequency sampling (i.e. higher than 100kHz) where ElectroMagnetic Interference (EMI) noise allows even to discriminate between same appliance types located in different rooms ([Patel et al., 2007, Gupta et al., 2010])..
(54) 17. State of the Art. We would like to state that Figure 2.4 is a biased vision of the state in NILM based on this survey. It serves to the purpose of structuring the state of the art, rather than establishing a strict classification of it. The disaggregation accuracy is also very subjective: one may say that discriminating between same appliances located in different rooms does not mean disaggregation accuracy; or there is not a fair comparison between LF NILM algorithms and HF NILM algorithms as most HF algorithms presented in the Figure only evaluate the load identification, which will be explained in the following subsections. However, it does not exist a complete unbiased comparison as yet, and assumptions are to be made. From our opinion and as a big picture, HF algorithms may disaggregate better than LF algorithms when both are optimised.. Same model, different rooms. Appliances (greater than 50W) Major appliances. Disaggregation accuracy. Low frequency Algorithms. High frequency algorithms. Continuous EMI [Gupta et al. 2010]. Transient EMI. CDM. [Patel et al. 2007]. [Liang et al. 2006]. Finer grained disaggregation. SVM. [Hassan et al. 2014]. dHMM. Neural NILM [Kelly et al. 2015]. FHMMs. Eventless. [Kolter et al. 2012] [Parson et al. 2012]. CFHSMM. MLP. Coarser grained disaggregation. [Srinivasan et al. 2006]. RForest. [Gao et al. 2015]. [Kim et al 2011]. [Parson et al. 2011] [Kolter et al 2011]. Event-based. CO. [Hart 1992]. DDSC. [Kolter et al. 2010]. Steady states. 1/900 Hz 15 min Smart Meter – PLC. 0.1Hz 10 s. Transient states. Harmonics. 0.1Hz. 1KHz. 20KHz. 1s. 1 ms. 50 µs. Smart Meter – HAN. SMPS. >100KHz Sampling frequency 10 ms. Sampling interval. Smart Meter - sensor Third-party devices. Figure 2.4: Disaggregation accuracy related to the sampling frequency..
(55) 18. State of the Art. Acronym. Stand for. DDSC FHMMs CO CFHSMM dHMM RForest MLP SVM CDM EMI. The Disaggregation via Discriminative Sparse Coding Factorial Hidden Markov Models Combinatorial Optimisation Conditional Factorial Hidden Semi Markov Model difference Hidden Markov Model Random Forest Multilayer Perceptron Support Vector Machine Committee Decision Mechanism ElectroMagnetic Interferences. Table 2.1: Table of acronyms for Figure 2.4.. Figure 2.5 is another example of why HF algorithms performs better, where Table 2.2 indicates the name of some features that will be discussed in the following subsections. Transient states cannot be characterised for LF (i.e. 0.1Hz < fs < 1Hz where fs is the frequency sampling), only the active power consumption P during steady states (i.e. normal operational mode of an appliance) and the difference between two steady states P . However, many features can be extracted from a range of 1Hz < fs < 20Hz, such as the Distortion power D and harmonics (HAR). Higher frequency rates allow to detect EMI noise produced by Switch Mode Power Supply (SMPS) that are unique for each appliance. Therefore, the richer feature extraction is the larger space to discriminate between appliances is. Figure 2.5 also serves to frame NILM into the energy disaggregation domain. Likewise, energy disaggregation can be also conducted based on Intrusive Load Monitoring methods (ILM) using multi-point sensors as in [Kato et al., 2009], or using an intrusive signature as in [McWilliam and Purvis, 2006]. However, these methods are out of scope in this thesis as they are much intrusive. Following the discussion, we proceed to detail LF and HF NILM algorithms. Then a discussion is open about the practical application of NILM in a real scenario (Section 2.1.4)..
(56) 19. State of the Art. Energy Disaggregation Signatures Multi-point sensors. NILM Signatures Non-Intrusive signatures. Intrusive signatures. Noise 1Hz < fs < 20kHz. 0.1< fs <= 1Hz RFID for Appliance Identification. ∆P. CW. Steady EMI. Steady + transient states. Steady States. P. Transient EMI. fs > 100kHz. PQD. HAR. WS. V-I Trajectories. IAW. Figure 2.5: Available signatures by frequency sampling. Acronym. Stand for. P. Active Power feature Delta value of active Power feature Active, reactive and distortion power trajectories. P PQD HAR WS. Harmonics Wave-Shaped features. CW. Current Waveform feature. V-I IAW IPW. Voltage-Current trajectories Instantaneous Admittance Waveform feature Instantaneous Power Waveform feature. Table 2.2: Table of acronyms for Figure 2.5.. IPW.
Figure
![Figure 1.1: Total energy of computing versus World’s energy production, adapted from [Beall, 2016].](https://thumb-us.123doks.com/thumbv2/123dok_es/7327351.357243/39.892.146.754.328.650/figure-total-energy-computing-versus-world-production-adapted.webp)


+7
![Figure 2.8: Comparison between CO, FHMM and Neural NILM using NILMTK, by [Kelly and Knottenbelt, 2015a].](https://thumb-us.123doks.com/thumbv2/123dok_es/7327351.357243/63.892.125.767.140.877/figure-comparison-fhmm-neural-nilm-nilmtk-kelly-knottenbelt.webp)
![Figure 2.10: Harmonics signatures for four appliances: water boiler, air conditioner, TV set and induction cooker; by [Liang et al., 2010b].](https://thumb-us.123doks.com/thumbv2/123dok_es/7327351.357243/69.892.121.748.163.476/figure-harmonics-signatures-appliances-boiler-conditioner-induction-liang.webp)

![Figure 2.17: Some of the 77 “tape of forget” sensors deployed in a house in [Tapia et al., 2004].](https://thumb-us.123doks.com/thumbv2/123dok_es/7327351.357243/85.892.180.710.242.590/figure-tape-forget-sensors-deployed-house-tapia-et.webp)

Documento similar
The key idea underlying the energy efficiency of network sharing is that network capacity supply can be modulated by switching off some networks for the time periods in which traffic
In our PIORT (Probabilistic Integrated Object Recognition and Tracking) framework, the static recognition module is based on the use of a classifier that is trained from examples
Being responsible for the legacy risks of the underground hard coal mining in Germany, RAG is developing a remote sensing-based monitoring workflow for the early detection and
fluorescent dyes) for in vivo imaging of living tissues are: i) permeation of a substrate is not required, making non-invasive techniques for in vivo monitoring of ROS/redox
Event yields and background predictions based on simulated events for all three-lepton channels after the basic event selection, which includes the trigger, Z boson, third
Figure 1 shows the detection time and the energy of neutrino event candidates passing the reduction cuts for GW150914 (left) and the energy spectrum of the remaining events, which
This approach, referred to as switching CTMC, is based on the standard four-body procedure as long as the two electrons are not bound to the same nuclear center, and switching
Finally, the central event in our proposal is formed by the third channel of de-excitation of the biexciton, namely the emission into the cavity mode of two simultaneous
