Tesis para optar por el título de Maestría en Economía
Título: Tropical Economic Miracles Estudiante: Mauricio Andrés Rodríguez Acosta
Director: Hernando Zuleta González
2 1. INTRODUCTION
The difference between the growth rates of Tropical and Nontropical countries has been widely studied by economic literature. It is a well recognized fact that Tropical countries (i.e. those located within geographical tropics, between latitude 23.45º N and 23.45º S), on average have had an inferior economic performance than Nontropical countries. As Sachs
et al. (1998) extensive study on the effect of geography on economic performance concludes, geography does matter for economic development, and one of the geographic facts that matters in this sense is the latitude of the country, “Tropical regions are hindered in development in comparison to temperate regions, probably because of higher disease burdens and limitations on agricultural productivity” (Sachs et al., 1998, p. 8).
According to Madison‟s (2008) data, Real GDP per capita (RGDP) adjusted by PPP for the 79 Tropical1 countries in the sample grew2 at a mean rate of 173% between 1960 and 2006, whereas for the 61 Nontropical countries this rate was 216%, which establishes a clear measure of the huge differences between Tropical countries and the rest on terms of their economic performance. This gap is even more significant if we observe the RGDP3 levels: in 1960 the average RGDP (in 1990 Geary-Khamis dollars) for the Tropical countries, was $1773 and for Nontropical ones it added up to $4891. However, 46 years later the average RGDP corresponding to Nontropical countries was $11783, whereas in Tropical countries it amounted to $4390, which is even below the average for Nontropical countries in 1960. This overwhelming result can be summarized by the fact that although the average RGDP for Nontropical countries was almost 3 times the average for Tropical ones in 1960, the mean growth rate of the RGDP between 1960 and 2006 was 43 percentage points higher in Nontropical countries.
However, as we explore other characteristics of the distribution of the RGDP for Tropical and Nontropical countries we find some interesting information. That is the case of the maximum value of RGDP. In 1960 United Arab Emirates (UAE), with a RGDP of $22433
1
Our definition of Tropical and Nontropical countries differs from the one used by Sachs et al. (1998). We classify a country as Tropical if 50% or more of its area is within the tropics and Nontropical if less than 50% is within geographical tropics. Geographical information was obtained from the Center for International Development (CID) at Harvard University. http://www.cid.harvard.edu/ciddata/ciddata.html
2
Table 1, Appendix 1. 3
3 had the maximum RDGP among Tropical countries, occupying the third place in a 140 countries sample, and being one out of the three4 Tropical countries ranked in the top 20. UAE‟s RGDP in 1960 amounted to two thirds of that of Qatar which is Nontropical and had the highest RGDP of the sample for that year, $33104. In 2006 the United States achieved the highest RGDP of the sample ($31049) but it was only 5% higher than the highest ranked Tropical country, Hong Kong, which reported a RGDP of $29489, occupying the second place in the whole sample for that year.
The change in RGDP distribution5 for Tropical countries, and in particular the change on its right tail, clearly suggests that the average (for both the growth rate and RGDP level) may be hiding the spectacular economic performance of some Tropical countries through the 1960-2006 period. Being this the case, it would reveal to us that Tropical countries are not necessarily doomed to be poor. As a matter of fact, we find that during the second half of the last century, some Tropical countries actually outperformed Nontropical ones. Those Tropical countries, which behaved above the expectations (we can derive from the “average
behavior”), are the countries on which we are eager to focus our study, and we would like to coin those countries as Tropical Economic Miracles (TEMs).
Despite the fact that material achievement (economic growth) is not the only dimension of economic development (Sen, 1988), it still happens to be an important part of it, and that is why this variable has been the core of multiple studies on economic development. Nevertheless, there is no doubt that understanding economic growth is an issue of great relevance on both theoretical and empirical economics. Thus, by implementing a case study on each of the TEMs we pretend to achieve a better understanding of the role that issues such as political and economic institutions have over economic growth, under an “adverse” geographic situation (i.e. being located within the geographical tropics). All these goes to the objective of providing answers to the following question: How did these countries became economic miracles? Is there any path to follow or are there a set of circumstances that would make of each case a very singular outcome?
4
The other tropical countries in 1960‟s Top 20 RGDP were Venezuela and, Trinidad and Tobago. 5
4 If those economic miracles within the tropics happen to be in fact “black swans” (Taleb, 2008), generalization from their experiences would be impossible, nonetheless we would have the opportunity to learn what did differentiate these Tropical countries that achieved a great economic performance from those that did not.
This document is composed of eight sections, including this introduction. In Section 2 we present the objectives of this research project. In Section 3 literature on the empirical determinants of economic growth is presented. In Section 4 we describe the Case Study Methodology and justify its pertinence for the current study, in this section we also present the cases we choose to study (Botswana and Singapore) and the algorithm that we use to select it. Section 5 presents an empirical exercise that supports the Case Study as methodological approach for our research question. Sections 6 and 7 are the case studies of Botswana and Singapore, respectively. And in Section 8 we conclude.
2. OBJECTIVES
General
To identify the main economic and institutional features of each TEM and its role on economic growth.
Specific
To generate a valid set of criteria to classify countries as Economic Miracles.
To identify, according to these criteria, the TEMs that took place in the period 1960-2006.
5 3. BACKGROUND
Due to the empirical nature of our document, we will emphasize on the empirical literature of economic growth. Nonetheless, it is still important to recognize that this kind of literature is based on the rich theoretical literature on the subject (Solow, 1956; Swan, 1956; Romer, 1986, 1990; just to mention a few studies).
In the last part of the 1980‟s and all through the 1990‟s, a great deal of empirical studies appeared, aimed to compare international evidence on economic growth, probably inspired by the new flow of theoretical literature which surged during those years (i.e., Endogenous Growth Theory). In this section we present some studies aimed to analyze the determinants of economic growth, and that used cross-country evidence for that purpose.
It is compulsory to start this review by mentioning the work of Sachs et al. (1998), as it constitutes our main reference point given that it is, to the best of our understanding, the most complete study relating economic growth with geographical features, which is exactly the departure point of our work. They summarize their findings in four main results: i)
Tropical countries had a slower economic development than Nontropical ones; ii) Coastal regions are in an advantageous position towards development; iii) Population density is favorable for economic development in Coastal regions; and iv) Population growth is negatively related with the potential for growth. Those countries that do not fit in the first result are going to be our subject of study.
Barro and Lee‟s (1994) study is one of many which explore the sources of economic
growth on a more “traditional” line. Using data from the World Bank and the Penn Tables in their fourth and fifth versions, they identify 5 key variables that could impact economic growth (obtained sign of the effect in parenthesis): i) Initial GDP per capita (-), once controlled for secondary attainment and life expectancy, they find evidence of conditional convergence, which means that the lower the initial GDP the higher the growth; ii)
Government‟s size (-), measured as the Government expenditure to GDP ratio; iii)
6 revolutions; v) Investment as proportion of the GDP (+), from which they obtain the neoclassical result of a positive relation between investment and growth.
Similar results have already been found by Romer (1986)6 and Barro (1989), with the only difference that in the former the literacy rate is interpreted as a proxy of technological
change instead of a Human Capital‟s proxy, which was one of the reasons why the latter
shows up. Barro (1989) also encounters that the school enrollment fits better as a proxy of Human Capital, than the literacy rate.
From Barro (1996) cross-country study we can extract two more results that may be relevant for our purposes: i) democracy does not seem to show a clear effect (measured as a function of the freedom to participate in the political processes) on economic growth. Nonetheless, the author claims that evidence may be suggesting that a higher degree of democracy (political freedom) increases economic growth when the level of democracy is either low or high, and will generate a decrease in growth when democracy is at an intermediate level; ii) high long-term inflation may reduce economic growth, even though the estimated effect of inflation is not large, it is still negative: an increase of 10% in the average annual inflation will reduce the annual growth by 0.3% to 0.4%.
On the other hand Garrison and Lee (1995), find that large budget deficits, high levels of government expenditure, high rates of inflation and high tax rates have no impact on economic growth. As we have seen in the papers quoted above, some of these variables are associated with a decrease in economic growth. Instead, they find that countries with a low variability of economic growth and with an orientation toward international trade may have a better economic performance.
In regard to democracy, Gupta et al. (1998) find evidence that supports the fact that democracy leads to a higher economic growth, but only if democracy is sustained and has long-run stability, if it is either unstable or leads to the marginalization of one group that as a consequence could rebel against this democratization (e.g. Tamil Tigers in Sri Lanka), it may have a negative effect on growth. The authors also highlight the fact that democracy
6
7 must be accompanied by policies toward education, international trade and land redistribution.
Sachs and Warner (1995a) establish two sets of criteria to classify countries either as
countries with “appropriate” market-based policies during the period of analysis (1970-1989) or not. The first set of criteria is related with property rights, and the second is related with the integration of the economy to international trade. They find strong evidence which supports the fact that poorer countries with a correct protection of property rights and with a reasonable position towards international trade (low levels of protectionism) may achieve growth rates that increase their income to the rich economies‟.
Using a Bayesian approach, Sala-i-Martin et al. (2004), put into question the robustness of the correlation between a large set of variables and the long run economic growth. They find strong evidence in favor of primary school enrollment, the relative price of investment and the initial level of income (supporting the existence of conditional convergence). They also find that the region and some human capital/health variables do matter.
In their work on Demographic Transitions in Emerging Asia, Bloom and Williamson (1998) add another variable to the pool of possible determinants of a country‟s good economic performance. They find that the population dynamics in the East Asian countries were a determinant of the great economic growth that those countries achieved during the second half of the last century. They estimate that one third of the annual economic growth between 1965 and 1990 may be accrued to the demography transition. In particular, they argue that a faster growth of the Working Age Population (WAP), compared with the rest of population, generates a positive effect on economic growth through the increase in per capita productivity.
Other branch of literature that is worth to mention is the literature focused on the effect of natural resources on economic growth, since most Tropical countries are resource abundant. Sachs and Warner (1995b, 1999, 2001), Gylfason (2001) and Gylfason and Zoega (2002), among others, find evidence that supports the so-called hypothesis of “the
8 through which this “curse” works. Basically, when the natural resource exploitation is prosperous, the incentives to invest in human or physical capital to be used in other sectors are offset, and by these means the economic growth is stagnated. These studies also stress out that natural resource dependent economies are characterized for high prices (through the Dutch Disease channel) that impede the right development of an industrialized exporting sector since the cost of production is inflated, and thus the international competitiveness is seriously harmed.
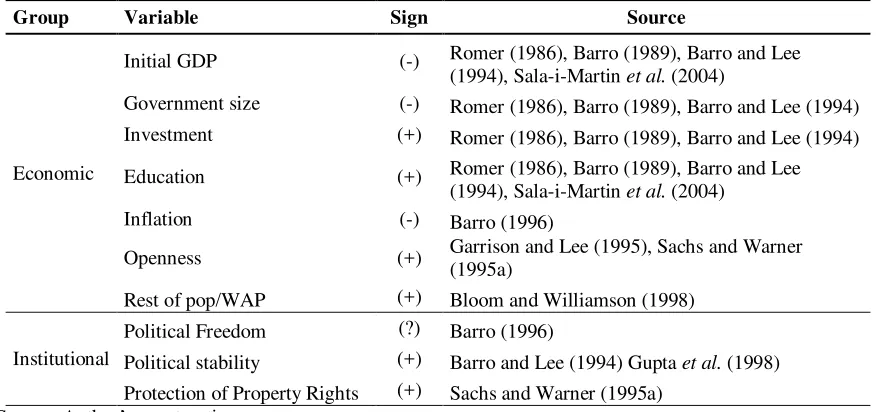
Table 1. Determinants of growth.
Group Variable Sign Source
Economic
Initial GDP (-) Romer (1986), Barro (1989), Barro and Lee (1994), Sala-i-Martin et al. (2004)
Government size (-) Romer (1986), Barro (1989), Barro and Lee (1994)
Investment (+) Romer (1986), Barro (1989), Barro and Lee (1994)
Education (+) Romer (1986), Barro (1989), Barro and Lee (1994), Sala-i-Martin et al. (2004)
Inflation (-) Barro (1996)
Openness (+) Garrison and Lee (1995), Sachs and Warner (1995a)
Rest of pop/WAP (+) Bloom and Williamson (1998)
Institutional
Political Freedom (?) Barro (1996)
Political stability (+) Barro and Lee (1994) Gupta et al. (1998) Protection of Property Rights (+) Sachs and Warner (1995a)
Source: Author‟s construction
Finally it is important to quote the study of Easterly et al. (1993), given the impact of its conclusions on the future development of our study. The authors call the attention on the
fact that despite the stability in countries‟ characteristics, high volatility of growth rates
over decades remains a remarkable factor, as, in their own words: “… countries are
„success stories‟ one period and disappointments the next.”7
They find that much of this variation in the economic growth is caused by random shocks. That conclusion, in particular, constitutes a warning regarding the criteria that we want to use to define the
“miracles” in our paper. On practical terms, we have to evade the possibility of misinterpret a random shock as a good policy result. A good way to avoid this problem is by including
in our definition of “miracle” not only current growth rates but also the future growth rates,
7
9 for example by defining the growth rate for a decade as a centered moving average. Table 1 presents a summary of the main determinants of growth identified by the empirical literature reviewed in this section.
4. METHODOLOGY
Given that we want to construct a case study for each identified TEM in our sample in
order to identify the characteristics of each “miracle”, it is logical that the most proper
methodological approach is the case study. As a matter of fact, as we do not intend to identify an independent phenomenon or cause, but instead our goal is related to recognize the interaction of the causes of each TEM and their outcome (“The Miracle”) as a whole, the case study is a useful approach according to Feagin et al. (1991).
For our matter of study the case study methodology results appropriate since “Case study analyses provide both the author and the reader with the opportunity to develop a rich
understanding of the conditions, processes, and outcomes that have governed the growth
experience of actual economies. As such, they provide a means of testing the implications of
existing theories and developing one's thinking on the growth process.” (Young 1992, 13).
Though for a different subject of study8, Sambanis (2004) also draw attention to the importance of performing case studies to complement statistical evidence, when one is dealing with problems that have multiple causes and a lot of heterogeneity in the information, due to the sources. And that is exactly the kind of problem we are dealing with in this study.
Hence, this methodological approach is our best choice since our matter of study has multiple causes: impressive economic performances achieved by TEMs do not have a single cause; instead they are the result of a system of multiple interacting causes. And to get as much information as possible for each miracle it would be necessary to recur to different sources in each case, aggregating some heterogeneity to the information.
In regard to the kind of study that we will perform, Yin (2003a) in his survey on case studies, estates that case studies should be classified in six classes: exploratory, descriptive, and explanatory, and each of this three may be single-case or a multiple-cases studies.
8
10 According to our understanding of each category, this study belongs to the descriptive and exploratory multiple-cases studies categories. Is descriptive in the sense that we will present a complete description of the TEMs and its contexts, and is exploratory since we do not know yet the causes of the extraordinary growth.
According to Yin (2003b) case studies have five main components on their research design, which, as the author states, serves as a logical plan to evolve from the research questions to the conclusions. Here we present these components and their equivalent for the current research proposal:
1. Study‟s question: How did some Tropical countries became economic miracles? Why these countries, and not others? Do these “Miracles” share common features?
2. Propositions or Purpose: As our study is in part exploratory, we need to define our purpose instead of stating some propositions. The purpose of this research is to identify the main economic and institutional characteristics of the TEMs and if possible to find out if these economic miracles share any features.
3. Unit of analysis: Is evident that the unit of analysis is each TEM, and from each individual case we will construct our multiple cases study. However, it is worth to mention that the TEM must be defined in both space (a country) and time (in some specific period). For example9 we would say: “Hong Kong became an economic
miracle during the 1980‟s”. So Hong Kong‟s economic policy during the 2000‟s will not be relevant for our study, since we are interested in the facts that cause a
great performance during the 1980‟s.
4. Linking data with purposes: Since this component is closely related with the relevance of the data to be reviewed, our starting point is the background literature on empirical economic growth, so we need to focus in aspects such as, investment, education, and Political Stability, among other recognized catalysts of economic growth.
9
11 5. Criteria for interpreting the findings: This component is highly important when we have rival propositions to prove and exists the need to choose one, but since our study is exploratory and we are not looking for a single explanation or cause, but for a set of multiple causes, the best way to include this component in our research is by contrasting several sources of information, both statistical and historical, and be sure that our findings are widely accepted.
Finally in Table 1 in Appendix 4 we present our version of Yin‟s (2003b) case study protocol, as it will give us a route to follow during the recollection of information for each of the single cases that will be part of the complete multiple cases study.
Case selection
In order to select the countries that are going to be part of our study we follow a simple algorithm:
1. We compute the 10-year growth rate for each country.
2. With the purpose to avoid having “false” economic miracles, that is countries which exhibit a great performances during one decade but during the following decade are a disaster (Easterly et al., 1993) we calculate the moving centered average of order 21 of the growth rates computed at 1, for each year. For example at 1975 we have the average of the 10-year growth rates from 1965 to 1985.
3. We select the two Tropical countries that remained more consecutive years among the top 10 of the moving centered average calculated at 2. According to Maddison‟s (2008) dataset we obtain that the pair of cases adjusted to this criteria are: Botswana (1970-1994) and Singapore (1971-1993). When the exercise is replicated for the data from the World Bank‟s World Development Indicators (WDI), results are the same in terms of countries and quite similar in terms of the period: Botswana (1970-1996) and Singapore (1970-1987)10.
10
12 Of course this algorithm is not an indisputable way to select TEMs, as there are other possible cases that by a different set of criteria may be classified as miracles. However, what is indisputable is that Botswana and Singapore had an amazing economic performance during the second half of the last century, and thus they deserve to be labeled as “Economic Miracles” and thus to be part of our study. In other words, we maybe failing for the exclusion of some cases, but we are not failing for the inclusion of these two cases.
5. EMPIRICAL EXERCISE
In order to add to the pertinence of the case study as methodological approach to determine the causes of the Economic Miracles within the tropics, we perform a classical economic growth measuring exercise. This exercise serve us to prove how growth paths differ between Tropical and Nontropical countries, and to demonstrate how growth measuring exercises may fail to find the specific sources of growth, in particular for the countries that achieved extraordinary economic performances under unfavorable geographic situations.
Table 2. Descriptive Statistics and Source
Variable Obs Mean Std. Dev. Source
Growth 5653 22.699 0.449 Heston et al. (2009) Ki 6622 19.872 0.146 Heston et al. (2009) Kg 6626 18.209 0.127 Heston et al. (2009) Lsc 4525 8.251 0.130 Barro and Lee (2000) l10.rgdp 5653 7580.631 130.961 Heston et al. (2009) Author‟s calculations
In this regard we estimate four econometric models, following the main findings of Barro and Lee (1994) as a benchmark. In each model the dependent variable is RGDP per capita‟s ten-year growth rate, while the explanatory variables are: Investment/GDP ratio (ki), Government Expenditure/GDP ratio (kg), as proxy of human capital we use the percentage of the population older than 25 year that completed secondary (lsc), and the 10th lag of the RGDP per capita to control for convergence (l10.rgdp). Observations, Mean, Standard Deviation, and Source of these variables are presented in Table 2. With exception of lsc
13 Estimations were performed for 102 countries, 50 Nontropical and 52 Tropical, between 1960 and 2005.
The first Model presented in Table 3 is an OLS pooled regression. From this benchmark exercise it is possible to observe that the classical results of Barro and Lee (1994) are maintained: growth depends positively on investment and human capital; and negatively on initial RGDP evidencing the existence of convergence, and on Government Expenditure as percentage of the GDP. These results do not change when controlled for tropical, a dummy
that is active when more than 50% of the country‟s area is within the tropics, according to the CID geographical data; tropical has the expected (negative) sign. In addition to the OLS
models, Panel Data models are estimated, both in Random Effects (RE) and Fixed Effects (FE) specifications.
Table 3. Determinants of Economic Growth
Variable Linear Linear2 RE FE
ki 1.3174*** 1.2311*** 1.0869*** 0.9989*** (0.0566) (0.0575) (0.0592) (0.0622) kg -0.6339*** -0.6998*** -1.1866*** -1.2385*** (0.0665) (0.0647) (0.0845) (0.0882) lsc 0.9038*** 0.7686*** 0.3699*** 0.2573*** (0.0646) (0.0675) (0.0843) (0.0865)
tropical -10.0469***
(1.1624)
l10.rgdp -0.0015*** -0.0017*** -0.0025*** -0.0026*** (0.0001) (0.0001) (0.0001) (0.0001) Constant 9.1356*** 19.6413*** 33.9799*** 39.7128*** (1.6474) (2.0617) (2.7595) (2.2083)
Observations 3973 3973 3973 3973
R-squared 0.279 0.296 0.257
Number of id 102 102
Robust standard errors in parentheses *** p<0.01, ** p<0.05, * p<0.1
Source: Heston et al. (2009); Barro and Lee (2000). Autrhor‟s calculations.
Results are robust to the different specifications of the model11, and when the usual consistency tests are performed the FE model results to be the most recommended. This implies that there are country-specific characteristics, besides these usual “growth sources”, that explain the economic performance of each country. However, these specific variables,
11
14 such as the institutional frame, are hard to measure so it is difficult to incorporate it in a cross-country analysis where the comparability of the variable is necessary.
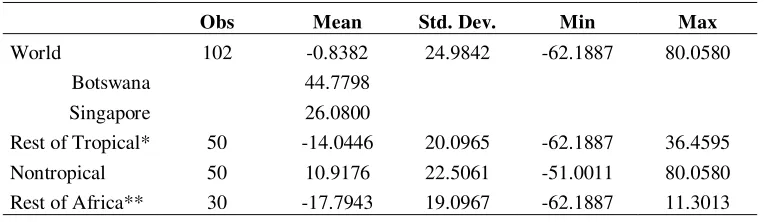
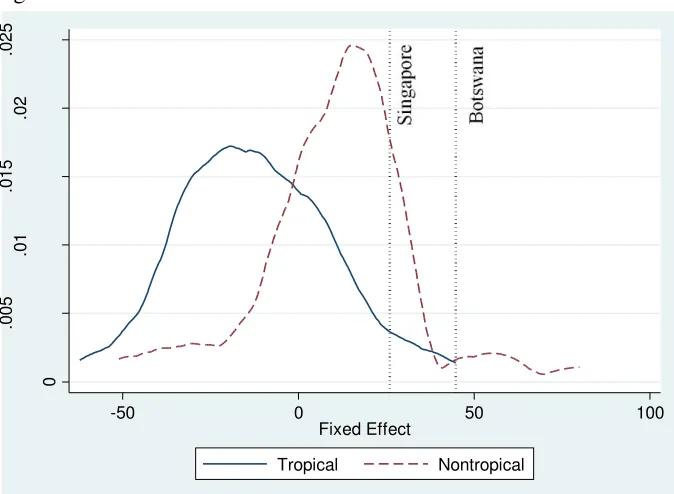
[image:14.612.116.501.296.407.2]Finally in Table 4, we present the fixed effects obtained from the FE model. Results are consistent with our case selection, as Botswana has the largest fixed effect for the Tropical countries and Singapore has the third behind Hong Kong. It is possible to observe that the difference between our selected cases (Botswana and Singapore) and the rest of the Tropical countries is huge, and its fixed effect is even above the mean of the Nontropical countries12. Moreover, when Botswana is compared with rest of Africa differences are even extremer, as its fixed effect is almost four times the value of the second largest (Lesotho).
Table 4. Fixed Effects
Obs Mean Std. Dev. Min Max
World 102 -0.8382 24.9842 -62.1887 80.0580
Botswana 44.7798
Singapore 26.0800
Rest of Tropical* 50 -14.0446 20.0965 -62.1887 36.4595 Nontropical 50 10.9176 22.5061 -51.0011 80.0580 Rest of Africa** 30 -17.7943 19.0967 -62.1887 11.3013 *Excluding Botswana and Singapore. **Excluding Botswana
Source: Heston et al. (2009); Barro and Lee (2000). Autrhor‟s calculations.
This evidence results important for our purpose in two dimensions: i) classical determinants of growth are not sufficient to explain countries economic performance thus country-specific analysis, in particular the case-study approach, results necessary in order to deepen on the catalysts of great economic performance; and ii) the fixed effects obtained are compatible with our case selection, demonstrating that despite being Tropical, Botswana and Singapore, had some specific features that allowed it to achieve an incredible economic growth.
In order to unveil the particular characteristics that accounted for Botswana‟s and
Singapore‟s rapid economic growth, the following two sections of this document are devoted to expand on each of these cases, with particular emphasis in the 1970‟s and
1980‟s.
15 6. BOTSWANA – A RESOURCE BLESSING
We decided to start this part of the document with, what we believe, is one of the most amazing cases of economic success during the second half of the last century. Botswana is located in the poorest continent of the world, is landlocked, around 70% of its territory is within the geographical tropics, and about the same percentage is covered by the Kalahari Desert. However, despite these “unfortunate” geographical circumstances Botswana managed to exhibit an incredible economic performance that, countries with better “initial
conditions” have not achieved. According to Madisson‟s data (2008), from 1970 to 1990 Botswana‟s RGDP grew 411%, in 1970 the RGDP added to $647 (1990 US dollars) occupying the 128th out of 140, while by 1990 its RGDP was $3,306 and it ranked 87 out of 162 countries in the sample.
What were the keys for this “unexpected” outcome? We believe that the visible causes of this result can be grouped in three categories: i) Political Stability; ii) Mining; and iii) Trade Policy. It is important to highlight that beneath each of these categories and in their interactions, inheritance of Twsana13 people‟s ancient institutions (traditions) played an important role, since a great deal of civil servants‟ attitude towards public resources and decision making processes was in fact, inherited from the pre-independence tribal times. Political Stability allowed Botswana to elaborate and execute long run development plans, as well as establish positive relationships with foreign investors that perceived a good business climate, since risk of expropriation was lower compared with other African countries where democracy was not as stable as in Botswana. The case of economic transformation due to its mineral richness is perhaps the most known cause of Botswana‟s prosperity, which evolved from an agricultural economy to a mineral-industrialized economy. The way in which diamond richness was managed, is a clear example of how resource wealth can be converted into a blessing instead of a curse (as many other African countries have experienced). Botswana‟s success may be labeled as a resource blessing, being “adequate resource management” the line that separates blessings from curses. Finally, regarding to Trade Policy, Botswana has had a pro-openness position since its independence, evidence of this was its early membership to the Southern Africa Custom
16 Unions14 (SACU). As a consequence of the impossibility to set its own tariffs freely, Botswana could not totally protect its national industry, avoiding the negative effects on external competitiveness of the import substitution industrialization model followed by
many developing countries during the 1980‟s (Leith, 2005).
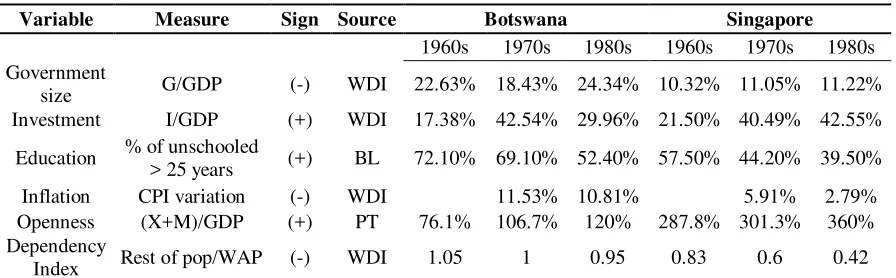
We will start this section by presenting some economic indicators, to understand the context in which the amazing economic growth was accomplished, and then we will return to the description of each of these three categories that we believe were the key determinants for Botswana to become an Economic Miracle.
6.1BOTSWANA’S ECONOMIC CONTEXT
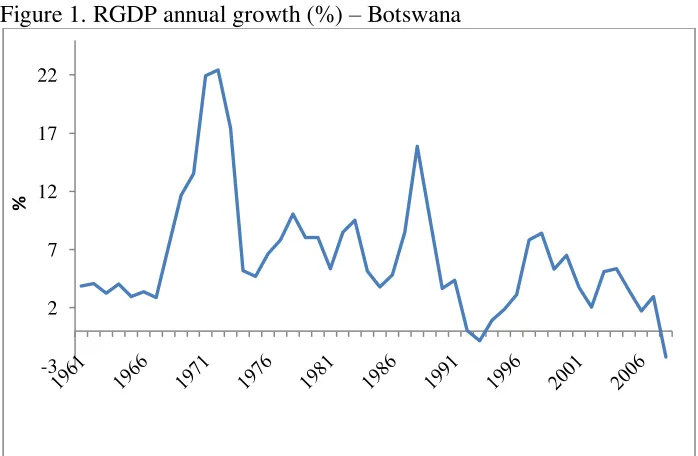
Besides its impressive GDP per capita growth (see Figure 1 in Appendix 2 (A2)), Botswana achieved positive results in other macroeconomic indicators. Though inflation may be
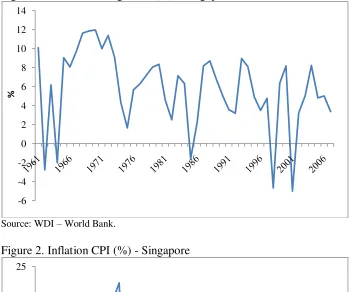
labeled as high using developed countries‟ standards, when compared with developing countries in particular with other African countries Bostwana‟s inflation level was relatively low, always under 18%, as shown by Figure 2 in A2, having an annual average of 10.3% between 1974 and 2005. This economy did not suffer of “modern” hyperinflationary processes as many developed countries had15, avoiding the misallocation of resources, that results from such processes. This “low” level of inflation is even more remarkable when
one thinks that Botswana‟s major export is diamonds. As stated above, according to Barro (1996) findings long-term high inflation has a negative effect on economic growth.
As Leith (2005) points out, one of the most impressive changes evidenced in Botswana, was the rapid transformation of its economic activity structure. At 1975 both industry (which includes mining) and agriculture, account for a 30% of the GDP each. From then, industry experienced a fast expansion, while agriculture experienced the complete opposite. By 1989, the former accounted for 2/3 of the GDP, while the latter was less than 5% of the GDP (See Figure 3 in A2). The increase of more “prone to accumulation” activities, as
those of the industrial and mineral sector is closely related with the evolution of economy‟s
investment. Figure 4 in A2, shows an increase of the gross capital formation as percentage
14
The other members of this Customs Union are: South Africa, Lesotho, Swaziland, and Namibia.
17
of the GDP from the mid 1960‟s to the beginning of the 1970‟s, then investment fluctuates
around 45% of the GDP until the end of the 1980‟s. At the beginning of the 1990‟s the investment/GDP ratio was back to its pre-crisis levels.
Regarding to the its economic relation with the rest of the world, Botswana‟s exports as percentage of the GPD experienced a constant increase from 1969 to 1987, period in which this value augmented from 23% to 75% (see Figure 5 in A2), after the world crisis at the
1980‟s, diamond sales declined around the world, thus Botswana‟s exports reduced to 50%
of the GDP by the end of that decade, and remained around that level until now. Imports as percentage of the GDP increased during the first post-independence years until 1981, when its level was 71%, after that, a rapid decrease is observed, falling below 40% at the beginning of the current decade. Imports behavior can be partially explained by,
Botswana‟s general Trade Policy. Instead of protecting local industry with high tariffs, maintaining low import levels, but with an uncompetitive national productive system, Botswana followed an opened model, and signed into the SACU. Hence, instead having low imports/GDP ratio at first, and a high ratio when openness became inevitable,
Botswana managed to “substitute” imports by having a constantly competing local industry, ready to compete in the long-run with its closer partners.
As exports and imports grew in importance, Botswana‟s trade picked at the end of the
1980‟s, when total trade represented 123% of the GDP as shown in Figure 6 in A2. These numbers validate our view of the importance of trade on Botswana‟s economic achievements. After that, trade slowed down and during 1990‟s and 2000‟s, fluctuating between 80% and 90%. Figure 6 in A2, also shows the External Balance, which remained negative until 1983 when the commercial deficit was around 20%, from 1984 Botswana
always achieved current account surpluses, whit its highest point at the end of the 1980‟s. Overall, the trade “picture” of Botswana seems rather positive. Not only the ability to penetrate international markets is evident, but also the capability to sustain a positive balance with the rest of the world in the long-run.
Finally, regarding to the population structure, Botswana had a positive evolution as its
18 find that Demographic Transition played a main role in East Asian rapid economic development, since a reduction in the dependency index implies an increase in labor‟s productivity. So from Figure 7 in A2, it is observed that regarding to population, Botswana may experienced a similar transition to that of the East Asian countries. In addition Botswana also experienced an important reduction in the percentage of unschooled population over 25, by 1965 72% of this group was unschooled, and by 1995 this percentage was reduced in a half to 36% (Barro and Lee, 2000).
This brief review of some of Botswana‟s macro-indicators leaves the following broad conclusions about its economic context: i) macroeconomic stability, at least monetary stability, was achieved; ii) trade played a main role, and a sustainable a positive relation with the rest of the world was attained; iii) high levels of capital investment were accomplished; and finally iv) Botswana experienced a demographic transition favorable to foster economic growth, and an important reduction in the unschooled population.
6.2BOTSWANA’S KEYS FOR THE “MIRACLE”
i. Political Stability
Though Botswana is a young nation, independent since September 1966, its democracy and political institutions have been quite stable. First elections were celebrated in 1965, still as British Protectorate, and since then they took place every five years. Botswana has never suffered a coup, nor civil neither military, contrary to the experience of several other African countries. Botswana‟s Democratic Party (BDP) has been the ruling party
uninterruptedly since first elections, basically because it represents the Botswana‟s ethnic
majority (Twsanas) and because it managed to have healthy relations with both rural peasants and elites16. The BDP17 was founded by the most significant statesman of Botswana, Seretse Khama. Khama was the first president, and served in the office until his dead in 1980, playing an important role in the country‟s transformation from one of the
16
During the years, popular support to the BDP has been declining due to the urbanization of the population in particular, the BDP seems to have little support from the urban working class.
17
19 poorest nations in the world18 to a prosperous independent nation. As addressed by Leith
(2005) and Matin (2008), Khama‟s leadership, had an undisputable effect on Botswana‟s development. One fact that in particular depicts his long-run vision of a developmental state was the Mines and Mineral act of 1967, which entitles the Central Government with the rights of exploitation of the subsoil wealth. As remarked by Leith (2005), Khama believed that leaving these rights in hands of the regional authorities or of private companies would deprive the Central Government of an important revenue font to finance public investment. This single fact would have an impressive impact on Botswana‟s mineral-guided economic development.
Besides Khama‟s leadership, according to Tsie (1996) Political Stability in Botswana is explained by the government‟s rule of law, as well as by the low level of corruption and
human rights‟ violations. This author also emphasizes in the fact that Political Stability has been a central element in Botswana‟s accelerated development process.
Nonetheless it is worth to mention an important feature of Botswana due to its impact on the future development of the country and its Political Stability: At independence its major an almost unique mean of accumulation was cattle. This fact had an important effect on its political context through three main channels: i) as cattle is easy to move, it was
“protected” against predatory practices (Leith, 2005) discouraging the formation of corrupt predatory institutions, that deter the private initiative; ii) not all individuals own cattle, and in some cases they have to recur to the good-will of owners to borrow it, this situation created a patron-client system of loyalty between cattle owners (future political elite), and rural peasants (future political capital of the BDP; Samatar, 1997); iii) as principal source of national wealth, prosperity of cattle sector was a common interest not only for cattle owners, but for the whole society, providing to the new independent government a unique environment of social cohesion towards the common objective of developing this sector, which also facilitated the coordination of the Trade Policy, as there was no rival interests.
Thus, Botswana‟s government did not have to start for achieving agreement between its political and economic majorities, but for maintaining the ex-ante concurrence, which
20 implies that at least the first step through Political Stability was accomplished even before independence.
Regarding to this common interests by the time of independence several scholars (Tsie, 1996; Samatar, 1997; Acemoglu et al., 2003; Leith, 2005, Martin, 2008), recognize that a great deal of this shared interests rest on the need for maintaining a competitive beef exporting sector, in particular a competitive exchange rate was desired. They also coincide in the fact that fortunately, rulers understand that the best way to protect these interests was by the impulsion of economic growth and development promoting policies. Government‟s position in favor of the capitalist accumulation and property rights protection, derived from
the elites‟ interests, definitely trace the path for Botswana to have a development promoting
state instead of a predatory one, and the evolution of “good” institutions in the terms of Acemoglu et al. (2002).
In addition to the importance of the common interests at independence on Botswana‟s Political Stability, another remarkable feature was the formation of a prepared political body. In 1966 Botswana lacked of prepared civil servants, president Khama who lived and studied in England during the mid 1940s, decided that the best way to build an efficient civil service, was by enrolling prepared foreigners and Batswana expatriates, instead of employing unprepared residents19. Other African countries fail to build a responsible public apparatus under the pretext of protect their national interests, but president Khama had a different view on the subject, in his own words: “we should never sacrifice efficiency on
the altar of localization” (Leith 2005, 57)20. The foreign nature of the civil service was born in the form of technical assistance, but not the common short-term assistance; instead these foreign experts lived for long periods in Botswana, and some of them even adopted the nationality, as remarked by Leith (2005). This long-term character of the assistance has two outcomes, first policy recommendations were designed according to Botswana‟s characteristics and needs; second foreign experts were able to train Botswana‟s nationals, whom will be the base of a national professional civil service.
19
According to Acemoglu et al. (2003), at independence only 22 Batswana were graduated from University. 20
21 As Samatar (1997) highlights, merit and professional capability were on the basis of the construction of this modern bureaucratic system, professionalization from the beginning allowed to have an efficient public apparatus. Since its independence, due to its own decisions, Botswana had the benefit of counting with experts on public policy design, and the result of it was evident when compared with other regimes less prone to employ foreigners, as Somalia. This efficient apparatus has an important share on the constant success of the BDP, but the relation goes in two ways. Given the long time needed to
construct such a professional system, beginning from the “imports” of experts, if Botswana did not have Political Stability this bureaucratic system would never be emplaced.
A general outcome of Political Stability was economic stability, clearly reinforced through the middle-term National Development Plans21. These plans create in advance boundaries on fiscal expenditure, impeding excessive expenditure, and thus excess of money circulation (hence inflation) during the booms of fiscal revenues (closely related to booms in the diamond market as explained bellow, which as external shocks result hard to manage). Instead, during positive shocks on revenues, government was able to accumulate foreign exchange reserves, which played an essential role in maintaining a favorable exchange rate, in order to avoid the negative effects of Dutch Disease on the exports sectors other than mining (Leith, 2005; Martin, 2008).
However, the most important particular consequence of Botswana‟s Political Stability, which has been always associated with its public commitment to the protection of property rights (Acemoglu et al., 2003), is its undisputable impact on government‟s social contract with foreign investors. Foreign investors perceived protection of their interest and low political risk; Leith (2005) remarks that investors perceived low risk of time-inconsistent policies, a perception funded in the large political majority achieved by the BDP, which deterred a “winner takes all” behavior because, after all the party will remain in the power. In exchange for this favorable climate, investors were more prone to do long-term investments and to reinvest their revenues, which were essential for the construction of
21
22 modern infrastructure in Botswana. FDI played an important role in Botswana‟s economic performance (Op. Cit.).
The most remarkable example of this long-term links between government and foreign investors, as pointed by Tsie (1996), Martin (2008), and Acemoglu et al. (2003), is the joint-venture that took place between De Beers22 and Bostwana‟s government over Debswana23, company in charge of the Botswana‟s diamond exploitation. This relation with De Beers was quite favorable both for the private investors and for the government. De Beers perceived a higher level of protection due to the joint participation of the government in the company, increasing its incentives to assume the initial costs of the exploitation given the lower probability of expropriation (Martin, 2008). In regard to the government, on the one hand it has access to one half of Debswana‟s revenues, allowing it to finance its investment in physical and human capital (Leith, 2005), key factors on the positive economic performance during 1970s and 1980s. On the other hand, the government took advantage of De Beers‟ expertise in the diamonds market and its ability to sustain a favorable price, due to its market power (Martin 2008). Botswana‟s production was
completely marketed through De Beers‟ sales filial, Central Selling Organization, which controls the majority of the diamonds‟ sales around the world (Gemawat and Lenk, 1990; Modise, 2000).
ii. Mining
One of the most remarkable features of Botswana is the importance that diamond exploitation acquired. However, at independence Botswana did not export any diamonds, in fact diamond mining did not start until early 1970s (Modise, 2000). During the 1970s Botswana experienced a rapid transformation of its economic structure (see Figure 3 in A2). As Leith (2005) remarks Botswana was an agricultural (cattle) state at the beginning of the 1970s, and by the end of that decade mining was the second largest sector in the economy, and this trend continue during the 1980s. This impressive transformation was a
central element on Botswana‟s economic performance.
22
Since its establishment in 1888, De Beers controlled the world supply of diamonds. Ghemawat and Lenk (1990)
23
23 The first great mineral finding occurred in 1967, when De Beer‟s geologist found the Orapa Kimberlite pipe24. “The Botswana government signed a joint-venture agreement with De
Beers creating… Debswana. Under this agreement De Beers started up the Orapa mine in
1971 and continue to operate it on Behalf of the government” (Ghemawat and Lenk 1990,
3). Another major finding, which marked the role of Botswana as one of the major diamond exporters in the world market was the opening of the Jwaneng mine in 1982 (Gemawat and Lenk, 1990; Modise, 2000); as an scholar points out “The commissioning of the Jwaneng diamond mine in 1982 further reinforced this structural change in Botswana's economy
from one dominated by beef exports to a diamond-dependent one” (Tsie 1996, 599).
Those great findings would trace the path for Botswana to become a main participant in
diamond‟s world market. Between 1981 and 1982 Botswana‟s diamond output increased by more than a 50%. Diamond‟s production in Botswana grew from 2.4 million carats in 1976 to 10.9 million carats in 1983. This impressive growth in diamond‟s production was
achieved through the massive De Beers‟ investments in Orapa and Jwaneng mining
complexes (Curry, 1987). Nonetheless, these investments proved to be more than effective, since by 1982, Botswana‟s diamond mines were among the most productive in the world: $10 dollars per carat in 1982, against $20 and $98 dollars per carat in South Africa and Namibia respectively (Gemawat and Lenk, 1990).
In the core of the relation mineral richness – economic development, was the Mine and Mineral Act of 1967. Proposed by president Khama, this act guaranteed the rights of the Central Government on the subsoil mineral richness. This “crucial decision” as labeled by Acemoglu et al. (2003), demonstrates Khama‟s interest in general progress, since before
the act mineral richness was entitled to the tribe than owns the land, and despite that Bangwato tribe (of which Khama was the chief) owned the richest mineral lands, he preferred to transfer the ownership of mineral sources to the central government. Leith (2005) remarks that Khama chose to use mineral revenues for national purposes, ownership of mineral richness allowed the government to finance investment in physical and human capital, that by the time of independence were quite limited in Botswana.
24
24
In order to obtain revenues from mineral activity, Botswana‟s government opted for an alternative to the “common” royalties‟ model (Leith, 2005). Even though, companies have to pay a royalty for exploitation rights, and to pay a tax according to their revenues. Government decided to have a more direct participation in mineral activity through its joint-venture with the private sector, Debswana. This participation as owner, allowed the Government to have a firsthand control of private initiatives, that otherwise may deter transfers from private to public hands (Curry, 1987). According to Gemawat and Lenk (1990), 20% of Debswana‟s revenues were directed to Operating Costs, 25% to De Beers
and 55% to Botswana‟s government. This combined model of taxation and participation, proved to be successful manly because a long-run relation between private investors and government was build, allowing the reinvestment and redistribution of mining revenues which, all in all is the way in which mineral richness was translated into economic prosperity.
Joint participation, continuous private investments and a mineral richness well above expectations, improved government‟s bargaining power, and thus its ability to obtain fiscal revenues from the mineral activity, Curry (1987). As Hill (1991) states, the Botswana government had two main sources of revenues, custom revenues and mineral revenues. These mining revenues came mainly from the diamond exploitation, through the long-term agreements with De Beers. According to Curry (1987), by 1982 mineral production represented around 40% of the GDP, twice as its value four years before. By the mid 1980s mineral revenues represented almost a half of the total fiscal revenues and this trend continued during the 1990s.
25 expectancy at birth in 1966 was 46 years, it increased to 67.5 years in 1999; under-five child mortality decreased from 15% in 1981 to 5% in 1997; net enrollment rate grew from 42% in 1971 to 98% in 1997 (Op. Cit.).
Even though mineral richness played a key role in the development of Botswana, resource richness has been a curse more than a blessing for most of the Sub-Saharan countries (Sachs and Warner, 1995b, 1999, 2001; Gylfason, 2001; Gylfason and Zoega, 2002; for the particular case of Botswana: Martin, 2008; and Mikesell, 1997 for the case of mineral rich countries). This means that what appears to be a particularly positive initial endowment results in an unmanageable burden. Those countries that find out how to exploit the possibilities allowed by this richness seem to be the exception rather than the rule.
Botswana‟s case turned out to be a resource blessing (or a Miracle) for the mixing of two causes: good luck and good institutions. Good luck, as stated by Leith (2005), firstly because of the nature of the diamonds that are founded in Botswana, diamonds there (and in the rest of Southern Africa), are embedded in Kimberlite rocks, thus a huge extractive infrastructure is needed in order to exploit the Kimberlite pipes. This eases the state control over the mineral activity, the legality of it, and the transfer of revenues from the extractors to the government; contrary to the alluvial exploitation of diamonds, which is done in small scale, hardly regulated and are sadly known for being the financing source of several conflicts in Central Africa (e.g. Angola, Democratic Republic of Congo, and Sierra Leone), since its exploitation is commonly controlled by illegal armed groups. Secondly because of the quality of the foreign investors, which instead of corrupting and bribing the government decided to establish a long-run relationship with it; this healthy behavior was encouraged by the amazing richness of the subsoil, which guaranteed revenues over a very long time horizon.
26 through high quality institutions. An institutional framework devoted to the protection of property rights, inherited from the pre-colonial institutions25, favored the presence of foreign investors decided to maintain long-run investments, and allowed the existence of a healthy relation between the government and the private entrepreneurs. Without the adequate legal enforcement of property rights, foreign investors would never emplace such impressive extraction complexes in Botswana, and much of its richness would probably be unexploited (Op. Cit.). In addition to the protection of property rights, Khama‟s leadership allowed the redistribution of mineral revenues. As part of his agenda, first he ensured the property of the subsoil richness to the Central Government, and then devoted the mineral revenues to improve the country‟s infrastructure, access to education, and health. It is clear that without the proper institutional framework Botswana would never achieve the impressive mineral-guided progress that turned it into an Economic Miracle.
iii. Trade Policy
The SACU was established at the beginning of the 20th century, well before Botswana‟s independence, between South Africa and the British High Commission Territories (which included the Bechuanaland protectorate, current Botswana). After Botswana‟s, Lesotho‟s,
and Swaziland‟s independence, SACU terms were renegotiated in 1969 with South Africa
in order to favor the three smaller and least developed members of this union. Renegotiation of SACU terms allowed Botswana to obtain a more share of the revenues from imports‟ tariffs, and thus accelerate its “economic” independence from the Great Britain, that during the first decade of independence provided a good amount of the fiscal revenues in the form of foreign aid (Leith, 2005; Tsie 1996). As remarked by Hill (1991) joint to mineral revenues, customs revenues were one of the largest sources of public income, and mineral activity had a positive impact on customs revenues, a great deal of capital goods had to be imported for mineral exploitation. According to Curry‟s (1987) data around 25% of fiscal revenues during the first half of the 1980s came from customs revenues.
As South Africa maintained the control of the SACU until the mid 1990s, Botswana‟s government had nothing to say about tariffs, this implied that it lacked of the necessary
25
27 power to protect the local industry, which somehow avoided the implementation of an Imports Substitution Industrialization (Leith, 2005). Nonetheless, the local manufacturing industry remained underdeveloped, mainly because of the high competitiveness of neighbor industries and the appreciation of the local currency (the Pula) against the South African Rand (Taylor, 2002).
Besides fiscal revenues, Botswana‟s Trade Policy left two important outcomes first, in 1975 an agreement that covered beef exports to Europe was achieved, allowing the entry to Europe of beef from Botswana at a favorable tariff. This agreement fostered beef exports to Europe, favoring must of the rural population, which were almost exclusively devoted to ranching, well as large cattle owners or as humble peasants. Second, as a member of the Customs Union, Botswana has the right to move its merchandise freely through the whole territory of the Union allowing it to access the coast, which in some degree helped to diminish the negative geographical condition of being landlocked (Leith, 2005).
By the mid 1980‟s diamonds already represented around a half of Botswana‟s exports
(Curry, 1987). Other success of Botswana‟s Trade Policy was the agreement of commercialization of these diamonds. The government had agreement which guaranteed that all of its diamond production was bought by the Central Selling Office (CSO), De
Beers‟ distribution branch. This agreement favored the government since it took advantage
of De Beers‟ large expertise in the diamond market, and also allowed it to obtain rents from
the market power exerted the CSO (Leith, 2005; Ghemawat and Lenk, 1990).
6.3FINAL REMARKS ON BOTSWANA
28 Government functioning also exhibits an inheritance from Twsana‟s institutions, in its accountability and consensus-seeking decision process. Back in the tribal times, each tribe had a Kgotla, a sort of a local council where “tribal policies” were debated and approved. After independence they were replaced with actual councils that acted as overseers of
Central Government‟s policies. It was also a convention the Government‟s seek for consensus, policies were usually debated among several ministries in order to obtain a more pluralistic, objective and popular outcome (Samatar, 1997; Leith, 2005).
A final feature of the inherited institutional framework was the attitude towards saving. Victim of crude and long-lasting droughts Twsana people learn that during prosperous times a portion of the outcome must be saved for the less favorable times (Leith, 2005), similarly to what happens in countries with seasons (Zuleta, 2008). This attitude, joint to the necessity accountability exercised by the British government over the financial aid offered during the first years after independence, evolved into a middle and long-term planning of fiscal expenditures, which maintain the expenditure fixed and devoted to developmental projects, thus unexpected income was saved. Government savings during exports booms served as a macroeconomic stabilizer, as Hill (1991) points out that
Botswana‟s government used unexpected revenues from mining booms to accumulate
international reserves, instead of using it for additional public expenditure. This policy helped to avoid the exchange rate appreciation, a typical symptom of the Dutch Disease, and thus it helped to protect the exporting sector, in contrast to the experience of African oil producers.
However, as may be inferred from by the recently re-elected president Ian Khama‟s inauguration, Diamonds are not forever26. Botswana still has two serious –related– challenges for the future: i) diversify its diamond dependent economy; ii) reduce the high levels of unemployment, currently above the 17% according to World Bank. Despite the efforts to impulse other sectors beside the mineral one, diversification still remains incipient in Botswana. And as mineral exploitation is highly capital intensive, Botswana
economy‟s capacity to generate employment, in particular for the growing urban working
class, remains low. The government has been promoting new entrepreneurs through
26
29 developmental banks however this policy is far from success, and as highlighted by Martin (2008) there is still a need for the redistribution of mineral richness among the whole population. Nonetheless, Botswana achieved so much with very obscure prospects at the
time of independence, so there are reasons to believe that Botswana‟s economic prosperity
would eventually reach those who remain not favored.
7. SINGAPORE – THE LION CITY27
Singapore is one of the most remarked cases of economic success during the second half of the last century. Regardless of its minuscule area, 710 km2, and the complete absence of natural resources, Singapore managed to transform its economy into one of the most powerful and modern systems of the world. Geographically, Singapore took advantage of its position that, in addition to its size and the fact that it is an island, created a complete dependency on the rest of the world, proof of this is that even water must be imported.
Singapore experienced an amazing progress from a middle income economy to a rich one,
according to Maddison‟s (2008) dataset, in 1970 Singapore‟s RGDP per capita ranked 39 of 140 with a value of $4,439 (1990 US dollars), by 1990 its RGDP per capita grew 220% reaching a value of $14,220 occupying the 18th place in the sample. At 2006 Singapore had the 5th largest RGDP per capita of the world.
Beneath this impressive performance we found three gross causes: i) the Political Stability;
ii) the Economic Transformation; and iii) its sounded Openness. As in the case of
Botswana, Singapore has a major ruling party the People‟s Action Party (PAP), which since
independence has obtained the majority of the sits in the parliament (Haas, 1999). This situation, allowed the continuity of developmental and transforming policies, and strengthened investors‟confidence since the PAP‟s regime demonstrated a full commitment with the protection of the property rights, and enhanced the private initiative. Again, stability of political institutions devoted to the enforcement of private property demonstrated to be central for the attraction of foreign capital. Singapore also experienced a notable Economic Transformation, from a raw labor intensive manufacturing economy with high unemployment rates at the mid 1960‟s, to a developed services center by the 1980‟s,
27
30 with an intensive use of both physical and human capital. Its production path moved from manufactured merchandises with a low level of value-added, to the production of technological goods (e.g. microchips, electronics) and services, which off course involve a higher level of value-added. Finally as stated by Rumbaugh (1995), Singapore may be labeled as a free trade regime, not only because of the free flow of merchandise and services, but also because of the low level of restrictions on capital flow. Its open position toward trade both inwards and outwards is related with the fact that imports are necessary for an island that lacks of natural resources and land; as well as exports are essential to develop the economic apparatus due to the small size of the domestic market. In addition to the low barriers for international trade, Singapore also facilitated the flow of capitals, as a remarkable portion of its development relayed in Foreign Direct Investment. Hand in hand with its Economic Transformation its exporting path evolved from simple re-exports to exports of services and high-technology goods.
All three main causes are linked trough the attraction of foreign capital. Political Stability and Openness set the proper environment for the arrival of international capitals. While Economic Transformation and rapid expansion of exports, would never be achieved in the absence of the financial muscle provided by the foreign investors. In the following part we
provide an outlook of the economic environment of the Singapore‟s Miracle, and then we
will return to explore the importance of each of these three gross causes.
7.1SINGAPORE’S ECONOMIC CONTEXT.
Along its prosperity process (See Figure 1 in Appendix 3 (A3)) Singapore achieved a more than satisfactory level of macroeconomic stability. Inflation always exhibited very low levels, with an average annual change in the CPI of 3.3% between 1961 and 1995, as shown by Figure 2 in A3. This demonstrates that the Monetary Authority of Singapore (MAS) so far succeeded in its main objective: maintaining a low and stable level of inflation. According to Barro (1996) this low level of inflation may have a positive impact on economic growth in the long-run.
During this prosperity and price stability period Singapore also experienced an important
31 Singapore moved its production to activities with higher value-added levels, which implied the more intensive utilization of human and physical capital. As shown in Figure 3 in A3
from the mid 1970‟s the Services sector presented an increasing participation in
Singapore‟s GDP. Moreover, this sector has had the largest participation in the economy, always above the 60% of the total production. In particular, Singapore emerged as an international financial center, due to the government policies toward the attraction of foreign capital, and the general favorable climate for investment. As a result the supply of several financial and business services increased during the last stages of Singapore‟s development at the 1980s.
Capital inflows are at the core of Singapore‟s splendid economic performance and Economic Transformation. The Singapore government was able to attract capital, and to use it for the rapid Economic Transformation and development of the country. As an outcome gross capital formation as GDP percentage rose steadily from 10% at the beginning of the 1960s to a peak level of 50% by the mid 1980s, and after the 1986 crisis it stabilized around 35% (See Figure 4 in A3).
The high level of investment allowed to transform the economic apparatus, providing the possibility to participate in more capital intensive activities with higher value-added. This capital-led industrialization brought Singapore‟s exports to a new level. Singapore‟s exportations evolved from re-exports to exports of oil derivates and then to manufactures of a high technological value and services that embedded a large participation of human capital. According to the World Bank‟s WDI, between 1989 and 1999 High-technology exports as percentage of the total manufactured exports grew steadily from 36% to 60%. As result of this transformation, in addition to the export promotion policy, external balance on goods and services grew continuously from a 20% of the GDP deficit at the mid 1970s to a 20% surplus 20 years later (See Figure 5 in A3). Singapore‟s reliance on foreign trade is evident when total trade as percentage of GDP is explored. According to Heston et al.
32 Finally in relation to population, Singapore experienced a favorable demographic transition, in which relative its WAP increased in relation to the rest of the population, as presented by the dependency index in Figure 7 in A3. Since the mid 1960s, the WAP grew constantly in relation with the rest of the population, causing a fall in the dependency index from 0.85 in 1965 beneath 0.4 at the beginning of the 1990s. This rapid and strong change in
Singapore‟s population structure may have a positive effect on economic growth through two main channels: On the one hand as the dependency index decreases average productivity of the labor input increases (Bloom and Williamson, 1998). On the other hand, during this kind o demographic transition saving rate is expected to grow under the Life-Cycle Hypothesis; Husain (1995) finds empirical evidence that supports the positive impact of the demographic transition on the private saving rate in Singapore. In addition to this
favorable change in the population structure, Singapore‟s development was also fostered by
an improvement in its human capital, according to Barro and Lee (2000) data, by 1960 a 61% of the total population over 25 was unschooled, and by 1995 this percentage was reduced to 14%.
From this review of Singapore‟s macro-indicators we derive the following conclusions about its economic context: i) monetary stability was achieved, in fact inflation has always been quite low; ii) very high levels of capital investment were accomplished, having an
impact on Singapore‟s Economic Transformation and exports‟ composition; iii); trade has a central role for Singapore‟s economy, and a positive external balance was achieved through
the increase in the exports‟ value-added; iv) as in the case of Botswana, Singapore experienced a demographic transition favorable to foster economic growth and a rapid reduction in the percentage of unschooled population.
7.2SINGAPORE’S KEYS FOR THE “MIRACLE”
i. Political Stability