www.medigraphic.org.mx
doi: 10.35366/91806https://dx.doi.org/10.35366/91806
Corresponding author: León Gerardo Aello-Reyes Ecocardiography lab. Hospital Español,
Ejército Nacional Núm. 613, Col. Granada, C.P. 11520, Alcaldía Miguel Hidalgo, Ciudad de México, México. Phone: 52 55 4484 1189 E-mail:
ABSTRACT. Introduction: Atrial and ventricular function are closely related. Right atrial strain is currently being studied for validation. The purpose of our research is to evaluate its behavior in patients with pulmonary hypertension and compare it with healthy adults, with the hypothesis that right atrial strain would be lower
in the first group. Methods: This is an observational, cross-sectional study. Only subjects with secondary pulmonary hypertension were included in the patient group. Subjects underwent systematic echocardiography
with equipment from Philips (Epic 7), acquiring routine 2D images in standard and modified 4 chamber view,
for assessment of right atrial function and estimated pulmonary arterial systolic pressure in both groups. The
respective post-processing analysis software used was QLAB 9 (Cardiac motion quantification (CMQ)). Results: A total of 60 subjects, 30 in each group, were included. The mean age was 78 years in the pulmonary hypertension group (60% male), and 26 years in the healthy subjects (16% males). The mean pulmonary systolic pressure in the patient group was 60 mmHg (p <0.0001). Right atrial mean global longitudinal strain was 17.8% in patient
group vs 44% in the control group, p <0.0001. Conclusions: The longitudinal global strain of the right atrium
is significantly lower in patients with pulmonary hypertension compared against healthy subjects. The reservoir
phase of the atrial cycle had the biggest difference in deformation between both groups. Keywords: Right atrial strain, pulmonary hypertension, right ventricular function.
RESUMEN. Introducción: La función auricular y ventricular están estrechamente relacionadas. El strain de la aurícula derecha se está estudiando actualmente para su validación. El objetivo de nuestra investigación es evaluar su comportamiento en pacientes con hipertensión pulmonar y compararlo con adultos sanos; basados en la hipótesis de que el strain auricular derecho sería menor en el primer grupo. Métodos: Este es un estudio observacional de corte transversal. Sólo sujetos con hipertensión pulmonar secundaria se incluyeron en el grupo de pacientes el strain auricular derecho. Éstos fueron sometidos a una ecocardiografía sistemática con
equipo Philips (Epic 7), adquiriendo imágenes 2D de rutina en una vista estándar y modificada de 4 cámaras,
para evaluar la función auricular derecha y la presión sistólica arterial pulmonar estimada en ambos grupos. El
programa de análisis de procesamiento posterior respectivo utilizado fue QLAB 9 (cuantificación de movimiento
cardiaco [CMQ]). Resultados: Se incluyeron 60 sujetos, 30 en cada grupo. La edad media fue de 78 años en el grupo de hipertensión pulmonar (60% hombres) y 26 años en los sujetos sanos (16% hombres). La presión sistólica pulmonar media en el grupo de pacientes fue de 60 mmHg (p <0.0001). El strain longitudinal global
medio de la aurícula derecha fue de 17.8% en el grupo de pacientes frente a 44% en el grupo de control, p
<0.0001. Conclusiones: La tensión global longitudinal de la aurícula derecha es significativamente menor en pacientes con hipertensión pulmonar, en comparación con sujetos sanos. La fase de reservorio del ciclo auricular tuvo la mayor diferencia en la deformación entre ambos grupos.
Palabras clave:Strain auricular derecha, hipertensión pulmonar, función ventricular derecha.
* Ecocardiography Lab. Hospital Español. Mexico City. Mexico.
Comparison of longitudinal right atrial strain in
pulmonary hypertension and normal subjects
Comparación del
strain
longitudinal de auricular derecha
en hipertensión pulmonar y sujetos normales
Jesús Eduardo Sánchez-Hernández,* Jenniffer Ann Swain-Saint Martin,* José Ángel Larraya-Indaberea,* Eduardo Viveros-Rentería,* Eduardo Adrián Maroto-Carrera,* Ernesto Daniel Lozano-Sabido,*
www.medigraphic.org.mx
INTRODUCTIONPulmonary hypertension causes hemodynamic alterations that directly affect right cardiac cavities, leading to remodeling and ventricular dysfunction, as well as atrial dilation. Increase in the afterload is the main culprit in right ventricular dilation, and the subsequent dilation of the tricuspid annulus causes regurgitation of the valve and volume overload. If the pulmonary pressure remains elevated, structural changes begin to appear in the right atrium, modifying the atrial physiology, mainly in the reservoir phase, which contributes to a lower right ventricular output.1-3
Even though the right atrial strain is not standardized yet, this measurement can be useful in patients with pulmonary hypertension. Ongoing studies are designed to establish the cut-off points, as it happened with the left atrium. The normal values for the left atrial strain through the atrial cycle are described in a recent review.4
The atrium functions as a reservoir of blood and increases ventricular filling at the end of diastole. The left atrium size has been shown to be a predictor of cardiovascular events and death, as well as hospitalizations due to heart failure and it’s closely related with severity of diastolic dysfunction. There are 3 atrial cycle phases described, of which, the reservoir phase (also called expansion phase) is the most important one, as it defines the end-diastolic volume. If this phase is impaired, so
is the ventricular performance, decreasing the systolic volume and an optimal atrio-ventricular gradient.
Research on atrial deformation has been possible with the development of new echocardiographic techniques, using a modified left ventricle software. Although it is technically difficult to obtain an appropriate two-dimensional image of right atrium, the study of the deformation is viable.
The phases of atrial cycleare classified into passive phases which include the reservoir and conduit phase; and an active phase, the atrial contraction.5 Each phase contributes to the right ventricular end-diastolic volumes in different percentage: reservoir phase 40%, conduit phase 35% and atrial contraction 25%. The emptying of the atria in the active phase relies on multiple variables, such as: preload, heart rate, contractility, compliance and the right ventricular function.6 During the study of right atrium physiology, the greatest positive deformation will be observed in reservoir phase and maximum negative deformation during contractile phase. The peak atrial deformation, equal to the peak of positive deflection which occurs in the reservoir phase (ventricular contraction, maximum atrial filling), is the most used variable to measure ventricular performance and depends on 3 conditions: ventricular contraction, atrial volume and atrial distensibility.
The chronic volume and pressure overload of the right ventricle are related to changes in
Figure 1:
www.medigraphic.org.mx
right atrial size and contraction. The conduit phase can be impaired due to increased afterload, myocardial hypertrophy, delayed relaxation, decreased diastolic function and weak right ventricle suction. These reduced reservoir volumes caused by a decrease in early diastolic emptying of right atrium may result in an increased volume at the start of right atrial systole.
The average cutoff point for global longitudinal strain of the right atrium (RA) should be >38%3 and its value has been linked with an improved five-year survival in patients with pulmonary hypertension, as well as improvement in the functional capacity, with an 86.8% sensitivity and 84% specificity. An atrial strain <25% is associated with increased mortality, according to a study with 151 patients with precapillary pulmonary hypertension.7
Another study in 60 patients with pulmonary hypertension compared against 30 healthy volunteers further proves that the reservoir function of the RA is significantly impaired.3 An increase in pulmonary vascular resistance, dilation of the right ventricle and levels of NT-proBNP significantly correlated with poor functional class. According to the results, a strain value <38.4% predicted accurately WHO-function class >III, with a 97% sensitivity and 75% specificity.
In idiopathic pulmonary hypertension the correlation between the severity of pulmonary hypertension and deterioration of atrial function has been described, showing the deterioration of the reservoir phase as an independent predictor.8 There is clinical correlation between worse functional capacity and atrial strain in patients with pulmonary hypertension, mainly driven by variations in the
Figure 2:
This is the graph of the atrial cycle with its 3 phases: reservoir, conduit and contractile. The dotted line represents the average of the longitudinal global deformation in each phase.
Deform. long (%)
83
70
57
44
31
18
5
-8
0.02 0.15 0.28 0.41 0.54 0.67 0.80 0.93
Table 1: Baseline characteristics.
Variable Patients (n=30) Controls (n=30) p
Age* 78.00 (65 to 95) 26.0 (22 to 34) <0.0001
Male Sex** 18.00 (60%) 5.0 (16.6%) 0.006
Weight (kg)+ 70.96 (15.6) 71.4 (12.7) 0.8922 Size (cm)+ 163.80 (10.6) 172.0 (8.5) 0.0012
www.medigraphic.org.mx
reservoir phase.9 The role of right atrial strain as a predictor of hemodynamic parameters has also been described in patients with pulmonary hypertension with a significant correlation with the cardiac index, functional class and BNP, demonstrating that atrial function is affected prior to structural changes.10
The evaluation of atrial function through 2D echocardiography is a very useful tool due to the clinical implications that lead to atrial dysfunction.5 Other applications for the measurement of atrial strain have been described.11 Studies in specific populations, as in pulmonary hypertension, are essential to fully understand the behaviour of the atrial deformation.
METHODS
The present study was approved by the ethics committee of the Hospital Español de México, the same institution where it was carried out. The echocardiography laboratory of this institution provided the equipment for obtaining and processing the echocardiographic
images. This is an observational and cross-sectional study.
The study population included patients with secondary pulmonary hypertension. Sampling was non-probabilistic and for convenience. A sample was calculated based on the evaluation study of right atrial function in patients with pulmonary hypertension.5 Thirty patients with pulmonary hypertension were included, and 30 healthy subjects as a control group.
The definition for pulmonary hypertension used in this research was based on the 2015 European Guidelines, classifying the probability risk of PH as low, intermediate and high according to echocardiographic measurements.1 We excluded patients with group 1 pulmonary hypertension.
Acquisition of images, technique and processing of deformation
The echocardiogram machine used for the acquisition of the images and processing of the right atrial deformation was the Phillips EPIC 7 model. We obtained video sequences of 2D
Table 2: Echocardiographic variables and right ventricular function evaluation.
Variables Patients (n=30) Controls (n=30) p
RAP (mmHg)+ 7.2 (5.1) 3 <0.001
PSP (mmHg)* 60.6 (15.2) 21.0 (14 to 30) <0.001 MV RT (m/s)+ 3.6 (0.4) 2.1 (0.15) <0.001 PAT (m/s)+ 96.9 (29.8) 129.0 (19.5) <0.001
TAPSE (mm)+ 20.3 (5.1) 22.1 (3.6) 0.1096
S’ Tricuspid ring (cm/s)* 11.4 (2.9) 12.0 (10 to 14.2) 0.4595
FAC (%)* 36.7 (16 to 60) 48.9 (6.5) 0.0024
DDRV (cm)+ 20.7 (6.3) 16.3 (3.1) 0.0011
SDRV (cm)+ 13.1 (5.5) 8.5 (2.5) 0.0002
RA area (cm2)* 19.9 (12.4 to 40.8) 14.4 (2.0) 0.0000
RAP = Right atrial pressure, PSP = Pulmonary systolic pressure, MV RT = Maximum speed of tricuspid regurgitation, PAT = Pulmonary acceleration time, TAPSE = Time and excursion of the tricuspid ring in systole. S’ tricuspid ring = Tissue movement of the tricuspid ring in systole, FAC = Fractional area change (SARV-DARV/SARV), DDRV = Diastolic diameter of the right ventricle, SDRV = Systolic diameter of the right ventricle, RA = Right atrium, GLS = Global longitudinal strain. p <0.05
represents significant difference. Most of the variables have a significant difference except TAPSE, S’ tricuspid ring and
fractional change of area of the right ventricle. *U Mann Whitney test statistic.
www.medigraphic.org.mx
images of 4-chamber apical view, 4-chamber modified apical view and 4-chamber apical view focused to the right ventricle; each one recorded in a 3-beat sequence. The volume and right atrial area were calculated in the end diastole. Finally, through CMQ software, the right atrial strain was processed, delimiting its shape, placing the reference points on the atrial roof and on both sides of the tricuspid ring (septum and lateral wall). The atrium is divided into 6 segments (3 septal and 3 lateral), gathering deformation values on each one and calculating an average (Figures
1 and 2). Using the strain software, the
results will be shown in a graph by segments, by phase of the atrial cycle and an average of longitudinal deformation. To obtain the image, the patient in positioned in a lateral position with the right side up; using the grayscale and second harmonics for an adequate two-dimensional image, including the atrial roof, which will be the 3rd point to mark manually for the measurement. Two types of waves will be defined, one positive (reservoir phase) and one negative (contractile phase). Finally, the software performs an average of all the segments, which we call longitudinal global deformation, automatically generating a deformation curve.5 At the end the final results will be saved in graphics and deformation maps. In addition, we routinely measured the parameters of right ventricular
function including right atrial strain in all patients. The parameters were obtained in real time or were processed later only by the main investigator.
Statistical analyses
The qualitative variables will be summarized in frequency and percentage. The numerical variables will be summarized as mean with standard deviation and median with minimums and maximums, depending on the distribution. The distribution analysis will be done with a bias evaluation, kurtosis and Kolmogorov-Smirnoff test. Hypothesis testing will be performed by mean or median difference of the deformation parameters of the right atrium to compare the study group with the controls (healthy subjects). A two tails p value <0.05 is considered as significant. Student’s T for normal distribution, Mann-Whitney U for non-parametric and differences of proportions for the percentages were use. All the analyzes will be carried out in the statistical package STATA 14.0
RESULTS
Between April 2018 and January 2019, a total of 60 individuals, 30 patients with pulmonary hypertension and 30 healthy subjects were included. Of which 18 (60%) and 6 (16.6%)
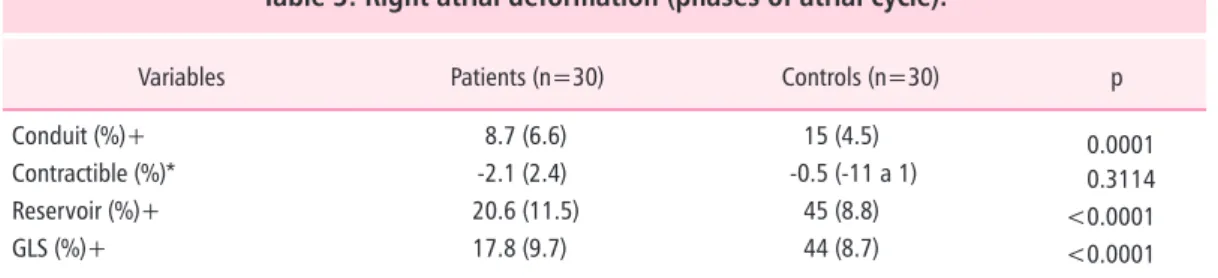
Table 3: Right atrial deformation (phases of atrial cycle).
Variables Patients (n=30) Controls (n=30) p
Conduit (%)+ 8.7 (6.6) 15 (4.5) 0.0001
Contractible (%)* -2.1 (2.4) -0.5 (-11 a 1) 0.3114 Reservoir (%)+ 20.6 (11.5) 45 (8.8) <0.0001
GLS (%)+ 17.8 (9.7) 44 (8.7) <0.0001
Phases of atrial cycle: conduit, contractible and reservoir.
GLS = Global longitudinal strain. P <0.05 represents significant difference.
p <0.05 versus controls group represents significant difference in two phases of atrial cycle and global longitudinal
strain.
*U Mann Whitney test statistic.
www.medigraphic.org.mx
were men, respectively. The mean age was 78 years in the study group (65 to 95 years) and 26 years in the control group (22 to 34 years) (Table 1). The mean pulmonary systolic pressure in the study group was 60.6 mmHg (p <0.0001) (Table 2). The RA mean of the global longitudinal deformation (SLG) in the study group was 17.8 vs 44% in the healthy subjects (p <0.0001). The deformation in the reservoir phase of study group was 20.6 vs 45% in the control group (p <0.005). The most impaired phases of the atrial cycle were the conduit and reservoir phase with statistical significance between both groups (Table 3).
The majority of the right ventricular function variables had statistical significance. However, the measurements of the TAPSE, the tricuspid S’ and the fractional area change were not modified between both groups.
DISCUSSION
The study showed that a significant difference in the longitudinal deformation of the atrium in patients with pulmonary hypertension compared with healthy subjects, which shows that the behavior of this parameter is modified in this specific population. The knowledge of the deformation in this group of patients is useful, however the limitations of an observational study are clear. The study compared patients with healthy subjects, which had a right atrial strain similar to the values described in the literature, with a mean deformation of 44%.8,9 The group of pulmonary hypertension underwent modifications in all stages of the atrial cycle predominating in the reservoir phase, very similar to that compared with the literature.3,8,9
Limitations of our study also included a reduced sample size, interoperator variability in estimating the pulmonary pressure, heterogeneity in etiology across patients with pulmonary hypertension, differences in population regarding sex, age and severity of the disease.
The present study aimed to compare the longitudinal deformation of the right atrium in patients with pulmonary hypertension with healthy subjects reporting right atrial deformation values similar to those reported in the literature, however, in the group of patients
with pulmonary hypertension the variability was remarkable. We still do not know if the measurement of the deformation in this group of patients should be included in the evaluation of right heart function.
CONCLUSIONS
The longitudinal global deformation of the right atrium is significantly lower in patients with pulmonary hypertension, compared to healthy subjects. Patients with pulmonary hypertension had greater alteration in the reservoir phase of the atrial cycle.
ACKNOWLEDGMENTS
The authors want to thank the echocardiography laboratory of the Hospital Español that provided the equipment and the facilities to carry out the present study. Likewise, to the cardiologists of the echocardiography team who cooperated actively in the recruitment of patients.
REFERENCES
1. Galiè N, Humbert M, Vachiery JL, et al. Guía ESC/ ERS 2015 sobre diagnóstico y tratamiento de la hipertensión pulmonar. Rev Esp Cardiol. 2016; 69 (2): 177.e1-177.e62.
2. Rudski LG, Lai WW, Afilalo J, et al. Guidelines for the echocardiographic assessment of the right heart in adults: a report from the American Society of Echocardiography. Endorsed by the European Association of Echocardiography, a registered branch of the European Society of Cardiology, and the Canadian Society of Echocardiography. J Am Soc Echocardiogr. 2010; 23 (7): 685-713.
3. Meng X, Li Y, Li H, et al. Right atrial function in patients with pulmonary hypertension: A study with two-dimensional speckle-tracking echocardiography. Int J Cardiol. 2018; 255: 200-205.
4. Pathan F, D’Elia N, Nolan M, et al. Normal ranges of left atrial strain by speckle tracking echocardiography: a systematic review and meta-analysis of 1,789 healthy subjects. J Am Coll Cardiol. 2016; 67 (13): 1582. 5. Sakata K, Uesugi Y, Isaka A, et al. Evaluation of right
atrial function using right atrial speckle tracking analysis in patients with pulmonary artery hypertension. J Echocardiogr. 2016; 14 (1): 30-38.
6. Mendes L, Cardim N. Right atrial function with speckle tracking echocardiography: Do we really need it? Rev Port Cardiol. 2017; 36 (12): 901-904.
www.medigraphic.org.mx
8. D’Alto M, D’Andrea A, Di Salvo G, et al. Right atrial function and prognosis in idiopathic pulmonary arterial hypertension. Int J Cardiol. 2017; 248: 320-325. 9. Liu W, Wang Y, Zhou J, et al. The Association of
Functional Capacity with right atrial deformation in patients with pulmonary arterial hypertension: a study with two-dimensional speckle tracking. Heart Lung Circ. 2018; 27 (3): 350-358.
10. Piccinino C, Giubertoni A, Zanaboni J, et al. Incremental value of right atrial strain for early
diagnosis of hemodynamic deterioration in pulmonary hypertension: a new noninvasive tool for a more comprehensive diagnostic paradigma. J Cardiovasc Med (Hagerstown). 2017; 18 (11): 866-874.