Cocktail party processing based on interaural parameters
PACS: 43.72.Ew
Hohmann, Volker; Nix, Johannes; Grimm, Giso; Wittkop, Thomas Universität Oldenburg, Medizinische Physik
Postfach 2503 D-26111 Oldenburg Germany
Tel: +49 441 798 5468 Fax: +49 441 798 3201
Email: vh@medi.physik.uni-oldenburg.de
ABSTRACT
Noise reduction algorithms have been proposed which imitate aspects of the binaural processing in the hearing system. Based on a two-channel input, it is theoretically possible to cancel one interfering directional noise source at a time and to cancel reverberation based on coherence measures. In practice, however, no significant increase in speech intelligibility was found in complex environments (diffuse noise, reverberation). Therefore, a localization algorithm is introduced, which uses a statistical description of the binaural signal differences in order to increase the robustness of sound localization in noisy environments. Possible noise reduction schemes based on this localization algorithm are discussed.
INTRODUCTION
Two general types of algorithms for binaural noise reduction can be identified:
Quasi-stationary spatial filtering (e.g. blind source separation (BSS, [1,2]) and adaptive beamforming [3,4,5]).
Time-variant envelope filtering (e.g., Wiener filtering [6] and directional filtering [7]).
‘Quasi-stationary’ means in this case that the filter characteristics do not change with the dynamics of speech, but with the slower changes in the spatial configuration of the sound sources. In conjunction with minor filter constraints, this property guarantees an almost artifact-free output signal. However, complex transfer functions with rather long impulse responses have to be applied for spatial filtering in order to achieve satisfactory source separation. Because the adaptation process is generally unconstrained and relies on statistical properties of the signal (e.g., higher order statistics [8]), the filter adaptation time is long compared to possible changes in the spatial environment. Furthermore, only two sound sources can be separated by using a binaural input. Thus, the filter effect is limited for multi-talker configurations and target suppression often occurs in these configurations due to filter convergence errors.
estimated envelope in order to reconstruct the target’s envelope and thereby suppress the other sources. When defining source separation based on the envelope rather than the complete fine structure of the signals, binaural envelope filtering is not limited to suppressing one noise source only. In multi-talker configurations including reverberation, however, the SNR estimator shows significant errors. Envelope filtering is therefore prone to generate disturbing artifacts due to the limited information on the true target envelope.
In the following, one example of an envelope filtering algorithm [9] is briefly examined, which shows the above mentioned limited effect in complex source configurations. Then, methods are developed that should allow in principle for a combination of spatial and envelope filtering in order to avoid the respective problems outlined above.
DIRECTIONAL FILTERING AND DEREVERBERATION
[image:2.595.85.340.239.649.2]The algorithm [9] considers the two source configurations depicted in Fig. 1: A. nearly frontal target signal perturbed by diffuse noise (left panel) or by a lateral interfering signal (right panel). In order to reduce diffuse noise, the algorithm [9] measures the coherence between left and right channels in 21 frequency bands (log. scaled) and filters the envelope in each band such that signal segments with low coherence are attenuated (dereverberation). In order to reduce lateral noise sources, the time-varying interaural level and phase differences are compared to reference values for the frontal target. Signal segments with interaural differences close to the reference are identified as target and segments with deviating differences are identified as noise. The latter are attenuated, whereas the former pass the filter unchanged (directional filtering). Attack and release time constants are about 20-40 ms, respectively, allowing for filtering the envelope at the syllable rate. Due to errors in estimating the target envelope from the interaural parameters, directional filtering was found to generate artifacts especially in diffuse noise conditions or multi-talker configurations. Therefore, a coherence measure is used in [9] to identify the acoustical situation and to gradually switch off the directional filtering with increasing complexity (selective algorithm). Fig. 2 shows results from speech intelligibility measurements with 8 hearing impaired subjects. The SRT (speech reception threshold, SNR at which 50% sentence intelligibility is reached) was measured unaided, with linear hearing loss compensation (linear), with dereverberation and directional filtering (linear fixed) and with dereverberation and gradual switching of the directional filtering (linear selective).
Fig. 1: Source configurations considered by [9].
[image:2.595.89.500.242.764.2]Configurations were a frontal target signal in lateral unmodulated noise (left group of bars), in lateral speech (mixture of 4 talkers, middle group of bars) and in diffuse noise (right group of bars), respectively. Fixed directional filtering decreases intelligibility, whereas a small but not significant improvement is shown for the selective algorithm in the diffuse noise condition. Subjective preference data (not shown here) reveal an advantage of the binaural noise suppression (selective filtering) compared to linear filtering. It can be concluded that binaural filtering, especially dereverberation, might help by reducing the listening effort in noisy environments, but intelligibility improvement is still lacking.
NOTION OF‘DISJOINT ORTHOGONALITY’
Jourjine et al. [10] propose a method for signal separation based on the assumption that the signals are ‘disjoint orthogonal’, which means that target and noise do not overlap in a suitable signal space (e.g., the spectrotemporal domain for acoustical signals). In this case, unmixing two signals just means to identify the subset within the space that belongs to the target and reconstruct the target from this subset only. The directional filter (cf. section above) can be described in this way: The identification of the target FFT bins is based on whether the interaural parameters fit with the reference or not.
However, it is unclear to what extent disjoint orthogonality is met in real acoustical signals. In this section, we therefore introduce an empirical method to quantify the overlap between target and noise signals. We define the global disjoint orthogonality measure cdjo by
( )
( )
1 2
( , )
,
,
djo
s t f =
X t f X t f
×
( )
( )
(
2 2)
1 2
( , )
1
,
,
2
t f
p
=X t f
+
X t f
( )
( )
,,
,
,
djo t f djo
t f
s t f
c
p t f
=
å
å
, [image:3.595.86.353.210.417.2]where X1(t,f) and X2(t,f) denote the spectrogram (FFT-length 512, Hanning window, overlap 0.5) of target x1(t) and noise x2(t) signals, respectively. t and f denote time and frequency index, respectively. For complete disjoint orthogonal signals, cdjo would be zero due to the multiplication of the spectrograms, for identical target and noise it would be one. Fig. 3 shows the cdjo values for combinations of different target speech signals (‘sp’, one talker, recorded in a living room) with other speech signals (‘sp’), artificial noise signals (‘art’) and signals from realistic noise environments (e.g., car radio, cafeteria) at 0 dB SNR (binaural recordings using close-ear microphones). It can be seen that the overlap varies significantly across conditions. Although high values occur in most cases, low values are found for some combinations of two
[image:3.595.85.506.233.662.2]Fig. 3: Global disjoint orthogonality values cdjo for several combinations of speech and noise signals (see text).
talkers as well as for specific noise environments (e.g., drill noise). In order to assess the effect of overlapping signals (high cdjo values) on parameters used for signal separation, Fig. 4 shows
cdjo-specific histograms of the interaural time difference (ITD) for low frequencies up to 1 kHz for a two talker situation (0° and 60° azimuth, respectively). For cdjo values higher than the empirically found value of 0.25, the ITD does not allow for a signal separation due to smeared ITD values, whereas the ITD nicely separates the different sound incidence directions for lower values (cf. Fig. 4). Because most signal combinations exhibit cdjo values larger than 0.25, it can be concluded that interaural parameters localized in frequency and time do not provide sufficient information for signal separation without temporal and/or spectral integration of the directional information in most realistic listening conditions. Thus, the drawbacks of envelope filtering using interaural parameters found by Wittkop can be explained and assessed by using the cdjo measure.
BINAURAL SNR ESTIMATION USING INTERAURAL TIME DIFFERENCES (ITD)
It has been shown in the last section that signal separation using envelope filtering based on interaural parameters should be in principle possible for the cases where the overlap of target signal and noise in the spectro-temporal domain is limited. In this section, the accuracy of a short-time SNR estimation based on the ITD for 3 frequency bands in the range of 200-600 Hz is exemplarily assessed. The SNR is estimated as follows: The ITD is calculated from the spectrograms Xl(t,f) and Xr(t,f) of the left and right channels of the target-noise mixture by taking the interaural phase difference divided by the bin frequency (FFT length 512, overlap 0.5). For each time and frequency index, the probability dtarg for the presence for a frontal sound source is calculated from the ITD (Bayes estimation using the ITD distributions of a frontal source (cf. Fig. 4) and of a diffuse cafeteria noise). The SNR in each FFT bin is then estimated by
( )
( )
( )
arg 10
arg
,
10 log
,
1
t t,
f t
LP
d
f t
SNR
d
f t
=
ç
æ
ç
ç
ç
×
ç
ç -
ç
ç
ç
æ
÷
÷
÷
÷
ö÷
÷
÷÷
÷
÷
÷
÷
ö
ç
è
ø
è
ø
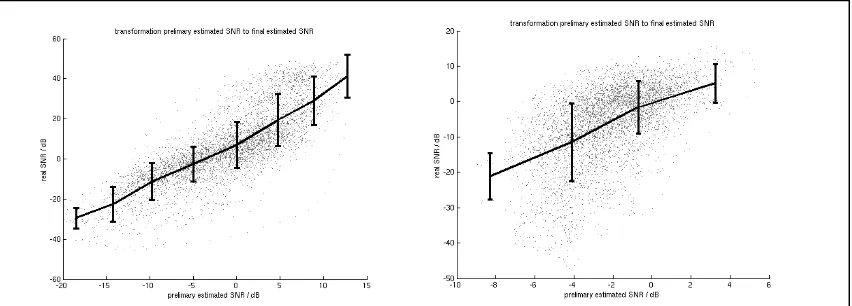
,where LP denotes lowpass filtering (Butterworth 2. order, 4 Hz cut-off frequency). SNR values are then averaged across three frequency bands (cf. Tab. 1 for the edge frequencies). Fig. 5 shows the true vs. the estimated SNR for a two-talker mixture (SNR=3dB, left panel) and a mixture of a target talker and a diffuse cafeteria noise (SNR=3dB, right panel) calculated from 20s signals and cumulated across the three frequency bands. The solid lines with errorbars indicate mean values and standard deviations. As expected, the accuracy of the estimate is quite good for the two-talker situation, whereas the estimator fails for the cafeteria condition.
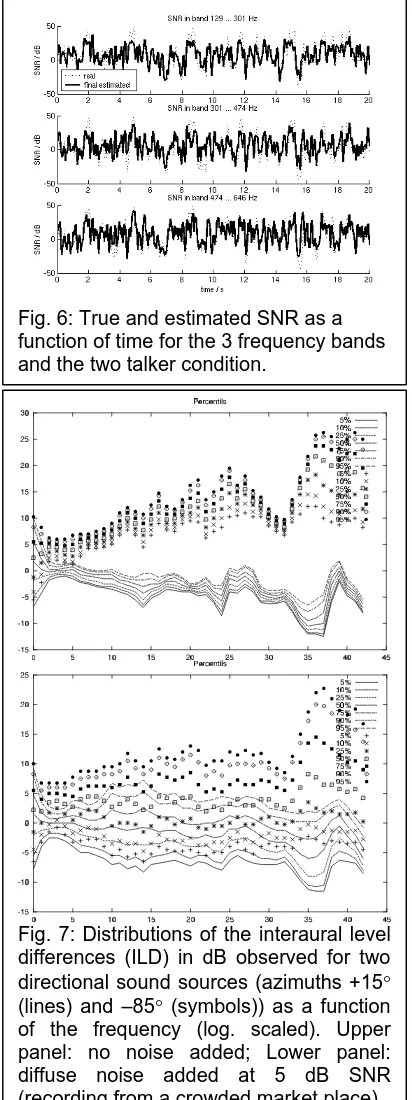
[image:4.595.88.514.535.688.2]The estimated SNR exhibits a smaller range than the true SNR. It is therefore transformed across the solid line (average values) in order to better match the true SNR (‘final estimate’). Fig. 6 shows the final SNR estimate and the true SNR as a time course for the 3 frequency
bands and the two talker condition. Generally, a good correspondence between estimated and true SNR is observed. Table 1 gives the correlation coefficients for the three bands for the two talker and the cafeteria condition. The values are much lower for the cafeteria condition, as expected, indicating that envelope filtering using the SNR estimate would fail to reduce the noise and would lead to a distorted target speech signal.
STATISTICAL LOCALIZATION MODEL
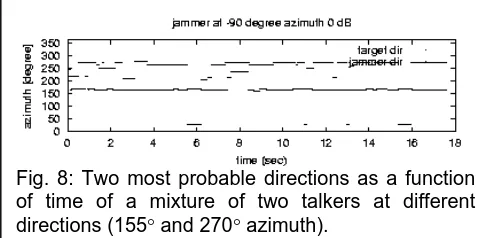
Binaural noise reduction mainly exploits the directional selectivity of short-time interaural parameters, i.e., the dependence of interaural level and time differences (ILD, ITD) on the source direction, as outlined in the last section for the ITD. The influence of non disjoint orthogonal mixtures of a directional signal and a perturbing noise on the statistics of the ILD is exemplarily sketched in Fig. 7. ILD-distributions for different directions broaden and overlap significantly when perturbed by diffuse noise at low SNR. Thus, the source direction cannot be estimated reliably from short-time ILD-observations within a frequency band. However, robust short-time localization performance could be achieved by frequency integration of the ILD-information, as can be seen in Fig. 7. Nix and Hohmann [11] used a Bayesian approach for this. Frequency-specific a-posteriori probabilities for each direction were calculated from short-time ILD and ITD-observations and their respective empirically measured distributions. Probability values for each direction and time instance were then found by multiplying the frequency-specific probabilities and subsequent temporal integration with a time window of about 300 ms. Fig. 8 shows the track of the two most probable directions as a function of time for a mixture of two talkers at 0 dB SNR (20° and 155° azimuth, respectively). Good localization accuracy and source tracking is achieved. Furthermore, good correlation between the envelope and the short-time probabilities is reported [11].
CONCLUSIONS
[image:5.595.301.507.136.686.2]Based on the analysis presented above, we propose to take the three most probable directions calculated from the statistical localization model as a-priori information for constrained
Fig. 7: Distributions of the interaural level differences (ILD) in dB observed for two directional sound sources (azimuths +15° (lines) and –85° (symbols)) as a function of the frequency (log. scaled). Upper panel: no noise added; Lower panel: diffuse noise added at 5 dB SNR (recording from a crowded market place). Fig. 6: True and estimated SNR as a function of time for the 3 frequency bands and the two talker condition.
Frequency range Cafeteria Two talker
129-301 Hz 0.47 0.83
301-474 Hz 0.58 0.76
474-646 Hz 0.63 0.81
[image:5.595.89.291.137.256.2]optimization of a ‘bank’ of three spatial filters, which each cancel one of the most probable jammer signals, respectively. The short-time direction probabilities should then be used to switch between the spatial filters in order to cancel the jammer with the highest activity within a time frame, respectively. This approach forms a combination between spatial and envelope filtering. The disadvantages of unconstrained optimization of spatial filters are avoided. Furthermore, the artifacts of envelope processing are reduced, as this information is only used to switch between spatial filters, each of which preserves the target well. Interestingly, Peissig and Kollmeier [12] reported results from speech intelligibility measurements in spatial configurations with one target and two or three spatially separated noise sources, which are compatible with the findings from this paper. It was found that humans can separate not more than two spatially separated sound sources, i.e., only one noise source can be suppressed at a time. Two noise sources can only be suppressed in case the signals are modulated, i.e., the subjects seem to switch between two spatial filters depending on the activity of the sources. A similar behaviour would be expected from the combination of spatial filtering and envelope filtering outlined in this section.
REFERENCES
[1] J. Anemüller and B. Kollmeier, “Amplitude modulation decorrelation for convolutive blind source separation,” In: P. Pajunen und J. Karhunen (Eds.), Proc. of the second int. workshop on independent component analysis and blind signal separation, June 19-22, 2000, Helsinki, Finland, pp. 215-220, http://medi.uni-oldenburg.de/members/ane/pub/index.html.
[2] L. Parra, C. Spence and B.D. Vries, “Convolutive blind source separation based on multiple decorrelation,” In: IEEE Neural Networls and Signal Processing Workshop, Cambridge, UK, 1998.
[3] J.E. Greenberg and P.M. Zurek, “Evaluation of an adaptive beamforming method for hearing aids,” J Acoust Soc Am. 91(3):1662-76, 1992.
[4] M. Kompis and N. Dillier, “Noise reduction for hearing aids: combining directional microphones with an adaptive beamformer,” J Acoust Soc Am. 96(3):1910-13, 1994.
[5] J.M. Kates and M.R. Weiss, “A comparison of hearing-aid array processing techniques,” J Acoust Soc Am. 99(5):3138-48, 1996.
[6] H. Levitt, M. Bakke, J.M. Kates, A. Neuman, T. Schwander and M. Weiss, “Signal processing for hearing impairment,” Scand Audiol Suppl. 38:7-19, 1993.
[7] T. Wittkop, S. Albani, V. Hohmann, J. Peissig, W.S. Woods and B. and Kollmeier, “Speech processing for hearing aids: Noise reduction motivated by models of binaural interaction,” Acustica/acta acustica, 83:684-699, 1997.
[8] T.W. Lee, A.J. Bell and R.H. Lambert, “Blind separation of delayed and convolved sources,” In: T.P.M. Mozer, M. Jordan (eds.) Advances in neural information processing systems, 9:758-764, MIT prass, Cambridge, MA, 1997.
[9] T. Wittkop, “Two-channel noise reduction algorithms motivated by models of binaural interaction,” Ph.D. thesis Universitat Oldenburg 2001, http://docserver.bis.uni-oldenburg. de/publikationen/dissertation/2001/wittwo01/wittwo01.html.
[10] A. Jourjine, S. Rickard, and O. Yilmaz, “Blind Separation of Disjoint Orthogonal Signals: Demixing N Sources from 2 Mixtures,“ In: Proc. ICASSP 2000, 5:2985-2988, Istanbul, Turkey, 2000.
[11] J. Nix and V. Hohmann, “Enhancing sound sources by use of binaural spatial cues,” In: Proc. CRAC, Eurospeech 2001, Aalborg, Denmark, 2001,
http://www.ee.columbia.edu/crac/papers/nix.pdf.
[12] J. Peissig. and B. Kollmeier, "Directivity of binaural noise reduction in spatial multiple noise-source arrangements for normal and impaired listeners," J. Acoust. Soc. Am., 101:1660-1670, 1997.
work supported by BMBF 01EZ0017 -Fig. 8: Two most probable directions as a function
[image:6.595.86.328.73.192.2]![Fig. 1: Source configurations considered by [9].](https://thumb-us.123doks.com/thumbv2/123dok_es/5467006.112383/2.595.85.340.239.649/fig-source-configurations-considered-by.webp)