SUSTAINABLE FOREST MANAGEMENT
RESEARCH INSTITUTE
ASSESSMENT OF BIOMASS AND CARBON DYNAMICS
IN PINE FORESTS OF THE SPANISH CENTRAL RANGE:
A REMOTE SENSING APPROACH
DOCTORAL THESIS
UNIVERSITY OF VALLADOLID
SUSTAINABLE FOREST MANAGEMENT RESEARCH INSTITUTE
ASSESSMENT OF BIOMASS AND CARBON DYNAMICS IN PINE
FORESTS OF THE SPANISH CENTRAL RANGE: A REMOTE
SENSING APPROACH
Doctorate programme on “Conservation and Sustainable
Management of Forest Systems”
The present thesis fulfils the necessary requisites to obtain the International Doctorate Mention through the University of Valladolid
Cristina Gómez Almaraz
TABLE OF CONTENTS
FOREWORD ... 1
ACKNOWLEDGEMENTS ... 2
ABSTRACT ... 3
RESUMEN ... 5
LIST OF ORIGINAL PAPERS... 7
1. INTRODUCTION ... 9
1.1. The global Carbon context ... 9
1.2. Spanish forests role in the Carbon context ... 11
1.3. Reporting on forest resources ... 11
1.4. Land cover and land cover change (LCLCC) ... 12
1.5. Forest structure and forest biomass ... 15
1.6. Methods for measuring forest biomass and carbon content ... 16
1.7. Remote sensing of forest biomass and carbon content ... 17
1.8. Remote sensing opportunities in Spain ... 20
2. AIMS AND OVERVIEW ... 21
2.1. Goal and main objective ... 21
2.2. Thesis structure, specific goals and objectives ... 22
3. DATA AND METHODS ... 25
3.1. Study area ... 25
3.2. Data ... 26
Field inventory data ... 26
National Forest Inventory data ... 27
Management inventory data ... 28
Satellite data ... 28
Landsat program ... 30
QuickBird-2 satellite ... 32
Ancillary data: cartography, aerial photography, digital elevation model ... 33
3.3. Management of data from field inventories ... 34
3.4. Biomass calculation with allometric equations ... 34
3.5. Satellite data processing ... 35
Selection of images... 36
Geometric correction ... 37
Radiometric calibration ... 38
3.6. Vegetation indices ... 39
Normalized Difference Vegetation Index ... 40
Tasseled Cap Transformation and derived indices ... 41
3.7. Image texture ... 42
3.8. Image segmentation for object oriented analysis ... 44
3.9. Spectro-temporal trajectory... 45
3.10. Data analysis techniques for exploration, characterization, and modelling ... 46
Classification and regression trees (CART) ... 46
Canonical correlation analysis ... 47
Geostatistics: kriging interpolation and variogram ... 48
Moran Index for analysis of spatio-temporal correlation ... 49
Wavelet transformations for analysis of remotely sensed data ... 51
Dynamic time warping ... 52
4. RESULTS ... 53
5. DISCUSSION ... 59
5.1. Location, extent, distribution, and change of pine forests ... 62
5.2. Landscape processes and spatio-temporal associations ... 63
5.3. Carbon stocking processes ... 65
5.4. Forest structure and structural diversity ... 67
5.5. Historical biomass modelling, mapping, and dynamics ... 71
CONCLUSIONS... 75
CONCLUSIONES ... 79
REFERENCES ... 83
PUBLICATIONS ... 107
Chapter I.……….………..………...109
Chapter II..……….………...………...…...127
Chapter III………...……….…………...157
Chapter IV.………..………...………..…...…..185
Chapter V………...………...………...203
FOREWORD
According to the Spanish national (R.D. 99/2011, BOE 35/2011) and regional (BOCYL
243/2012) regulations, this doctoral thesis consists of a series of original research
papers. Details for identification of these publications are listed below.
An extended introduction is included in this dissertation for contextualization and linkage
of the original research publications, and to help understanding the relevance of the
findings. A brief description of the main methods provides an overview of the range of
techniques applied, and it is not intended to give exhaustive details of the work done,
which is properly related in specific chapters (publications). Likewise, the compilation of specific objectives, summary of results and discussion, provide just a synthesized
version of the entire work related in the publications.
ACKNOWLEDGEMENTS
This work was in part done under the project: ‘Estructura, dinámica y selvicultura para la
conservación y el uso sostenible de los bosques en el Sistema Central’ (VA-096-A05), with
funding from Consejería de Educación, Junta de Castilla y León, Plan Regional I+D+I. The
Government Related Initiatives Program (GRIP) of the Canadian Space Agency supported
the project: “Ecomonitor: Northern Ecosystem Climate Change Monitoring From Space”
that enabled implementation of part of this research. Landsat images are available online,
provided by the USGS. Field inventory data were kindly provided by Centro de Montes de
Valsaín, Consejería de Medio Ambiente y Ordenación Territorial de Castilla y León, and
Ministerio de Medio Ambiente (España).
ABSTRACT
Forests play a dynamic role in the terrestrial carbon (C) budget, by means of the
biomass stock and C fluxes involved in photosynthesis and respiration. Remote sensing in
combination with data analysis constitute a practical means for evaluation of forest
implications in the carbon cycle, providing spatially explicit estimations of the amount,
quality, and spatio-temporal dynamics of biomass and C stocks. Medium and high spatial
resolution optical data from satellite-borne sensors were employed, supported by field
measures, to investigate the carbon role of Mediterranean pines in the Central Range of
Spain during a 25 year period (1984-2009). The location, extent, and distribution of pine
forests were characterized, and spatial changes occurred in three sub-periods were
evaluated. Capitalizing on temporal series of spectral data from Landsat sensors, novel
techniques for processing and data analysis were developed to identify successional
processes at the landscape level, and to characterize carbon stocking condition locally,
enabling simultaneous characterization of trends and patterns of change. High spatial
resolution data captured by the commercial satellite QuickBird-2 were employed to model
structural attributes at the stand level, and to explore forest structural diversity.
Aboveground biomass (AGB) was calculated retrospectively at specific dates (1990 and
2000) with modelled temporal trajectories of spectral indices, and maps were produced
with 30 m spatial resolution depicting biomass, biomass change, and measures of
uncertainty, from which carbon budgets were calculated.
Results indicate that the area occupied by pines in the Central Range of Spain fluctuated
during period 1984-2009, with a final net increase of 40%. A global activation of carbon
pools was observed, being the area intermittently covered by pines strongly involved in
processes of C exchange, while the permanent pines had a near to neutral net C character.
The temporal character of local carbon fluxes was identified and summarized by date,
showing that in 2000 there was a maximum of 33% of the area in a process of net C
accumulation. A widespread trend to accumulate biomass was confirmed, with 18% of
initial biomass accrued by the pine stable area between 1990 and 2000. On average, these
pines accumulated 0.65 t ha-1 y-1 of carbon in the form of AGB between 1990 and 2000,
equivalent to 2.38 t ha-1 y-1 fixation of CO2.
Remote sensing supports and enhances the value of forest inventories based on sample
plots for assessment of biomass and C budgets, complementing rather than substituting
essential field work. Access to archived historical and contemporary images of high and
consistent quality provides opportunities to develop methods for unveiling information
related to the development of forest ecosystems that would otherwise remain incomplete or
unknown. In addition to international archives of medium spatial resolution images
providing data free of cost, like the US Geological Survey and the European Space
Agency, the Spanish Plan Nacional de Observación del Territorio acquires national
coverage of high spatial resolution imagery annually, that constitutes an opportunity to
support the evaluation of the national forest resources for planning and decision making.
Keywords: aboveground biomass, carbon dynamics, remote sensing, forest structure, structural diversity, spectro-temporal trajectory, successional process, modelling,
Mediterranean pines, Spain.
RESUMEN
Los bosques realizan una función dinámica en el balance de carbono (C) terrestre, a
través de las reservas de biomasa y los flujos de C asociados a la respiración y fotosíntesis.
La teledetección, combinada con técnicas de análisis de datos, constituye un medio
práctico para evaluar el papel de los bosques en el ciclo de carbono, proporcionando
estimaciones de la cantidad, calidad, y evolución de la biomasa y reservas de carbono. El
objetivo de este trabajo fue el desarrollo y aplicación de técnicas para valorar la función de
los pinares del Sistema Central español durante 25 años (1984-2009) en el contexto del
carbono. Para ello se utilizaron datos ópticos de media y alta resolución espacial obtenidos
con sensores remotos, junto con datos de inventario medidos en campo. Se identificó la
localización, extensión, y distribución de los pinares, evaluando los cambios ocurridos en
tres subperiodos. Gracias a las series temporales de datos Landsat se desarrollaron técnicas
novedosas de procesamiento y análisis de datos para identificar procesos de sucesión
forestal a escala de paisaje y para describir el carácter local de los almacenes de carbono,
facilitando la caracterización simultánea de los patrones y las tendencias de cambio.
Utilizando imágenes de alta resolución espacial obtenidas por el satélite QuickBird-2 se
desarrollaron modelos de estructura forestal a escala de rodal y se exploró la diversidad
estructural. Se calculó la biomasa aérea de forma retrospectiva para los años 1990 y 2000,
incorporando trayectorias espectrales como variables dinámicas en los modelos de
estimación. Finalmente se desarrolló cartografía ráster (resolución 30 m) de biomasa aérea
y cambio de biomasa, junto a valores de la incertidumbre asociada. A partir de estos mapas
se calcularon valores totales de acumulación y flujo de carbono.
Los resultados indican que el área ocupada por pinares en el Sistema Central español
fluctuó durante el periodo 1984-2009, con un incremento final neto del 40%. Se observó
una activación generalizada de los almacenes de carbono, estando el área con cobertura
intermitente de pinar fuertemente involucrada en procesos de intercambio de C, mientras el
área con cobertura estable tuvo un comportamiento neto casi neutro. El carácter de los
flujos locales de carbono resumido por fechas demostró que en 2000 más de un tercio de la
superficie considerada estaba acumulando carbono de forma neta. Se confirmó una
tendencia global de acumulación de biomasa: entre 1990 y 2000 el área de pinar
permanente acumuló el equivalente al 18% de su biomasa inicial. Como media, la biomasa
aérea de estos pinares almacenó 0.65 t ha-1 a-1 de carbono entre 1990 y 2000, equivalente a
la fijación de 2.38 t ha-1 a-1 de CO2.
La teledetección complementa y realza el valor de los inventarios forestales basados en el
muestreo de parcelas para la estimación de biomasa forestal y reservas de C. El acceso a
archivos de imágenes históricas y contemporáneas ofrece la oportunidad de utilizar
cuantiosos datos y desarrollar métodos que ayudan a generar información relacionada con
el desarrollo forestal, de otra manera inexistente o incompleta. Además de los archivos de
imágenes de media resolución espacial del US Geological Survey (USGS) y la Agencia
Espacial Europea (ESA), libres de coste económico, la adquisición por parte del Plan
Nacional de Observación del Territorio (PNOT) de una cobertura anual con imágenes de
alta resolución espacial, constituye una oportunidad de respaldar la estimación de los
recursos forestales nacionales para la planificación y los procesos de decisión.
Palabras clave: biomasa forestal aérea, carbono, teledetección, estructura forestal,
diversidad estructural, trayectoria espectro temporal, proceso evolutivo, modelización,
pinares mediterráneos, España.
LIST OF ORIGINAL PAPERS
• Gómez, C., White, J.C., Wulder, M.A. 2011. Characterizing the state and
processes of change in a dynamic forest environment using hierarchical spatio-temporal segmentation. Remote Sensing of Environment, 115 (7), 1665-1679. (DOI: http://dx.doi.org/10.1016/j.rse.2011.02.025)
• Gómez, C., Wulder, M.A., White, J.C., Montes, F., Delgado, J.A. 2012.
Characterizing 25 years of change in the area, distribution, and carbon stock of Mediterranean pines in Central Spain. International Journal of Remote
Sensing. 33 (17), 5546-5573. (DOI:
http://dx.doi.org/10.1080/01431161.2012.663115)
• Gómez, C., Wulder, M.A., Montes, F., Delgado, J.A. 2012. Modeling Forest
Structural Parameters in the Mediterranean Pines of Central Spain using QuickBird-2 Imagery and Classification and Regression Tree Analysis
(CART). Remote Sensing. 4 (1), 135-159. (DOI:
http://dx.doi.org/10.3390/rs4010135)
• Gómez, C., Wulder, M.A., Montes, F., Delgado, J.A. 2011. Forest structural
diversity characterization in Mediterranean pines of Central Spain with QuickBird-2 imagery and canonical correlation analysis. Canadian Journal of Remote Sensing, 37 (6), 628-642. (DOI: http://dx.doi.org/10.5589/m12-005)
• Gómez, C., White, J.C., Wulder, M.A., Alejandro, P. Historical forest biomass
dynamics modelled with Landsat spectral trajectories. ISPRS Journal of Photogrammetry and Remote Sensing (accepted January, 2014)
1. INTRODUCTION
1.1. The global Carbon context
Concern about widespread instability of ecosystems, presumably affected by changes
in atmospheric composition and gas circulation, has increased since the last decades of the
20th century. Common distress has triggered the advance of a large-scale scientific
framework, aiming to understand climate oscillations and to identify the factors involved.
The cyclic flow and the balance of atmospheric gases, carbon dioxide, nitrous oxide,
ozone, and methane, have been recognized of particular relevance.
Forests play an important role in the terrestrial carbon budget (FAO, 2010; IPCC, 2007),
with an estimated annual net carbon uptake equivalent to 26% of the current human fossil
emissions (Pan et al., 2011). As part of the photosynthesis, trees and shrubs absorb carbon
dioxide (CO2) from the atmosphere and fix carbon by accumulation in the form of
biomass. A fraction of the in-taken carbon is outsourced in the continuous respiratory
process, and all can be released in the processes of combustion (Körner et al., 2003) or
decomposition (Krankina and Harmon, 1995). The net balance of respiration and primary
production determines the overall quality of a forest as a carbon sink or carbon source
(Law et al., 1999) and it is intimately related to age and development stage, health
condition, and structural characteristics (Brown, 2002; Goward et al., 2008).
The uptake of CO2 by land sinks is not currently quantified with adequate accuracy
(LeQuéré et al., 2009). Significant uncertainties in carbon (C) budgets exist related to
imprecise estimates of biomass location and biomass change (Houghton, 2005).
Furthermore, for prediction of future carbon scenarios, the gap of knowledge about
prospective efficiency of natural sinks constitutes an important hitch (LeQuéré et al.,
2012). The subsistence of uncertainties in C budgets motivates international collaboration
and establishment of multidisciplinary working programs, which aim to obtain harmonized
assessments of the global C balance. The Global Carbon Project (GCP) was established in
2001 to set up a framework for international coordinated research and observation, aiming
to develop a complete picture of the global C cycle, including biophysical and human
interactions. Additionally, and complementary to the GCP, the Integrated Global Carbon
Observations (IGCO) system coordinates networks of systematic in situ and remote
measurements of C fluxes, pools, and processes. IGCO’s goals are: to provide long-term
observations required to improve understanding of the present state and future performance
of the global C cycle, and to monitor and assess the effectiveness of carbon sequestration
and/or emission reduction activities on global atmospheric CO2 levels, including
attribution of sources and sinks by region and sector. Collaborators of the GCP such as
CarboEurope, the North American Carbon Plan, or the Australian National Carbon
Accounting Project, provide regional contributions with scientific understanding of
sources, sinks, and changes in carbon stocks.
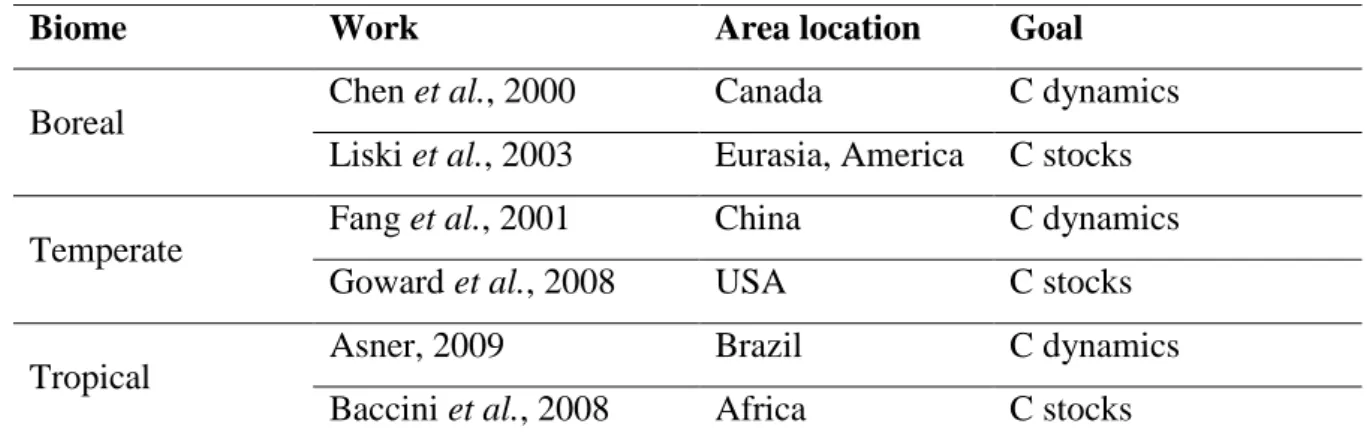
At regional and local scales, knowledge of forest C dynamics is relevant for marketing and
management decisions, and for calibration of larger scale estimations. Modelling and
estimation of forest carbon dynamics at medium scale is in continuous development, with
work done in all terrestrial forested biomes (Table 1). Field data from national forest
inventories constitute a main source of information for regional reports (e.g. Mäkipää et
al., 2008; Liski et al., 2006) and remotely sensed data sources have become irreplaceable
for this purpose (Lu, 2006).
Table 1. Examples of estimation and mapping of C dynamics and stocks at regional scale
in different biomes.
Biome Work Area location Goal
Boreal Chen et al., 2000 Canada C dynamics
Liski et al., 2003 Eurasia, America C stocks
Temperate Fang et al., 2001 China C dynamics
Goward et al., 2008 USA C stocks
Tropical Asner, 2009 Brazil C dynamics
Baccini et al., 2008 Africa C stocks
At the landscape level, the net exchange of carbon in a forest ecosystem is strongly
controlled by the spatial distribution of stand age, structure, and condition (Goward et al.,
2008). Integrating the dynamics of all stands with spatial data reporting on structure, age,
and their distribution is necessary for the assessment of carbon budgets (Song and
Woodcock, 2003). Unfortunately, the general lack of accurate spatial data regarding forest
biomass is one of the most persistent uncertainties concerning C budgets (Harrel et al.,
1995). Intense research is currently ongoing to mitigate this lack of information (e.g.
Powell et al., 2010; Sales et al., 2007).
1.2. Spanish forests role in the Carbon context
The Spanish forests currently cover 18.5 million ha, and perform an annual C uptake
equivalent to 24% of the country fossil emissions (Montero and Serrada, 2013). As
signatory country of the Kyoto Protocol, Spain is committed to provide data to establish
the level of C stocks in 1990 and to enable an estimation of changes in carbon stocks in
subsequent years (UNFCCC, 1997). For the post-Kyoto era, advanced carbon estimation
methodologies are recommended to provide accurate, transparent, and reliable data to
serve as a basis for market tools and international carbon policymaking (Zhang et al.,
2012).
Variations in the Spanish forests C pools in relation to land use change are typically
associated with reforestation of agricultural land. Carbon stocks in stable forest areas are
modified by fire events, harvesting, recruitment, natural growth, and improvement of forest
quality (MMA, 2002). Measurements acquired by the Spanish National Forest Inventory
are currently the main source of data for calculation and evaluation of forest C balances at
national level (MMA, 2002; González-Alonso, 2006) and regionally (e.g. Herrero and
Bravo, 2012).
1.3. Reporting on forest resources
Forest stakeholders are obliged to report locally, nationally, and internationally about
the state and condition of ecosystem resources, in order to meet management requirements
and conservation commitments (Wulder et al., 2008a). The extent and distribution of forest
stands, the biomass content, carbon sources, sinks and balances, species diversity, and
changing dynamics, are typical features requiring characterization (Tomppo et al., 2010).
Sustainable management is based on informed decisions about assets, and requires periodic
evaluation for updating of the coverage, structure, and condition of forests resources
(McDonald and Lane, 2004; Siry et al., 2005).
As regards to conservation, signatory countries of the United Nations Framework
Convention on Climate Change (UNFCCC) are committed to regularly update an
inventory of CO2 and other greenhouse gas emissions using comparable methods
(Houghton et al., 1997). Party countries ratifying the Kyoto Protocol (1997), Spain
amongst them, are required to reduce their 1990 level of human induced carbon emissions,
with an option to trade part of this reduction with the conservation and enhancement of
forestry resources through activities such as afforestation and reforestation (Patenaude et
al., 2005). Forests have therefore to be monitored to account for any gains and losses in
extent, and for changes in structure and condition that might impact carbon accounting.
Additionally, international carbon credit trading schemes are in development, (Gibbs et al.,
2007) and require accurate carbon stock estimation. Other international treaties, like the
Biodiversity Convention or the World Heritage Convention, oblige countries to report
regularly on changes in forest characteristics such as total forest area, woody biomass, or
diversity of tree species (Andersson et al., 2009). Assessment of these changes for
reporting at the national or regional level necessitates reliable and cost effective methods
for spatially explicit monitoring over large areas (Krankina et al., 2004).
1.4. Land cover and land cover change (LCLCC)
Land cover is fundamental information for management of resources at medium to
large scale (Smith, 2008). Identification of land cover type is the first step in any C
assessment program (Andersson et al., 2009). The extent and spatial distribution of forests
are naturally modified by disturbance agents such as fire, windstorm, or flood (Foster et
al., 1998), and also by human-induced activities such as harvesting or plantation (Hannah
et al., 1994). Land cover changes derived from afforestation or deforestation may turn the
character of an area from net carbon source to net carbon sink or vice versa, and therefore
they are significant events in the C budget (Houghton, 1999; Houghton et al., 2012).
To assess changes of land cover at medium and large scale, satellite remotely sensed data
is a long-standing source of information with demonstrated capability (Coppin et al.,
2004). When used synergistically with other sources of data, remote sensing technology is
adequate to evaluate changes in land cover use, as required by the Kyoto Protocol (KP)
(Patenaude et al., 2005). Since only the human induced land cover change episodes report
to the KP, these changes require verification with contemporary data (Rosenqvist et al.,
2003). A host of sensors onboard satellite platforms are well suited for detection of land
cover types, providing consistent and repeatable measurements at an appropriate scale
(Verbesselt et al., 2010). Optical sensors like SPOT VEGETATION and MODIS have
been widely used for this purpose (Homer et al., 2001; Guindon and Edmonds, 2002;
Potapov et al., 2008; Wulder et al., 2008b). The Landsat program has been during decades
the gold-standard for land cover classification (Cohen and Goward, 2004) and change
detection (Wulder et al., 2008c), thanks to a suitable combination of spatial resolution (30
m), revisit period (16 days), and wide spatial coverage (185 km by 185 km). With a long
history of near continuous imagery acquisition of the Earth’s surface starting in 1972
(Leimgruber et al., 2005), Landsat archival imagery is adequate for the establishment of a
1990 baseline as required by the KP, and for monitoring change with calibrated imagery.
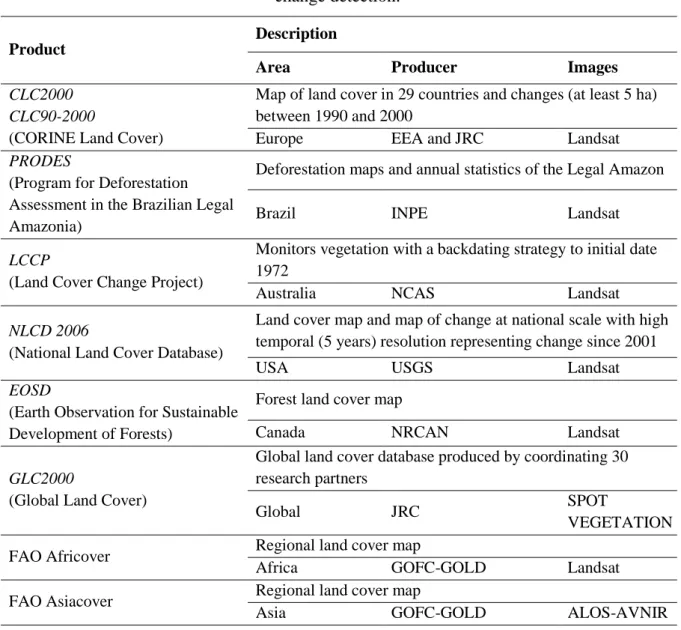
Ongoing operational land cover change detection programs at national level have a main
focus on forest change, and rely on Landsat imagery with support of data from other
programs (Hansen and Loveland, 2012). Table 2 offers an overview of relevant
international programs dedicated to LCLCC detection.
Table 2. Overview of international programs dedicated to land cover and land cover
change detection.
Product
Description
Area Producer Images
CLC2000 CLC90-2000
(CORINE Land Cover)
Map of land cover in 29 countries and changes (at least 5 ha) between 1990 and 2000
Europe EEA and JRC Landsat
PRODES
(Program for Deforestation Assessment in the Brazilian Legal Amazonia)
Deforestation maps and annual statistics of the Legal Amazon
Brazil INPE Landsat
LCCP
(Land Cover Change Project)
Monitors vegetation with a backdating strategy to initial date 1972
Australia NCAS Landsat
NLCD2006
(National Land Cover Database)
Land cover map and map of change at national scale with high temporal (5 years) resolution representing change since 2001
USA USGS Landsat
EOSD
(Earth Observation for Sustainable Development of Forests)
Forest land cover map
Canada NRCAN Landsat
GLC2000
(Global Land Cover)
Global land cover database produced by coordinating 30 research partners
Global JRC SPOT
VEGETATION FAO Africover Regional land cover map
Africa GOFC-GOLD Landsat
FAO Asiacover Regional land cover map
Asia GOFC-GOLD ALOS-AVNIR
Note. CORINE: Coordination of Information on the Environment; EEA: European Environment Agency; JRC: Joint Research Centre; INPE: National Institute for Space Research; NCAS: National Carbon Accounting System; USGS (United States Geological Survey); NRCAN: Natural Resources Canada; SPOT: Satellite Pour l’Observation de la Terre; GOFC-GOLD: Global Observation of Forest and Land Cover Dynamics; ALOS-AVNIR: Advanced Land Observation Satellite-Advanced Visible and Near Infrared
Regional maps produced with independent classification schemes are difficult to compare.
To enable objective international comparison of land cover state and changes, FAO
developed a standard classification scheme, the Land Cover Classification System (LCCS)
(Di Gregorio and Jansen, 2000) that is being used by a growing number of international
projects (e.g. GLC, 2000) (Bartholomé and Belward, 2005). Moreover, a number of
countries have translated their existing land cover legends to align with the LCCS system
(Latham, 2008).
For assessment of land cover change with digital image processing, a variety of techniques
have been developed (Singh, 1989; Coops et al., 2006) and classified in scientific literature
reviews according to different criteria (Coppin, 2004; Lu et al., 2004; Hussain et al., 2013).
Common approaches for assessment of land cover change include: image algebra (Jensen
and Toll, 1982), regression or correlation (Jha and Unni, 1994), statistical techniques
(White et al., 2011), post classification comparison (Lyons et al., 2012), and the combined
analysis of data in a GIS (Petit and Lambin, 2001). Change can be spatially evaluated with
pixel or object based approaches, either kind of methods with particular strengths (Hussain
et al., 2013). Successful implementation of any of these techniques requires identification
of real change and discrimination of change artefacts due to seasonality, sun illumination,
sensor orientation, and other confounding circumstances (Lu et al., 2004).
1.5. Forest structure and forest biomass
Forest structure refers to the vertical and horizontal arrangement of canopies (Coops
et al., 2007), that is, the distribution of heights and spacing of trees. Several variables are
useful to characterize forest structure: individual tree measures of height, diameter, and
crown size, collective attributes like number of trees and spacing, and statistical averages
or indicators of variability. Some structural parameters can be directly measured in ground
plots (e.g. diameter) for inventory, other parameters can be modelled from direct
measurements (e.g. volume). By means of wall-to-wall remotely sensed observations and
statistical methods, structural parameters may be estimated over large areas (Tomppo et
al., 2002; McRoberts and Tomppo, 2007).
Forest biomass is the organic matter weight of the above ground (i.e. stem, branches, and
leaves) and below ground (i.e. radical system) portions of trees and shrubs (Montero et al.,
2005). Structure and above ground biomass (AGB) are essential features for the
assessment of forest productivity (Soenen et al., 2010), for modelling fire risks (Narayan et
al., 2007), determining carbon budgets (Kurz and Apps, 1999), and selecting management
options (Zianis et al., 2005).
Monitoring changes in the amount and spatial distribution of forest biomass and carbon
stocks is required for the sustainable management of forest resources (Tan et al., 2007;
Herrero and Bravo, 2012) and necessary to get some understanding of the forest carbon
budget. Measures of biomass can be readily transformed into values of C content through
species-specific or general conversion factors, being the relation of 0.5 carbon to biomass
(Kollmann, 1959; Penman et al., 2003) widely used. Consequently, maps of forest biomass
and biomass change enable spatially explicit estimates of forest carbon storage and fluxes
(Blackard et al., 2008).
Biomass and carbon temporal dynamics in forests are naturally ruled by successional
processes (Pregitzer and Euskirchen, 2004) and structural stage (Harmon et al., 1990).
Forest regeneration results in sequestration of C into the ecosystem, with young and
vigorously growing trees incorporating biomass in above and below ground fractions. As
regenerating stands approach maturity, the size of the vegetation C pool may eventually
reach its maximum stock level, with the age at which a forest becomes a net carbon sink
varying according to forest type, site productivity, and other factors (Birdsey et al., 2006;
Goward et al., 2008). Management systems organizing the structure and age distribution of
forest stands through space and time, and disturbances that modify the natural forest
successional course are crucial factors affecting forest biomass and carbon dynamics.
Quantifying the variability of forest biomass over large spatial extents and long periods of
time is essential for accurate carbon accounting (Goetz et al., 2009; Houghton, 2005).
1.6. Methods for measuring forest biomass and carbon content
Currently the main existent methods for accurate assessment of wood volume,
biomass, and carbon content in forests rely on sample plots measurements (Brown, 2002).
Basic attributes measured directly on trees, such as height and diameter at breast height,
can be readily converted to AGB through allometric regression equations (for individual
trees), or through biomass expansion factors (for stand-like areas). As many other
countries, the Spanish National Forest Inventory (NFI) has an established systematic
network of permanent plots re-measured periodically (Bravo et al., 2002). The NFI
provides reliable information on stocks, and also on growing rates, gains and losses, to
estimate stock changes at national level as recommended by the IPCC (2003) (Mäkipää et
al., 2010). Species specific allometric equations for coniferous and broadleaved native
species have been developed by Montero et al. (2005) and by Ruiz-Peinado et al. (2011).
These equations were derived with data measured in local forests, facilitate assessment of
most Spanish tree species, and represent a base for extending plot measures to larger
spatial units.
Forest inventories are typically designed based on statistical sampling to enable large area
knowledge of the variables of interest, in particular to facilitate assessment of biomass and
C resources. However, spatially explicit estimates of AGB over large areas that are derived
from traditional field based forest inventories may be incomplete (Du et al., 2011) and
limited by the sampling intensity (Wulder et al., 2008b). Carbon accounting approaches
requiring periodical reporting might also be limited by the temporal frequency of
measurements (Powell et al., 2010).
1.7. Remote sensing of forest biomass and carbon content
Remote sensing technologies constitute an effective instrument to evaluate
biophysical properties of terrestrial ecosystems, in particular forest structure and biomass.
Remote sensing has become the primary data source for biomass estimation (Lu, 2006),
providing repeat measurements with synoptic view of extensive areas, in digital format and
with affordable costs (Bettinger and Hayashi, 2006). Satellite observations contribute to
measuring and monitoring carbon stocks by routinely classifying land cover types,
extending in situ measurements over larger areas, informing ecosystem models, and
through direct relationships between biophysical attributes of vegetation and remotely
sensed observations (Goetz and Dubayah, 2011).
Medium spatial resolution (MSR) imagery (10 - 100 m pixel size) is well suited for
characterization of regional ecosystems. The Landsat series of satellites have provided
profuse base data in support of ecological assessments, for mapping forested areas, and for
estimating wood volume (Trotter et al., 1997; Kajisa et al., 2007), biomass (Zheng et al.,
2004; Luther et al., 2006) and carbon stocks (Foody et al., 1996; Turner et al., 2004).
Other satellites with similar spectral, spatial, and revisiting characteristics exist (Stoney,
2008) or are expected to be soon in operation (e.g. Sentinel-2) that may provide data to
cover potential gaps in the Landsat acquisition (Wulder et al., 2011). High spatial
resolution (HSR) imagery (< 5 m pixel size) is increasingly available to public use,
following the launch of commercial satellites: IKONOS (1999), QuickBird-2 (2001), and
GeoEye-1 (2008). The range of applications utilizing HSR imagery grows constantly and
includes estimation of forest structural parameters (Hirata, 2008; Mora et al., 2010, 2013)
and biomass assessment (Greenberg et al., 2005; Proisy et al., 2007).
For estimation of biomass, remotely sensed data can be used with different approaches
(Wulder et al., 2008b), based on the assumption of a strong statistical relationship between
above ground biomass and the spectral response as captured by the sensor (Lu, 2006).
Relations can be established directly between ground biomass and spectral response, or
indirectly through other estimated attributes such as Leaf Area Index or crown closure.
Statistical strategies for establishment of the most reliable relationships include multiple
regression, imputation, neural networks, or decision trees. The adequacy of a particular
model depends on data availability, desired precision, transparency, and site-specific
characteristics (Labrecque et al., 2006). Plot based National Forest Inventories are
frequently the source of data for calibration of models (Gallaun et al., 2010), meeting the
requirements recommended for modelling: data are representative of all conditions present,
and are acquired according to consistent specifications (Duane et al., 2010).
Optical sensors have a recognized and extensively reported limitation in the estimation of
some forest biophysical parameters, namely the saturation of measured reflectance at high
values of biomass or other estimated variables (Turner et al., 1999; Duncanson et al.,
2010). Expected to alleviate to some extent the saturation problem of previous sensors
(Wulder et al., 2011), the radiometry of the optical sensor onboard Landsat 8 (launched
11th February 2013), has been improved (data quantized to 12 bit instead of 8 bit) (Irons et
al., 2012). Landsat provides a favourable spatial resolution, revisit period, radiometric
resolution, and four decades of continuous Earth Observation (EO). Until more promising
techniques become operational, Landsat sensors and others alike remain the most useful
means for regional estimations of forest attributes.
The development of new technologies to map forest structure and biomass is a priority for
remote sensing agencies (Hese et al., 2005; Lefsky, 2010). A range of satellite missions
have been planned in the last decades with main goal estimation of biomass and biomass
change. NASA’s projected mission DESDynI (Deformation Ecosystem Structure and
Dynamics of the Ice) (Hall et al., 2011) was intended to include InSAR (Interferometric
Synthetic Aperture Radar) and LiDAR (Light detection and ranging) equipment.
Unfortunately, this promising mission was cancelled before birth (Goetz, 2011) due to
redistribution of funding. BIOMASS is an ESA projected mission conceived to include
band polarimetric SAR equipment with interferometric capability (Le Toan et al., 2011).
The advantage of radar technology is the transparency to atmospheric moisture,
particularly important in tropical and boreal systems, whereas LiDAR has demonstrated to
be highly sensitive to biomass change (Lefsky et al., 2002).
As part of the Global Monitoring for Environment and Security (GMES) programme, a
series of Sentinel satellites will commence operational phase in 2014 (Aschbacher and
Milagro-Pérez, 2012) providing continuity to SPOT and Landsat-type data. The Sentinel-2
is the optical high-resolution mission for GMES operational services (Drusch et al., 2012).
With global coverage, high revisit period (5 days) enabled by dual satellite constellation
and a set of narrow bands (12 bit quantization) dedicated to characterization of vegetation,
Sentinel-2 will be a good source of data for forestry characterization and monitoring of
change. Sentinel data policy is still undefined, but expected to be to allow anybody
(individuals and institutions from any part of the World) access to data of some processing
level (Aschbacher and Milagro-Pérez, 2012).
Synergistic use of data from passive and active sensors (e.g. LiDAR, radar) has shown
promising for improvement of biomass estimations. Combining Landsat with GLAS
(Geospatial Laser Altimeter System) data has shown successful to calculate biomass in
British Columbia (Duncanson et al., 2010) and forest height in Mississippi (Li et al., 2011)
while extending LiDAR estimates of forest parameters with Landsat imagery is becoming
frequent at the regional level (Maselli et al., 2011). In spite of the remarkable opportunities
offered by remote sensing technology and a continuous improvement of the space (i.e.
satellite, sensor) and ground (i.e. processing, distribution) segments, the estimation of AGB
is also restricted by uncertainties in the models, requiring further development and
refinement (Zhang et al., 2012). Nevertheless, remote sensing is the only feasible means
for national level assessments of AGB and carbon, and a growing number of countries are
incorporating remote sensing technologies in their National Carbon Accounting Systems
(e.g. Indonesia, Australia, USA).
1.8. Remote sensing opportunities in Spain
As part of the Spanish Plan Nacional de Observación Terrestre (PNOT), the Plan
Nacional de Teledetección (PNT) is committed to acquiring complete national coverage of
high spatial resolution satellite imagery annually (Arozarena, 2008). The acquisition phase
started in 2008 (Villa et al., 2009), capitalizing on archival data to backdate the database to
2005 coverage. Initial coverage consists of SPOT 5 HRG XS + P 2.5 m data, and other
sensors are being considered for future acquisitions (IGN, 2009). Access to this data source
represents a unique opportunity to incorporate HSR into Spanish forest inventories as an
operational and low cost data source to meet a range of information needs. The data is to
be collected with a primary focus on land-use land-cover change assessment (Villa et al.,
2009), but has capacity to generate information for forest monitoring and reporting.
Additionally, the PNOT acquires and pre-process abundant medium spatial resolution
imagery from the historical Landsat archive, making them available for research, and low
spatial resolution data from the AQUA/TERRA MODIS and ENVISAT MERIS sensors.
Furthermore, the Plan Nacional de Ortofotografía Aérea (PNOA) compiles LiDAR data
(0.5 pulses per square meter) over the entire national territory since 2009, from which
digital elevation products of high resolution are derived. LiDAR and aerial photography
are very supportive material for forestry applications (Suárez et al., 2005; Wulder et al.,
2008d). The PNT provides opportunities for future work that might be informed by the
methods and results of the work developed in this doctoral thesis.
2. AIMS AND OVERVIEW
This thesis focuses on the employment of satellite optical remotely sensed data of
medium and high spatial resolution, in combination with field measures, to estimate the
content and to assess changes of forest biomass and carbon fluxes over two and a half
decades (1984-2009) in pines of the Central Range of Spain. Novel techniques for data
processing and analysis are developed and tested in a dynamic forest area in Canada prior
to application in the target area. The location, extent, and distribution of pine forests are
characterized, and changes occurred during 25 years are evaluated. Capitalizing on
temporal series of spectral data, techniques are developed to identify forest successional
processes at the landscape level, and to characterize carbon stocking condition locally. In
addition to the characterization of trends and patterns of change through temporal
derivatives of medium spatial resolution spectral trajectories, an original application of
spatial statistics enables explanation of the spatial and temporal association of successional
processes. Forest structure is characterized at the stand level, and structural diversity
explored with high spatial resolution data captured by the QuickBird-2 satellite.
Aboveground biomass (AGB) is calculated retrospectively at specific dates (1990 and
2000) with modelled temporal trajectories of spectral vegetation indices. Maps are
produced at 30 m spatial resolution depicting AGB and change of AGB, providing
spatially detailed information and measures of the uncertainty associated, from which
carbon budgets are calculated.
2.1. Goal and main objective
The goal is to develop and test novel methods for estimation and monitoring of forest
biomass and carbon stock dynamics in pines of the Central Range of Spain, combining
optical remotely sensed data with field inventory data.
A specific objective is to obtain estimated values of above ground biomass and carbon
stored in pine areas of the Central Range of Spain, assessing changes that have occurred in
a twenty-five year period (1984-2009).
2.2. Thesis structure, specific goals and objectives
This doctoral thesis is structured into five chapters, each one holding a self-contained
investigation published or under review in peer reviewed international journals. Each
chapter focuses on different aspects of remote sensing technologies dedicated to the
assessment of forest AGB and AGB dynamics: land-cover and land-cover change,
distribution and association of state and processes of change over the landscape, forest
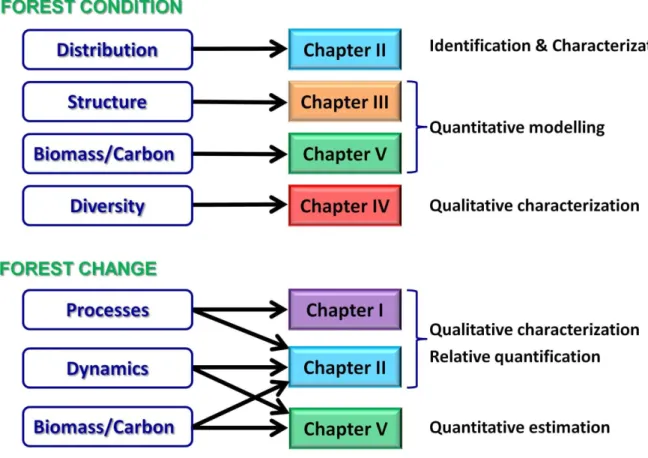
structure, structural diversity, biomass modelling and mapping. A schematic overview of
the main topics covered by each chapter is shown in Figure 1. Table 3 synthesizes the
goals and objectives of each chapter.
The main methods applied in this work, main results, some discussion, and conclusions (in
English and Spanish) are synthesized and presented prior to the main five chapters that
correspond with peer reviewed publications. Each publication is preceded by a summary in
Spanish.
Figure 1. Schematic overview of topics covered in the thesis.
Table 3. Summary of the goals, specific objectives, and outline of each chapter.
Goal
Specific objectives
Overview
C
h
a
p
te
r I
To investigate the capacity of spectral trajectories generated from a 35-year time-series of Landsat images for description and analysis of spatially and temporally diffuse change in a dynamic forest environment
•To characterize forest landscape change using Tasseled Cap Transformation derived indices •To incorporate spatial and temporal properties
into a hierarchical segmentation process to capture forest landscape-level change
•To analyze the spatial and temporal correlation of landscape change and processes through time
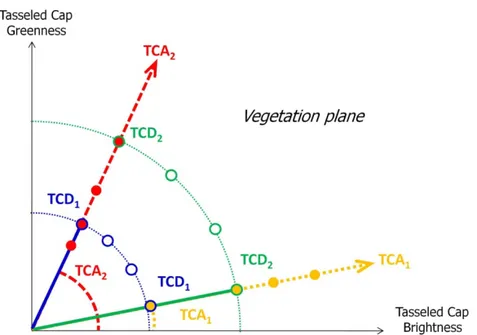
A temporal series (35 years) of calibrated and radiometrically normalized Landsat images helps charactering landscape changes in a very dynamic forest region of Alberta, Canada. Drastic and subtle processes are described through a new metric originated from the Tasseled Cap Transformation (TCT) Greenness and Brightness components, the Tasseled Cap Angle (TCA) and its derivative, the Process Indicator (PI). Simultaneous description of landscape process and pattern is enabled
Ch
ap
te
r II
To characterize changes in area, distribution, and carbon stocking processes of pines in the Central Range of Spain during a period of twenty-five years (1984-2009) with a medium spatial resolution time series of images from the Landsat program
•To assess changes in extent of a Mediterranean forest with a multilevel object oriented methodology
•To identify with spatial precision the distribution of pines in the Central Range of Spain and variations occurring in three sub-periods
•To characterize carbon stocking areas with the TCA, assessing trends of change over the period 1984-2009
Evaluates the distribution of pine forests in the Central Range of Spain during two and a half decades (1984-2009), mapping areas permanently covered by pines and areas of change. The state of development, that is, the closure or density condition is characterized and evaluated at various key times with the Tasseled Cap Angle (TCA) and changes are assessed with the TCA derivative, the Process Indicator (PI). The use of these newly derived indices, (TCA and PI) enables a combined analysis of forest state and stocking process
Ch
ap
te
r II
I
To explore the potential of high spatial resolution (HSR) imagery to characterize forest structure in Mediterranean pines in the Central Range of Spain. Motivated by this purpose the capacity of QuickBird-2 imagery to model the quadratic mean diameter, basal area, and number of trees per unit area at the stand level (as direct estimators of volume and biomass) is evaluated
•To model the relation between structural parameters (quadratic mean diameter, basal area, and number of stems per hectare) measured via field sampling and a set of spectral and spatial variables derived from QuickBird-2 multispectral and panchromatic imagery
•To test and verify the ability of Classification and Regression Trees (CART) as the statistical technique for modelling structural parameters •To identify the image derived variables with
the greatest informative capacity in the modelling of structural parameters, assessing in particular the inclusion of image textural metrics in the models
Investigates the local relationships of variables derived from HSR images with forest structural parameters such as quadratic mean diameter, basal area, and number of trees per unit area, as descriptors of stand density and direct estimators of volume and biomass. Statistical models based on dichotomous relations of images’ spectral and spatial features predict forest structural attributes
Ch
ap
te
r IV
To assess the potential of high spatial resolution (HSR) imagery to characterize forest structural diversity in Mediterranean pines of the Spanish Central Range
•To determine and quantify the relationships between forest structural diversity measured at the plot level and data captured by a satellite-borne sensor in the form of visible and NIR spectral reflectance as well as spatial combinations of panchromatic reflectance values, as related by texture metrics
•To identify the relative relevance of reflectance measures versus texture metrics in characterizing the forest structural diversity
•To assess how the spectral diversity-structural diversity relationship varies under different conditions of forest density, that is, determine if different relations occur in open versus closed forest conditions
Explores the capacity of HSR data to assess the structural diversity in forest stands of various crown closure conditions. The structural diversity is characterized at the plot level with a linear combination of internal variability of height, bole diameter, and crown diameter measured on the field. At similar spatial level the spectral and textural variability of multispectral and panchromatic imagery are evaluated. The strongest relations between a combination of image variables and a combination of field variables are identified with canonical correlation analysis. The relative importance of spectral and textural attributes in these relations is assessed as a function of stand density
C
h
a
p
te
r V
To estimate and map historical AGB (at specific dates in time), as well as a decade of change in AGB, by combining the precision of field measures from a network of NFI plots with the wall-to-wall spatial coverage provided by remotely sensed data
•To explore the relationship between live AGB derived from NFI ground plot measurements and vegetation spectral indices derived from Landsat data
•To model past AGB with historical spectral data, including single-date data and multi-temporal trajectories, providing a baseline for comparison with more recent estimations •To map historical AGB at two dates coincident
with NFI rotations (1990 and 2000) and evaluate the distribution of change in view of the uncertainties associated with the process of modelling and mapping
Develops novel methods for spatially explicit assessment of historical biomass and biomass change, based on the linkage between NFI data and archival Landsat imagery. Mathematical transformations of the data system formed by spectral indices and two rounds of NFI data enable derivation of dynamic variables associated to successional processes that happen to be good predictors of biomass. A baseline AGB1990 is produced
3. DATA AND METHODS
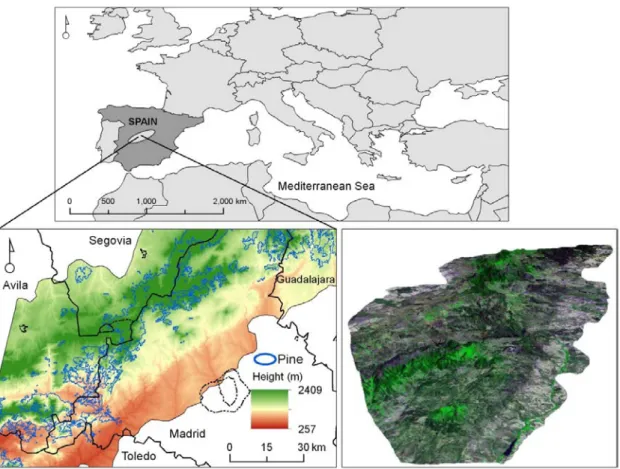
3.1. Study area
The Central Range of Spain is a mountain chain located in the middle of the Iberian
Peninsula, separating the North and South plateaus, and with a main SW to NE direction
(Figure 2). Its maximum height is reached at Pico Almanzor (Ávila) with 2592 m. As the
Spanish plateaus lay at very different elevation, the Central Range base height is 900 m on
the north face and 400 m on the south face. This height difference has direct weather
implications, with generalized milder conditions on southern locations. Rainfall and
temperature are very variable: many places on northern expositions receive 1000 mm y-1 of
water, frequently in the form of snow, and average temperatures in some places remain
below zero. Soils are predominantly acidic, with abundant granites, gneiss, and shales
(Gandullo, 1976; Aparicio and García Cacho, 1984).
Figure 2. Location of the area of interest in the middle of the Iberian Peninsula.
Dominant vegetation communities are distributed mainly as a function of altitude. On the
lower heights evergreen Holm oaks (Quercus ilex L.), sometimes combined with pines and
juniperus, dominate the landscape. Marcescent Pyrenean oaks (Quercus pyrenaica Willd.)
occupy areas in the mid heights, and mountain pines are the dominant tree species over
1600 m. Natural and planted pines (P. sylvestris L., P. pinaster Ait., P. nigra Arnold) are
the most extended tree species, climbing to elevations of 2000 m, beyond which shrubs
(Cytisus sp., Genista sp., Erica sp., Echinospartum sp.) and high altitude meadows are the
prevalent vegetation (Rivas-Martínez, 1963).
The area of interest for the work reported in this dissertation covers approximately one
million hectares in the Central Range of Spain, occupying part of the Ávila, Segovia,
Madrid, Guadalajara and Toledo provinces. It is centred at latitude 40º 37’ 56’’ N and
longitude –4º 6’ 47’’ E. Some forests in this region have been subject to a management
plan for more than a century, and although punctual socioeconomic circumstances
sometimes precluded perfect application (Bravo et al., 2010) forest structure has been
modified by silvicultural treatments.
3.2. Data
The work reported in this doctoral thesis was supported by data measured on the
ground and data sensed remotely. Measures from plot based field inventories served as
reference for derivation of statistical models of structure, diversity, and biomass, and in the
stages that required accuracy assessment of estimated values. Satellite remotely sensed
data was the base for identification and characterization of areas of interest (extent and
distribution), for up-scaling modelled parameters to the entire area, and to evaluate trends
and patterns of change, as well as absolute values of biomass and carbon content. Ancillary
data used include aerial photography at various dates and vector cartography.
Field inventory data
Field data from plot-based inventories such as the NFI and local management plans
were used at various stages of this research, being of particular value in the accuracy
assessment during the confidence building stages. Standard forest variables like tree
species, number of trees per plot, and diameter at breast height are measured in field
inventories, which are typically updated on a decadal basis.
National Forest Inventory data
National Forest Inventories are meant to provide information on forest resources at
the national level. At the beginning of the 20th century some NFIs introduced statistical
sampling as a means for basing their assessments (Tomppo et al., 2010), improving
calculations of volume stocks and forest growth. In Spain, the first global inventory was
motivated by the need of statistical data at the regional and national levels for policy
making, and by the requirement of estimates of forest areas and forest growing stock to
guide the establishment of new enterprises (Alberdi Asensio et al., 2010). The NFI1 was
conducted between 1965 and 1974, covered the entire national area, and employed
provinces (with ~106 ha on average) as the assessment units. The methods applied were
supported by aerial photography to determine forest/non-forest areas, and a sample of
spatially stratified non-permanent ground plots in which tree variables were measured.
Subsequent NFI rotations established a network of permanent plots over a systematic 1x1
km grid, with four concentric circular subplots of radius 5, 10, 15, and 25 m where trees of
different diameter at breast height (dbh) are measured (Bravo et al., 2002). NFI2 was
performed between 1986 and 1995, with spatial stratification of plots based on land-use
cartography, which had been created for agricultural use. To support NFI3 (1997-2007)
digital cartography was generated (Vallejo, 2005), and starting 2005 this NFI rotation
incorporated new measures for estimation of biodiversity (e.g. presence of threatened
species, volume of dead wood, soil parameters). Currently the fourth rotation of the NFI is
in course and expected to conclude in 2018. The NFI4 uses forest dedicated cartography of
scale 1:25000 and has consolidated the measurement of biodiversity variables. Application
of improved volume and growth equations is under investigation. To control the quality of
the inventory measurements, 5% of the plots are completely re-measured by a checking
crew soon after the regular measurement campaign.
Data from five provincial databases (Madrid, Segovia, Toledo, Guadalajara, and Ávila)
acquired by NFI2 and NFI3 were used in this work.
Management inventory data
In forest sites dedicated to production of timber, resin, pine nut or other extractive
resources, surveys or inventories are conducted periodically, for evaluation of forest
condition and assessment of resources. These inventories are based on interpretation of
aerial photography or on ground sample plots, systematically distributed over a stratified
grid of variable size that depends on forest condition. Plots are typically smaller than NFI
plots but located in a denser network. Attributes measured on the ground include diameter
at breast height (dbh), tree height, number of trees, and other features to characterize the
forest locally. Advanced technologies providing 3D data from ground measures, like
hemispheric photography with the ForeStereo (Montes et al., 2008) and Terrestrial Laser
Scanner (Maas et al., 2008) offer a range of opportunities to obtain comprehensive
information with some data processing back in the office. From aerial platforms, LiDAR
technology is progressively being incorporated into operational inventories (Hyppa et al.,
2012) as it is efficient in estimation of forest parameters at the stand level (Næsset, 1997),
for delineation of stands (Eysn et al., 2012), and for extraction of accurate elevation
models (Fricker et al., 2012). Lately, a number of management instructions in Spanish
forests require using these technologies for inventory. Data from two managed sites, Valle
de Iruelas (Ávila) and Pinar de Valsaín (Segovia), were used in the work presented in this
dissertation, as reference data for modelling structural parameters and structural diversity.
Satellite data
Satellite Earth Observation (EO) programs dedicated to observe the Earth landscape
started in 1960 with the launch of meteorological satellite TIROS-1 (Lauer et al., 1997). A
host of satellites have been launched and have orbited the Earth ever since, and forecast is
to see more in the future. Sensors onboard satellite platforms are identified as passive, if
they capture objects’ reflectance of the sun radiation (e.g. optical sensor), or active, when
the sensor captures its own radiation as reflected by other object (e.g. LiDAR and radar).
According to the pixel size or spatial resolution, (i.e. the minimum spatial unit on the
ground for which distinctive data acquisition is possible) (Jensen, 2005), sensors are
grouped into low- to very high- spatial resolution (Wulder et al., 2008d) (Table 4).
Tradeoffs between sensor resolutions (spatial, temporal, spectral, and radiometric) are key
for adequacy to applications (Lefsky and Cohen, 2003).
Table 4. Examples of EO satellites and sensors of low-, medium-, high- and very high- spatial resolution
Group Satellite (Sensor) Spatial resolution (m) Swath (km)
Very high (< 1 m) GeoEye-1 1.65 (MS) 0.41 (Pan) 15.2 High (1-10 m)
QuickBird-2 2.44 (MS) 0.68 (Pan) 16.5
Orbview-3 4 (MS) 1(Pan) 8
IKONOS-2 4 (MS) 1(Pan) 13.8
Medium (10-100 m)
Landsat
MSS 30-60 (MS/SWIR)
185 TM 30 (MS, SWIR)
ETM+ 30 (MS, SWIR) 30 (Pan) OLI 30 (MS, SWIR)
15(Pan) SPOT
2 (HVR) 20 (MS) 10 (Pan)
60
4 (HVIR) 20
5 (HRG) 10 (MS) 20 (SWIR)
IRS (ResourceSat-1) 23.5 140
Terra (ASTER) 15 (MS) 30 (SWIR) 60
EO-1 (Hyperion) 30 (MS) 7.5
CBERS-1 and -2 20 113
Low (> 100 m)
Terra (MODIS) 250-1000 2300
SPOT 5 (VGT) 1000 2250
NOAA-19 (AVHRR/3) 1100 2600
Note. MS: Multispectral; Pan: panchromatic; SWIR: shortwave infrared
The high temporal frequency and large image swaths of the Moderate Resolution Imaging
Spectroradiometer (MODIS) and Advanced Very High Resolution Radiometer (AVHRR)
make them adequate data sources for regional to global monitoring and mapping of broad
land cover patterns (Potter et al., 2005), for monitoring change over large areas (Potter et
al., 2003), and for rapid response action. Free economic cost and easy access to high
quality processed data support operational programs like Active Fire Mapping Project
(AFMP), which reports daily on fire activity in the USA and Canada, or DEFER project,
which offers monthly reports of tropical deforestation. AVHRR and MODIS programs
have provided daily records since 1981 and 2000, respectively, making them suitable for
medium term assessment of global transformations. High and very high spatial resolution
images (< 1-10 m pixel size) permit identification of small objects on the ground, like large
individual trees, and even related dimensions for estimation of forest structure (Wulder et
al., 2004a). Some commercial satellites offering this kind of data are steerable, enabling a
short return period of 1-5 days. Small image footprints (image size per acquisition) and
high data costs preclude more regular use in the civilian world.
Medium spatial resolution (MSR) images are adequate for characterization of landscapes,
and to monitor change events at the scale of human impacts. MSR is well suited for
characterization of forest condition (Cohen and Goward, 2004), and to monitor forest
change at the stand level (Wulder et al., 2008d). Typical MSR images are captured with a
wide swath, providing synoptic views for regional studies, and with an adequate range of
visible and infrared wavelengths for accurate characterization of land covers. Recent
policies making imagery easily accessible (e.g. Brazilian INPE, USGS, ESA) positions this
type of data as the most used and reliable for regional works.
Landsat program
The Landsat program was the first to launch an Earth-observing satellite with the
express intent to study and monitor our planet’s landmasses (Lauer et al., 1997). Back in
1972 when Landsat 1 was launched, it was called Earth Resources Technology Satellite
(ERTS). With seven satellites successfully launched (Figure 3), the program has acquired
imagery covering all but the highest polar latitudes during more than forty years,
contributing to the longest and most geographically comprehensive record of the Earth's
surface ever assembled (Wulder et al., 2012a). Technical characteristics of all segments
(spacecraft, sensors, ground station, and data transfer) have evolved over the years,
improving the spectral, spatial, temporal, and radiometric resolution of the data, refining
the instruments’ calibration (Irons and Masek, 2006), and establishing an optimized plan
called Long Term Acquisition Plan for acquisition of global imagery (Arvidson et al.,
2006). Landsat 8 was launched in February 2013, assuring the continuity of monitoring
programs. Further operational missions (Landsat 9 and 10) are intended to follow
(Loveland and Dwyer, 2012) and will provide continuity of comparable measures.
The sequence of Landsat satellites, operational period and the office in charge of
management are presented in Figure 3. The spectral, radiometric, and spatial characteristics
of the optical components of sensors onboard all Landsat satellites (Multi Spectral
Scanner, Thematic Mapper, Enhanced Thematic Mapper Plus, and Operational Land
Imager) are presented in Table 5.
Table 5. Spectral, spatial, and radiometric characteristics of Landsat sensors (thermal components of TM and ETM+ are not included). MSS: Multispectral Scanner; TM: Thematic Mapper; ETM+:
Enhanced Thematic Mapper Plus. OLI: Operational Land Imager.
MSS TM ETM+ OLI
#Band Width (μm)
GSD
(m) #Band
Width (μm)
GSD
(m) #Band
Width (μm)
GSD
(m) #Band
Width (μm)
GSD (m)
Visible
1 0.43-0.45 30
1 0.45-0.52 30 1 0.45-0.52 30 2 0.45-0.51 30
4 (1) 0.5-0.6 68x83 2 0.52-0.60 30 2 0.52-0.60 30 3 0.52-0.60 30
5 (2) 0.6-0.7 68x83 3 0.63-0.69 30 3 0.63-0.69 30 4 0.63-0.68 30
NIR 6 (3) 0.7-0.8 68x83 4 0.76-0.90 30 4 0.76-0.90 30 5 0.84-0.88 30
7 (4) 0.8-1.1 68x83
SWIR 5 1.55-1.75 30 5 1.55-1.75 30 6 1.56-1.66 30
7 2.08-2.35 30 7 2.09-2.35 30 7 2.10-2.30 30
Pan 8 0.50-0.68 30 8 0.50-0.68 15
SWIR 9 1.36-1.39 30
Figure 3. History of Landsat satellites and sensors. Adapted from:
http://landsat.gsfc.nasa.gov/about/landsat7.html. RBV: Return Beam Vidicon, MSS: Multispectral Scanner; TM: Thematic Mapper; ETM+: Enhanced Thematic Mapper Plus.