UNIVERSIDAD DE VALLADOLID
ESCUELA DE INGENIERIAS INDUSTRIALES
Grado en Ingeniería Mecanica
Design of a windmill for a Romanian
Countriside Home
Autor:
Barinaga Rodriguez Alvaro
Francisco Javier Santos Martin
Valladolid, 11/2018.
TFG REALIZADO EN PROGRAMA DE INTERCAMBIO
TÍTULO:
Design of a windmill for a Romanian Countriside Home
ALUMNO:
ALVARO BARINAGA RODRIGUEZ
FECHA:
10/05/2018
GHEORGHE ASACHI TECNICAL UNIVERSITY
Design of a windmill for a romanian countryside home
ALVARO BARINAGA RODRIGUEZ
FINAL PROJECT DEGREE
MECHANICAL ENGINEER
1.1.-
Abstract……….…………4
1.2.-
Motivation………4
2.-Wind energy among renovable energies
……….………5
2.1.-
Invesments in wind power………5
2.2.-
Plans for 2030 in Europe……….………9
2.3.-
DESCRIPTION OF THE 2030 WIND ENERGY CAPACITY SCENARIOS…..…..10
2.3.1.-
Central Scenario………10
2.3.2.-
Low Scenario………10
2.3.3.-
High Scenario………..………11
2.4.-
MACROECONOMIC AND SOCIAL IMPACTS OF THE SCENARIOS…..……….12
2.5.-
Developments……….………13
2.6.-
Repoweting potential to 2030……….………14
3.-Physical principles
………..………..……15
3.1.-
Wind generation………15
3.2.-Sea and land breezes
………..………15
3.3.-Near mountains
……….………16
3.4.-Venturi effect
………..………17
3.5.-Coandă effect
……….………17
3.6.-
boundary layer………18
3.6.1.-Laminar Boundary Layer Flow
……….………18
3.6.2.-Turbulent Boundary Layer Flow
……….………18
4.- Types of Wind Turbines
………19
4.1.-
Horizontal Axis ……….………19
4.1.1.-
Windmills……….………19
4.1.2.-
Small wind turbines………..…19
4.2.-
Vertical Axis……….………22
4.2.1.-
Advantages/disadvantages vertical………22
5.-Energetic study
……….………24
5.1.-
Energetic expense of a family………..………..24
6.Aeolian study
………25
6.1.-wind speed. Dynamic wind Pressure
……….………25
6.2.-Winter Action Zone in Romania
………26
6.3.-
Maximum value of the wind in Iasi………26
6.4.-
Weibull distribution. ………30
6.5.-
Stats wind in Iasi……….………30
6.6.-
Distribution for our case………33
6.7.-
Beltz Limit………34
6.8.-
Power selection of the wind generator………..………37
6.9.-
Cavitacion on the wings………38
7.-Design of the parts
………40
7.1.-
Parts of a Wind Turbine………40
7.2.-
Components of Wind Energy Systems………41
7.3.-
Materials Usage nowadays………42
7.4.-
Material Usage Trends……….………43
7.5.-
Device of orientation………44
7.6.-
Power transmission………47
7.6.1.-Blade-
hub ………47
7.6.2.-
Nose……….………48
7.7.-
Bearing………49
7.8.-
Nacelle/cases………50
7.10.2.-Base
………55
7.10.3.-
Top Cap………56
7.10.4.-
Tower analysis with ANSYS………..….……57
7.11.-
Stairs……….……..…..
59
7.11.1.-
Stairs analysis with ANSYS………..…………..……59
7.12.-
Generator………..……
60
7.13.-
Stand alone battery system ………..……63
7.13.1.-
Battery installation ……….…63
7.13.2.-
Battery live………64
7.13.3.-
Braking system………65
7.14.-
Blades………66
7.15.-
Maintance………..………68
7.16.-
Future Component Development Trends………68
8.-Economical Topic
………..……70
8.1.-Grid-connected instal
lation……….……70
8.2.-Off-
Grid Systems……….………71
8.3.-
Smaller wind energy systems……….………71
8.4.-
Estimated cost $/kWh……….……72
8.5.-
Budget of the Project………
73
8.6.-
Subsidies to the wind power………74
8.7.-
Study generation of energy………..………75
8.8.-Calculation of the pay-
back of the investment………77
9.-Conclusions
………
79
Bibliography………80
Figre .2.5.-Macro economic beneficts………9
Figure .2.6.- Share of wind energy………10
Figure 2.7.-Installed capacity………11
Figure 2.8.- GW politics………12
Figure 2.9..-Windeurope 2020-2030………12
Figure 2.10.- Countries situation………13
Figure 2.11.Countries develpment………14
Figure 2.12.Potencial in 2030………14
Figure 3.1 Wind generation………15
Figure 3.2.-sea and land frezees………16
Figure 3.3.-Wind near mountains………..………17
Figure 3.4.-Venturi effect………17
Figure 3.5.-Coanda effect………18
Figure 4.1.-Homemade windmill………19
Figure 4.2.Small wind turbine………20
Figure 4.3.- Offshore wind turbine………20
Figure 4.4.- Modern turbines………21
Figure 4.5.-Vertical axis turbine………..………22
Figure 6.1.-Judetul Iasi………25
Figure 6.2.- Romania wind map………26
Figure 6.3.- Weibull distribution……….………30
Figure 6.4.-Windmap Iasi……….………31
Figure 6.5.- Windmap values Iasi………31
Figure 6.6.-Representation values Iasi………31
Figure 6.7.-Density Air Iasi………32
Figure 6.8.-Density with the height Iasi………32
Figure 6.9.- Beltz limit………34
Figure 6.10.-Plot P/P0………35
Figure 6.11.-Plot V/V0………35
Figure 6.12.- Tip speed ratio-rotor power graph……….………36
Figure 7.1.-Parts of a wind turbine………40
Figure 7.2.- Off grid system………42
Figure 7.3.-Wind material usage trends………43
Figure 7.4.-Device of orientacion………45
Figure 7.9.- Conexión piece………49
Figure 7.10 Inside nose………49
Figure 7.11.- Bearings view………50
Figure 7.12.- Right Side Case………50
Figure 7.13.- Left Side Case……….………51
Figure 7.14.-Types of tower………52
Figure 7.15.- Lowered tower during strong winds………53
Figure 7.16.-Pier Foundation………53
Figure 7.17.-Cable across the tower………54
Figure 7.18.-3D model of the principal shaft………..…………55
Figure 7.19.- 3D model of the base………..………55
Figure 7.20.-3D model of the top cap………56
Figure 7.21.-Detail of the top cap………56
Figure 7.22.-Ansys equivalent stress………..………57
Figure 7.23 ANSYS total deformation………58
Figure 7.24.-ANSYS normal stress……….……..………58
Figure 7.25.-Stairs Total deformation………59
Figure 7.26.- Stairs Equivalent stress………59
Figure 7.27.-145STK generator……….………61
Figure 7.28.-Alternator curve Power/speed………62
Figure 7.29.-Battery installation………63
Figure 7.30.- Rg Wings CATIA………65
Figure 7.31.-3D model of the wing………66
Figure 7.32.-Wing Inside………67
Figure 8.1.-Grid connected system………70
Figure 8.2.- Off-gridd systems………..………71
Figure 8.3.-Economic Estimates for small wind turbines………72
Table 6.1.-Romania qb values………28
Table 6.2.-Values Weibull distribution………33
Table 6.3.-Diameter-Aelian power values………33
Table 6.4.- Diameter-Electrical power values………36
Table 6.5.- Diameter-Electrical power values corrected………37
Table 6.6.- Diameter final values………..…………38
Table 6.7.- Number of the blades………38
Table 7.1.-%cost and weight on aerogenerator………41
Table 7.2.- Large Turbine/Component material………42
Table 7.3.-Foundry characteristics………47
Table 7.4.-Altenator electrical characteristics………61
Table 7.5.-Alternator power Excel values……….……62
Table 7.6.-Wings material characteristics………67
Table 8.1.-Type of system/cost………..………71
Table 8.2.-Statics cost electricity Romania………..………72
Table 8.3.-Total Budget of the project………73
Table 8.4.-Budget after Spanish goberment subsides………..………74
Table 8.5.-Budget after Romanian goberment subsides………75
Table 8.6.-Total Bill………78
Rezumat
Principalul obieciv al acestui proiect este de a crea o mică turbină eoliană care să furnizeze suficientă electricitate pentru o familie. Proiectul este dezvoltat în România (Iași), mai precis pentru o zonă rurală a acestui județ unde locuiesc persoane în vârstă care au problemă cu alimentarea de energie electrică sau cu dezvoltarea acestui domeniu, oferind accesul persoanelor fără resurse la ceva atât de esențial precum energia electrică. Se pot găsi în această zonă probleme cu furnizarea de energie electrică, așa cum menționează și Uniunea
Europeană într-un raport despre infrastructura acestei țări, asigurând că aceasta nu a intrat
încă la nivelul mediu al Europei.
Vorbim aici despre o zonă foarte vântoasă care ne oferă posibilitatea să instalăm o mică turbină eoliană conectată în afara rețelei publice, care ar putea rezolva problemele de
aprovizionare, permițându-ne astfel să dezvoltăm alte activități, sau în cazul de față să ne
permină pur și simplu să trăim, acest lucru rezolvându-ne problema energiei electrice.
În zilele de astăzi, costul aceste turbine eoliene nu este foarte scump și fiecare familie și-ar
putea permite una, după cum urmează să fie demostrat în acest proiect.
Pentru a asigura funcționalitatea și structura turbinei eoliene, a fost efectuată o analiză exhaustivă ANSYS a axei, structurii, scărilor și mecanismului turbinelor eoliene, asigurând că acestea pot rezista chiar și în celor mai grave condiții de vânt din Iași, urmârind datele din harta vântului furnizate în timp real de către Uniunea Europeană.
Toate modelele 3D ale acestei turbine eoliene, precum și desenele, au fost realizate cu ajutorul CATIA V5 R20, oferind posibilitatea ca în viitor să se poată îmbunătăți componente, materiale
etc. În general, toată proiectarea ar putea fi îmbunătățită și chiar s-ar putea realiza un proiect
mai rentabil pentru dezvoltarea societății.
După cum o să puteți vedea, în dezvoltarea proiectului se găsesc foarte multe probleme
pentru care se vor căuta soluții prin alegerea a diverse materiale pentru fiecare parte a proiectului. În orice caz, se asigură măcar o durabilitate de aproximativ 18 ani.
Resumen
El principal objetivo de este proyecto es diseñar un pequeño aerogenerador que proporcione suficiente suministro eléctrico para una familia. El proyecto está desarrollado en Rumania (Iasi) concretamente para una zona de población rural dentro de esta provincia, donde se puede encontrar a personas de avanzada edad con problemas en el suministro eléctrico o para favorecer el desarrollo de esta zona, dando acceso a personas sin recursos a algo tan básico como la electricidad. Incluso se puede encontrar en esta zona problemas con el suministro eléctrico, así lo asegura la unión europea, en un informe sobre las infraestructuras de este país, en el que asegura que no ha entrado aun en el nivel de la media Europa.
Nos encontramos en una zona con mucho viento para instalar un pequeño aerogenerador conectado fuera de la red pública, que nos pueda solventar los problemas de suministro para poder desarrollar otras actividades, o en este caso vivir, lo cual nos haría resolver el problema energético.
Hoy en día el coste de este aerogenerador no es muy caro y podría ser asumido por cualquier familia, como se demostrará en este proyecto.
Para asegurarnos el funcionamiento y la estructura del aerogenerador, se ha realizado un exhaustivo análisis con ANSYS del eje, estructura, escaleras, y mecanismo del aerogenerador, asegurando que pueden resistir incluso en las peores condiciones de viento en Iasi, siguiendo datos del mapa de viento que proporciona en tiempo real la Unión Europea.
Todo el modelo 3D de este aerogenerador así como los planos se ha realizado con CATIA V5 R20 dando la posibilidad, para que en el futuro se puedan mejorar componentes, materiales, en general el diseño, y incluso hacer un proyecto más rentable para el desarrollo de la sociedad.
Como se podrá ver en el desarrollo del trabajo se encuentran multitud de problemas que se intentan solucionar eligiendo diversos materiales para cada parte del proyecto.En cualquier caso se asegura al menos una vida estimada de 18 años.
Summary
The main objective of this project is to design a small wind turbine that provides enough electricity for a family. The project is developed in Romania (Iasi) specifically for an area of rural population within this province, where you can find elderly people with problems in the electricity supply or to promote the development of this area, giving access to people without resources to something as basic as electricity. You can even find in this area problems with the electricity supply, as the European Union says, in a report on the infrastructure of this country, which ensures that it has not yet entered the level of the average Europe.
We are in a windy area to install a small wind turbine connected outside the public network, which can solve the problems of supply to develop other activities, or in this case live, which would solve the energy problem.
Nowadays the cost of this wind turbine is not very expensive and could be assumed by any family, as will be demonstrated in this project.
To ensure the operation and structure of the wind turbine, an exhaustive analysis has been made with ANSYS of the axis, structure, stairs, and mechanism of the wind turbine, ensuring that they can withstand even the worst wind conditions in Iasi, following wind map data provided in real time by the European Union.
All the 3D model of this wind turbine as well as the drawings has been made with CATIA V5 R20 giving the possibility, so that in the future components, materials, in general the design can be improved, and even make a more profitable project for the development of the society. As you can see in the development of the work are many problems that are trying to solve by choosing various materials for each part of the project. In any case it ensures at least an estimated life of 18 years.
1.-Introduction
1.1.- Abstract
The world is running out of conventional energy sources and there is a pressing need of utilizing non-traditional energy sources to endure the ever escalating energy needs. Wind turbines provide an alternative way of generating energy from the power of wind. At windy places, wind speeds can achieve scintillating values of 10-12 m/s. Such high speeds of wind can be utilized to harness energy by installing a wind turbine usually having 3 blades. The geometry of the blades is made as such that it generates lift from the wind and thus rotates. The lift force generates a moment around the hub and thus the combined torque effort of 3 blades rotates the turbine and generates electricity.
1.2.-Motivation
The main objective of the project is to design a small wind generator, which mission will be to supply electricity to a home that is of grid connected, knowing the energy that is needed and estimating if the turbine is competitive economical and energetically speaking.
The region studied in Romania.Is characterized for constant and strong wind during all the year and due to most of the population is distributed in houses in the countryside along the region an ideal solution is an off-grid system that could assure a minimum of energy each day. Due to the economical problema that most the population lives in this country.
As Europe development is a must to invest this kind of new energy forms,to be self-sufficient and be able to pose challenges for the future, especially today with problems and competition with nations such as Russia and China and the number of emerging countries.
The main obt¡jectives of the project are:
• Determinate if it is interesting for a family use a small wind power system to provide
themselves of energy
• Once it can be assured that it is possible and interesting, economical and physically
speaking it will be designed a small wind system that will supply energy a family.
• At the last part of the work there is an exhausted economical study in order to give
2.-Wind energy among renovable energies
Wind was the largest destination for power sector investments in 2016. Most of this
investment represents financing for greenfield assets. This suggests that wind energy is seen as a major driver to exit from fossil fuels. Cost competitiveness and reduced risk perceptions have brought in market players who are looking to diversify their oil and gas portfolios.
Figure .2.1.-European investments 2010-2016[1]
2.1.-Invesments in wind power
In the past Europe we can see that was a great deal to invest in wind energy specially countries like Spain and Germany did it.
The deployment of wind energy in Europe is a remarkable industrial success for Europe. Between 2006 and 2016, 106 GW of power capacity were installed, supporting 262,000 jobs. In the same period the US installed 71 GW, China 156 GW and the rest of the world 80 GW. 31% of the global installed capacity is in Europe and 46% was manufactured by European
companies.
Onshore wind energy is today the cheapest source of new power capacity in many places in Europe. Offshore, auction prices over the last year have exceeded the industry’s selfimposed
cost reduction targets of €100/MWh with projects delivering bids significantly below that level.
So wind energy could become the leading element of the power system with sustained progress on system integration and the acceleration of electrification. In 2016 wind energy overtook coal in terms of installed capacity, and for the sixth consecutive year wind energy topped investments in new power capacity.
However, the development of wind energy in Europe is more uncertain in the decade after 2020 than it was in the 10 years after it took off from being a niche technology.
European Commission President JeanClaude Juncker committed in his July 2014 inaugural speech to the European Parliament to making Europe the world’s number one in renewables.
However, Europe is dealing with increasingly intense competition from mature and emerging markets. This trend was highlighted in the run up to the 2015 Paris Agreement, when more than 70 countries mentioned wind energy in their Intended Nationally Determined
Contributions (INDC) as a key mitigation measure against climate change.
In the next 12 to 15 months, EU Member States and the European Parliament are expected to adopt the Clean Energy for All Europeans legislative package which will in large part determine the future of renewables in the decade after 2020. With this report WindEurope informs this process by providing updated potential deployment scenarios for wind energy to 2030. The report also highlights the role of wind in delivering the energy transition in Europe, in securing
Europe’s leadership in renewables and its role in supporting Europe’s wider social and
economic development.
Figure .2.3.-European total wind investments[1]
Europe invested a total of €43bn in the wind power sector during 2016. This includes
Table .2.1.-Eurpean new assents[1]
Wind energy markets in 2016 were very concentrated in Northern and Western Europeand were driven mainly by offshore wind.
Investments in Southern and Eastern Europe (SEE) remain very low. Regulatory concerns and macroeconomic stability have reduced investments in some of the SEE markets over the last years.
For the second consecutive year, the UK saw the highest level of funding for new projects. In
total, €12.7bn were raised for the construction of new onshore and offshore wind farms. This
accounts for 46% of new assets financed in Europe.
Germany represented the second biggest market in 2016: the €5.3bn raised accounted for 19%
of new assets financed in Europe.
2.2.-Plans for 2030 in Europe
Policy recommendations
The EU should raise its 2030 renewable energy target to at least 35% of final energy demand by 2030 with a clear breakdown per Member State
Member States should adopt early National Energy and Climate Action Plans based on a binding template providing clarity to investors on the post2020 market volumes including repowering
The post2020 Renewable Energy Directive should mandate Member States to set a schedule for renewable energy support providing investors at least three years of visibility
The post2020 Renewable Energy Directive should set clear design rules for renewable energy support mechanisms, including technology specific tenders, to manage the energy transition Market design rules should maintain priority dispatch for existing wind power plants and ensure new wind plants are dispatched down last and properly compensated in that occurrence
Member States should stop capacity payments to polluting power plants through the adoption of an Emissions Perfor mance Standard of 550 g CO2/kWh
EU rules on Guarantees of Origin should facilitate corporate renewable PPAs and drive renewables based electrification
2.3.-DESCRIPTION OF THE 2030 WIND ENERGY CAPACITY SCENARIOS
2.3.1.-Central Scenario
Figure .2.6.- Share of wind energy[2]
In the Central Scenario , the EU would be able to power 10ateo f10 30% of its electricity. Denmark would remain the country with the highest share of wind energy in its power mix followed by Ireland and Estonia. Germany, the UK, Spain and France would power respectively 47%, 38%, 34% and 26% of their electricity demand with wind energy.
In WindEurope’s Central Scenario , a clear 2030 governance structure with reporting
mechanisms on Member States’ progress to 2030 is implemented, and effective regional
cooperation mechanisms are established. Member States implement detailed National Energy
and Climate Plans in line with the EU’s binding targets. The Re newable Energy Directive is
implemented as proposed by the European Commission, and national policies for wind energy are streamlined, including repowering. As a result, the EU achieves a 27% renewable energy target
2.3.2.-Low Scenario
No binding templates are agreed for National Energy and Climate Plans leading to weak governance, a challenging implementation of the post2020 Renewable Energy Directive and failure to deliver the EUwide 27% renewable energy target.
No significant progress is made in electricity interconnections between Member States. Grid congestion issues continue to slow down new installations. The offshore wind energy pipeline of projects is below 4 GW/year, and cost reductions do not materialise.
Unfavourable national policies for permitting and planning in highpotential markets persist, resulting in the slowdown of new and repowered installations.
2.3.3.-High Scenario
The EUwide RES target for 2030 is increased to 35%. Binding templates for National Energy and Climate Plans are adopted, leading to an efficient governance system and full implementation of the recast Renewable Energy Directive.
The EUwide power transmission network is further developed beyond the European
Commission’s 15% target.
Both the new market design and a reformed ETS contribute to the phasing out of inefficient and uneconomical fossil fuels power plants and pave the way for a sustained development of renewable energy.
With a deployment 11ateo f 7 GW/year, the offshore wind industry becomes fully competitive with new fossil fuel generation.
Favourable national policies for permitting and planning are in place, resulting in the acceleration of new and repowered installations.
Europe accelerates electrification of heating, cooling and transport, bolstering demand for renewable power
Figure 2.8.- GW politics[2]
2.4.-MACROECONOMIC AND SOCIAL IMPACTS OF THE SCENARIOS
Figure 2.9..-Windeurope 2020-2030[2]
WindEurope’s Central Scenario of 323 GW would generate investment of €263 bn by 2030. The
industry could provide 569,000 jobs by 2030. The increase in jobs assumes that the EU supply chain remains competitive thanks to a robust market a doubling of onshore wind capacity and a fivefold increase in offshore wind capacity and to sustained European leadership in Research and Innovation. Wind energy would save 382 million tCO2 emissions and €13 bn in fossil fuel
imports to the EU in 2030.
The Low Scenario has 20% less capacity than the Cen tral Scenario in 2030. As a consequence,
the amount of investment would be reduced to €147 bn. The industry would generate
However, the realisation of the High Scenario would mean 23% more wind power capacity in
2030, which would yield 47% more investments, amounting to €351 bn. The industry would be
able to create 147,000 more jobs for a total of 716,000. Wind energy would save 103 million tCO2 more than in the Central Scenario for a total of 485 million tCO2. Finally, it would avoid
26% more fossil fuel imports for a total of €17 bn.
Table 2.2.-Possible scenarios[2]
2.5.-Developments
Figure 2.10.- Countries situation[2]
With 85 GW and more than a quarter of Europe’s cumulative capacity, Germany would be the
country with the largest wind energy fleet in the Central Scenario . France would follow with 43 GW, close to half of the German installations. The UK would be the third country in wind installations with 37.5 GW, 60% of which would be offshore. These three countries would
account for more than half of the EU’s total installations. Outside of the EU, Turkey (28 GW)
and Norway (11 GW) would also constitute significant wind energy fleets.
Figure 2.11.Countries develpment[2]
In the Central Scenario , the EU would be able to power close to 30% of its electricity. Denmark would remain the country with the highest share of wind energy in its power mix followed by Ireland and Estonia. Germany, the UK, Spain and France would power respectively 47%, 38%, 34% and 26% of their electricity demand with wind energy.
2.6.-Repoweting potential to 2030
Considering a lifetime between 20 and 25 years, 40 to 80 GW of the installed onshore wind capacity in the EU could reach endof life by 2030. The potential annual repowering volumes should grow significantly to reach the 47 GW/year range by 2025. This volume represents more than half of the annual onshore market, but will be highly dependent on the
implementation of fasttrack administrative procedures and Member States properly factoring repowering volumes as part of the National Energy and Climate Action Plans.
3.-Physical principles
3.1.-Wind generation
Wind is an atmospheric phenomenon due to the heating of the sun. The sun radiates on the Earth a power of 1.74 x 10¹⁷ Watts: about 2% of it is converted into wind energy. The Earth releases the heat received from the Sun, but this is hardly homogeneous. In those areas where less heat is released, the pressure of atmospheric gases increases, while in those areas where more heat is released, the air becomes hot and the gas pressure is reduced. As a consequence, high-pressure areas and low-pressure areas are formed, which are also influenced by the
Earth’s rotation. When different masses of air get in contact, the area with a higher pressure
tends to transfer air towards the area with lower pressure. Therefore wind is a more or less rapid air transfer between different pressure areas. The higher is the pressure difference, the faster is the air displacement and the stronger is the wind.
Figure 3.1 Wind generation[3]
3.2.-Sea and land breezes
In coastal regions, sea breezes and land breezes can be important factors in a location’s
prevailing winds. The sea is warmed by the sun more slowly because of water’s greater specific
heat compared 15ill1515a. As the 15ill1515atura of the 15ill1515a of the land rises, the land heats the air above it by conduction. The warm air is less dense than the surrounding
environment and so 15ill1515at. This causes a pressure gradient of about 2 millibars from the ocean to the land. The cooler air above the sea, now with higher sea level pressure, flows inland into the lower pressure, creating a cooler breeze near the coast. When large-scale winds are calm, the strength of the sea breeze is directly proportional to the 15ill1515atura
difference between the land mass and the sea. 15ill15 offshore wind of 8 knots (15 km/h) exists, the sea breeze is not likely to develop.
Figure 3.2.-sea and land frezees[3]
3.3.-Near mountains
Over elevated surfaces, heating of the ground exceeds the heating of the surrounding air at the same altitude above sea level, creating an associated thermal low over the terrain and enhancing any thermal lows that would have otherwise existed, and changing the wind circulation of the region. In areas where there is rugged topography that significantly
interrupts the environmental wind flow, the wind circulation between mountains and valleys is the most important contributor to the prevailing winds. Hills and valleys substantially distort the airflow by increasing friction between the atmosphere and landmass by acting as a physical block to the flow, deflecting the wind parallel to the range just upstream of the topography, which is known as a barrier jet. This barrier jet can increase the low level wind by 45%. Wind direction also changes because of the contour of the land.
If there is a pass in the mountain range, winds will rush through the pass with considerable speed because of the Bernoulli principle that describes an inverse relationship between speed and pressure. The airflow can remain turbulent and erratic for some distance downwind into the flatter countryside. These conditions are dangerous to ascending and
descending airplanes. Cool winds accelerating through mountain gaps have been given regional names. When these winds blow over open waters, they increase mixing of the upper layers of the ocean that elevates cool, nutrient rich waters to the surface, which leads to increased marine life.
Figure 3.3.-Wind near mountains[3]
3.4.-Venturi effect
The Venturi effect consists of a phenomenon in which a moving fluid inside a closed conduit decreases its pressure when the velocidadal increases passing through a zone of smaller section. Under certain conditions, when the speed increase is very large, negative pressures are produced and then, if at this point of the duct the end of another duct is introduced, an aspiration of the fluid from this duct takes place, which will be mixed with the one that circulates through the first conduit.
Figure 3.4.-Venturi effect[4]
The Venturi effect is explained by the Bernoulli Principle and the principle of mass continuity. If the flow of a fluid is constant but the section decreases, the velocity necessarily increases after crossing this section. By the theorem of the conservation of mechanical energy, if the kinetic energy increases, the energy determined by the value of the pressure decreases forcibly.
3.5.-
Coandă effect
The Coandă effect is the tendency of a fluidjet to stay attached to a convex surface. As
described by the eponymous Henri Coandă in different patents: "the tendency of a jet of fluid
Figure 3.5.-Coanda effect[4]
3.6.-boundary layer
In fluid mechanics, the boundary layer or border layer of a fluid in the area where the movement of this is disturbed by the presence of a solid with which it is in contact. The boundary layer is understood as one in which the velocity of the fluid approaches the movement in motion from zero to 99% of the speed of the undisturbed current.1
The limit capacity can be laminar or turbulent; although areas of laminar flow and turbulent flow can also coexist in it. Sometimes it is useful for the turbulent sea boundary layer. In aeronautics applied to commercial aviation, it is usually decided to have profiles that generate a capacity of turbulence, which remains adhered to the profile of an adult that can not be lost, that is, to stop generating aerodynamic sustainability in a sudden manner due to detachment of the boundary layer.
The thickness of the boundary layer in the area of the edge of attack or arrival is small, but increases along the surface. All these characteristics are modified depending on the shape of the object (lower resistance to the lower aerodynamic resistance capacity present on the surface: eg fusiform shape of a wing profile)
3.6.1.-Laminar Boundary Layer Flow
The laminar boundary is a very smooth flow, while the turbulent boundary layer contains swirls or "eddies." The laminar flow creates less skin friction drag than the turbulent flow, but is less stable. Boundary layer flow over a wing surface begins as a smooth laminar flow. As the flow continues back from the leading edge, the laminar boundary layer increases in thickness.
3.6.2.-Turbulent Boundary Layer Flow
At some distance back from the leading edge, the smooth laminar flow breaks down and tran-sitions to a turbulent flow. From a drag standpoint, it is advisable to have the transition from laminar to turbulent flow as far aft on the wing as possible, or have a large amount of the wing surface within the laminar portion of the boundary layer. The low energy laminar flow,
4.- Types of Wind Turbines
Wind energy conversion systems are designed to convert the energy of wind movement into mechanical power, that is the movement of a machine. In wind turbine generators, this mechanical energy is converted into electricity and in windmills this energy can be stored in batteries, or used directly.
Wind turbines are classified into two general types: horizontal axis and vertical axis. A
horizontal axis machine has its blades rotating on an axis parallel to the ground. A vertical axis machine has its blades rotating on an axis perpendicular to the ground.
4.1.-Horizontal Axis
This is the most common wind turbine design. In addition to being parallel to the ground, the axis of blade rotation is parallel to the wind flow. Some machines are designed to operate in an upwind mode, with the blades upwind of the tower. In this case, a tail vane is usually used to keep the blades facing into the wind. Other designs operate in a downwind mode so that the wind passes the tower before striking the blades. Without a tail vane, the machine rotor naturally tracks the wind in a downwind mode. Some very large wind turbines use a motor-driven mechanism that turns the machine in response to a wind direction sensor mounted on the tower
4.1.1.-Windmills
They are designed to operate at lower wind speeds than wind turbines for electricity
generation. Windmills, 'store' the energy they produce in water tanks so that water is available for feeding livestock, or irrigation in times where there is no wind. These windmill water pumping designs have also been used to provide electricity for rural electrification by using a battery system and low voltage systems. Today the more modern and efficient triple bladed rotor is commonly used in such stand-alone power systems
Figure 4.1.-Homemade windmill[6]
4.1.2.-Small wind turbines
produces more electricity than the household requires, the excess can be sold to the utility. With the inter-connections available today, switching takes place automatically.
Stand-alone wind energy systems can be appropriate for homes, farms, or even entire communities (a co-housing project, for example) that are far from the nearest utility lines. Either type of system can be practical if the following conditions exist.
Small wind generator sets for household electricity supply or water pumping represent the most interesting wind-energy applications in remote areas. Wind turbines for domestic or rural applications range in size from a few watts to thousands of watts and can be applied
economically for a variety of power demands. In areas with adequate wind regimes (more than five meters per second annual average), simple wind generators with an output range of 100 to 500 W can be used to charge batteries and thus supply enough power to meet basic electricity needs. In the past reliability of small wind turbines was a problem.
Figure 4.2.Small wind turbine[6]
4.1.3.-Offshore wind turbines
Offshore wind energy is a promising application of wind power, particularly in countries with high population density, and difficulties in finding suitable sites on land. Construction costs are higher at sea, but energy production is also higher.
4.1.4.-Common modern wind turbines
Usually three-bladed, sometimes two-bladed or even one-bladed (and counterbalanced), and pointed into the wind by computer-controlled motors. The rugged three-bladed turbine type has been championed by Danish turbine manufacturers. These have high tip speeds of up to 6x wind speed, high efficiency, and low torque ripple which contributes to good reliability
Figure 4.4.- Modern turbines[6]
4.1.5.-Advantages/disadvantages horizontal
Blades are to the side of the turbine's center of gravity, helping stability. Ability to wing warp, which gives the turbine blades the best angle of attack. Allowing the angle of attack to be remotely adjusted gives greater control, so the turbine collects the maximum amount of wind energy for the time of day and season. Ability to pitch the rotor blades in a storm, to minimize damage. Tall tower allows access to stronger wind in sites with wind shear. In some wind shear sites, every ten meters up, the wind speed can increase by 20% and the power output by 34%. Tall tower allows placement on uneven land or in offshore locations. Can be sited in forests above the treeline. Most are self-starting. Can be cheaper because of higher production volume, larger sizes and, in general higher capacity factors and efficiencies.
HAWTs have difficulty operating in near ground, turbulent winds because their yaw and blade bearing need smoother, more laminar wind flows.
The tall towers and long blades (up to 180 feet long) are difficult to transport on the sea and on land. Transportation can now cost 20% of equipment costs. Tall HAWTs are difficult to install, needing very tall and expensive cranes and skilled operators.
Supply of HAWTs is less than demand and between 2004 and 2006, turbine prices increased up to 60%. At the end of 2006, all major manufacturers were booked up with orders through 2008. The FAA has raised concerns about tall HAWTs effects on radar in proximity to air force bases. Their height can create local opposition based on impacts to viewsheds.
Offshore towers can be a navigation problem and must be installed in shallow seas. HAWTs can't be floated on barges.
Downwind variants suffer from fatigue and structural failure caused by turbulence.
4.2.-Vertical Axis
Although vertical axis wind turbines, have existed for centuries, they are not as common as their horizontal counterparts. The main reason for this is that they do not take advantage of the higher wind speeds at higher elevations above the ground as well as horizontal axis turbines. A vertical axis machine need not be oriented with respect to wind direction. Because the shaft is vertical, the transmission and generator can be mounted at ground level allowing easier servicing and a lighter weight, lower cost tower. Although vertical axis wind turbines have these advantages, their designs are not as efficient at collecting energy from the wind as are the horizontal machine designs
Figure 4.5.-Vertical axis turbine[6]
4.2.1.-Advantages/disadvantages vertical
Easier to maintain because most of their moving parts are located near the ground. This is due
to the vertical wind turbine’s shape. The airfoils or rotor blades are connected by arms to a
shaft that sits on a bearing and drives a generator below, usually by first connecting to a gearbox. As the rotor blades are vertical, a yaw device is not needed, reducing the need for this bearing and its cost.
Vertical wind turbines have a higher airfoil pitch angle, giving improved aerodynamics while decreasing drag at low and high pressures. Mesas, hilltops, ridgelines and passes can have higher and more powerful winds near the ground than up high because of the speed up effect of winds moving up a slope or funnelling into a pass combining with the winds moving directly into the site. In these places, VAWTs placed close to the ground can produce more power than HAWTs placed higher up.
Low height useful where laws do not permit structures to be placed high. Smaller VAWTs can be much easier to transport and install.
Does not need a free standing tower so is much less expensive and stronger in high winds that are close to the ground. Usually have a lower Tip-Speed ratio so less likely to break in high winds.
by using structures to funnel more and align the wind into the rotor (e.g. "stators" on early Windstar turbines) or the "vortex" effect of placing straight bladed VAWTs closely together. There may be a height limitation to how tall a vertical wind turbine can be built and how much sweep area it can have.
Most VAWTS need to be installed on a relatively flat piece of land and some sites could be too steep for them but are still usable by HAWTs.
Most VAWTs have low starting torque.
5.-Energetic study
The study Will be about the electricity waste by a “standard” house referring to the necesities
of a family.
That study is very important because with the minimum power it will be decided too the situation of the turbine the wind that needs etc…
5.1.-Energetic expense of a family
That study consists in plus all the household-electric machines and illumination, due to all the machines will not be all together switched on at the same time there is a coefficient of simultaneity that determines a minimum power.
In the following there are more or less all the household-electric machines of a standard family with their power, hour of consumption per day and the energy waste per day.
Waste energy tale of a standart family
Hosehold-electric
Power(W)
Hours consumption
(h/day)
Total(W*h/day)
Fridge 225 24 5400
Beater 300 0.25 75
Washing machine 2000 0.25 500
Microwave 600 0.5 300
TV 95 3 285
Video 75 1 75
Oven 1000 0.25 250
Hoover 900 0.25 225
Electric Ceramic- Glass Range
1100 2 2200
Computer 200 2 400
Ilumination
Power(W)
Hours consumption
(h/day)
Total(W*h/day)
Kitchen 150 2 300
Bathroom 100 2 200
Room 1 100 2 200
Room 2 100 1 100
Salon 200 3 600
Hall 70 1 70
Receiver 80 0.25 20
TOTAL
7325
10850
Table 5.1.- Waste energy tale of a standart family
The power that the wind turbine have to generate will be less than the total of the table, using a Coefficient of simultaneity of 60 % the final power will be, equation
6.Aeolian study
6.1.-wind speed. Dynamic wind Pressure
Its important to know the power that the wind of the study zone could give,
so in that part of the work is going to be determined the power curves of the wind turbine General elements.
The project will be developed in the Romania in Iasi.That part of Romania has consistent winds during whole year furthermore that part has problems with the electrical provisioning so installing an off-grid small wind generator to provide energy it will be a solution to the energetic provisioning.
Figure 6.1.-Judetul Iasi[7]
6.2.-Winter Action Zone in Romania
The statistical analysis carried out for the zoning natural wind hazard in Romania had as maximum velocity of the annual wind of entry to 10 m above the ground, measured more than 140 meteorological stations of the national administration of Meteorology until 2005. The results of the statistical analysis are characteristic wind velocities (reference) with IMR = 50 years, calculated from the distribution of Gumbel for maximums. For the determination of the reference values of the dynamic wind pressure reference values have been processed at the wind speed sites of the meteorological stations that have received the records. Data zoning Map of dynamic wind pressure reference values for altitudes less than or equal to 1,000 m
Figure 6.2.- Romania wind map[7]
6.3.-Maximum value of the wind in Iasi
Zoning of dynamic wind pressure reference values, QB in KPa, with IMR = 50 years It is presented in reference Values of the dynamic pressure of the wind to 337 cities in Romania, placed in elevations of less than or equal to 1,000 m.
The reference value of the dynamic wind pressure to a location at an altitude Z more than 1000 m can be determined with the ratio:
where:
is the reference value of the dynamic wind pressure at the site of the zoning map shown in Figure 2.1;
Is the altitude factor that can be determined, roughly, with the relationship
For sites located at altitudes above 1000 m and in areas with special wind exposure (south-west Banat), it is recommended to obtain primary data from the NMA and consult specialized construction institutions to analyse this data.
The reference value of the wind velocity with an average recurrence interval of 50 years for a site located at an altitude of less than or equal to 1000 m is determined according to the dynamic reference value of the wind pressure of the site (see zoning Map In Figure 2.1). and the data in table A. 1) and is calculated with the ratio:
Where ρ is the density of the air equal to 1.25 kg/m3, and QB is the reference value of the
dynamic wind pressure measured in PA (1 kPa = 1000 pa). The characteristic wind velocity values with an average recurrence interval of 100 years and 10 years can be calculated
simplistically according to the wind velocity characteristic for an average recurrence interval of 50 years with the Following relationships:
The characteristic values of the dynamic wind pressures defined with an average recurrence interval of 100 years and 10 years can be calculated by simplifying according to the
Table dynamic wind pressure reference values for 337 urban locations in Romania
Table 6.1.-Romania qb values[7]
Where ρ is the density of the air that varies according to the altitude, the temperature, the latitude and the station. For standard air (ρ = 1.25 kg/m3), the reference pressure (expressed
in Pascali) is determined by the ratio:
Reference values of dynamic wind pressure in Romania are set out in the zoning map. Map the zoning of the wind dynamic pressure reference values in Figure 2.1 is valid for altitudes less than or equal to 1 000 m. The reference value of the dynamic wind pressure at a location at a Z-height greater than 1000 m may be determined as indicated below for
mountainous areas or areas at an altitude of 1000 m is recommended for recent primary data recorded by the National meteorological NMA Administrative view. In addition, it is necessary to determine if the value of the factor is recommended to use the last primary data NMA directional REDC. The wind velocity reference value for a location reference value is obtained from the dynamic wind pressure corresponding to the site (taken from the map)
So for our case in Iasi we will obtain the reference value of the wind.
First of all we should take the density of the wind we will assume normal wind so ( ρ = 1,25 kg /
m3).
So the top expression will be now entering now with this in the about Iasi.Table 6.1 to look for our value.
We obtain qb=0,7 kPa for Iasi.
Now we have more or less the calculus of the wind we need to look the altitude of the windmill to see if we have to add other factors.
Our windmill is for a countryside house so we assume the heigh is <1000m so its not necessary to add anything, because this expression is for heights >1000m.
So obtain:
Vb=33.46 m/seg it is the maximum reference value for the wind in Iasi.
6.4.-Weibull distribution.
Wind speeds in most of the world can be modelled using the Weibull Distribution. This statistical tool tells us how often winds of different speeds will be seen at a location with a certain average (mean) wind speed. Knowing this helps us to choose a wind turbine with the optimal cut-in speed (the wind speed at which the turbine starts to generate usable power), and the cut-out speed (the speed at which the turbine hits the limit of its alternator and can no longer put out increased power output with further increases in wind speed).
Figure 6.3.- Weibull distribution[6]
Pictured above is an example of the Weibull Distribution of Wind Speeds for a site with an average (mean) wind speed of 7 metres per second (from Danish Wind Industry Association). It demonstrates visually how low and moderate winds are very common, and that strong gales are relatively rare. The line at 6,6 metres per second marks the median wind speed. 50% of the time the wind is lower than the median and 50% of the time it is stronger than the median. The shape of the Weibull Distribution depends on a parameter called, Shape. In Northern Europe and most other locations around the world the value of Shape is approximetely 2. Standard performance figures provided by wind turbine manufacturers typically use a Shape value of 2 making this distribution a Rayleigh Distribution.
The higher the value of Shape (from 1 to 3) the higher the median wind speed - i.e. locations with lots of low wind speeds as well as some very strong winds would have a value of shape of below 2, locations with fairly consistent wind speeds around the median would have a shape value of 3.
So in our case is obviusly that our value of shape is 2.
6.5.-Stats wind in Iasi
After having the maximum value of the wind in Iasi it is very important to obtain the main value of the wind in Iasi.
Figure 6.4.-Windmap Iasi[7]
Obtain from there the following table with a normal year.
Figure 6.5.- Windmap values Iasi[7]
With the main value of the graphs and the stats obtain we can get a real value of the wind following the Weibull distribution.
After that is very important to calculate the value of the density, I use the webage of the Danish windmill assotiation who gives a calculator introducing the main parameters. Can see in the following picture
Figure 6.7.-Density Air Iasi[7]
The density of the wind in iasi introducing the media values will be 1,238 kg/m^3.
Its important to know how the wind goes with the height in the same page there is a calculator specially for that can introduce our dates and check that our windmill its not so height(5 meters) in the place where the wings are there will be no changes for the speed of the wind.
6.6.-Distribution for our case
The wind follows a weibull distribution in this case a distribution with 9 m/s of mean speed. Calculate the distribution is complex so using three main values of the graphic there is the following that explains the hours that the generator works per day and the wind distribution.
work hours per day wind speed(m/s) %
3 5 0,33
4 9 0,44
2 15 0,22
Table 6.2.-Values Weibull distribution
With those values is possible to find a considered wind speed, that speed will be the mean speed to calculate the Aeolian power and estimate a diameter for the turbine.
Vconsidered
Vconsidered=5*0.33+13*0.44+15*0.22=9 m/seg
After calculating the considered speed and knowing the density of the wind the next step is to calculate the rotor diameter necessary. Using the equation before it is done the table with the output power depending on the diameter of the blades
After calculating the considered speed and knowing the density of the wind the next step is to calculate the rotor diameter necessary. The table is made by the program with the output power depending on the diameter of the blades.
Diameter(m) Aelian power(W)
1 354.5
2 1417.64
3 3189.70
4 5670.58
4.5 7176.83
5 8860.29
Table 6.3.-Diameter-Aelian power values
Following the table the diameter of the rotor that is needed is around 3 metres or more than 3 meters and a half, but that values are not real because there is another coefficient (Beltz
coefficient) that it haven’t still used but is must be considered to calculate the output power.
The energetic study said us than our requeriments are
6.7.-Beltz Limit
Betz's law indicates the maximum power that can be extracted from the wind, independent of the design of a wind turbine in open flow. It was published in 1919, by the German
physicist Albert Betz.[1] The law is derived from the principles of conservation of mass and momentum of the air stream flowing through an idealized "actuator disk" that extracts energy from the wind stream.
Wind turbines extract energy by slowing down the wind. For a wind turbine to be 100% efficient it would need to stop 100% of the wind but then the rotor would have to be a solid disk and it would not turn and no kinetic energy would be converted. On the other extreme, if you had a wind turbine with just one rotor blade, most of the wind passing through the area swept by the turbine blade would miss the blade completely and so the kinetic energy would be kept by the wind.
Figure 6.9.- Beltz limit
The mass of the air streaming through the rotor during one second is
Where m is the mass per second, is the density of air, F is the swept rotor area and [(v1+v2)/2] is the average wind speed through the rotor area. The power extracted from the wind by the rotor is equal to the mass times the drop in the wind speed squared (according to Newton's second law):
Substituting m into this expression from the first equation we get the following expression for the power extracted from the wind:
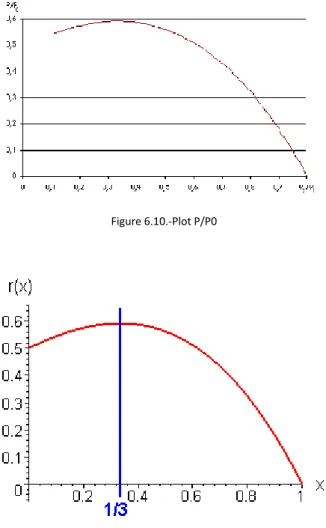
The ratio between the power we extract from the wind and the power in the undisturbed wind is then:
We may plot P/P 0 as a function of v 2 /v 1 by 35xcel
Figure 6.10.-Plot P/P0
Figure 6.11.-Plot V/V0
Diameter(m) Electrical power(W)
1 209.155
2 836.4076
3 1881.923
4 3345.6422
4.5 4234.3297
5 5227.5711
Table 6.4.- Diameter-Electrical power values
But this is not the only parameter to know, theoretical maximum power efficiency of any design of wind turbine is 0.59 (i.e. no more than 59% of the energy carried by the wind can be extracted by a wind turbine). Once you also factor in the engineering requirements of a wind turbine, strength and durability in particular, the real world limit is well below the Betz Limit with values of 0.35-0.47 (figure 3.5) common even in the best designed wind turbines. By the time you take into account other ineffiencies in a complete wind turbine system - e.g. the generator, bearings, and power transmission and so on - only 10-30% of the power of the wind is ever actually converted into usable electricity.
Figure 6.12.- Tip speed ratio-rotor power graph[6]
As it is showed after(next chapter) whit a three bladed turbine and a tip speed of 5.1 the power coefficient is 0,45. Then substituting that value in the equation there is the table that’s
Diameter(m)
Electrical power(W)
1 151.54875
2 606.0411
3 1363.59675
4 2424.17295
4.5 3068.09483
5 3787.77398
Table 6.5.- Diameter-Electrical power values corrected
As it can be seen on the table the rotor diameter needed for that application is, that is a big diameter for a small application. Using batteries bank as it will be shown that the rotor diameter need is reduced.
6.8.-Power selection of the wind generator
With the last table is possible to determinate the minimum necessary diameter to generate the enough power to supply energy for the house.
The demand of electricity of the housing is not always the minimum power calculated and if is used a battery system the size of the blades can diminish. Since one will see later on it is selected an alternator, so it is necessary to install to the exit of this one a battery charger to be able to load the batteries. The battery charger is a conversor of A.C to D.C. To the exit of the batteries it is necessary to install an inverter that turns her D.C. to A.C.
The total consumption of energy is, according to the enerfgetic study, is
10850
W·h/day so, the batteries have to be capable to give this value. But it is necessary to add the consumption of energy of the electrical system, That is estimated in 10 % [3] of the total consumption of energy. Then estimating that the wind blows 10 hours per day, the consumption of energy and the consumption of the electric system, the minimum power of the generator will be.=
=1326.11W
Pelec-wid-generator=
We must interpolate to calculate the mean value
Diameter(m)
Aelian
power(W)
Electrical
power(W)
1 354.5 151.54875
2 1417.64 606.0411
3 3189.70 1363.59675
4 5670.58 2424.17295
4.5 7176.83 3068.09483
5 8860.29 3787.77398
Table 6.6.- Diameter final values
Finally it is selected a generator with a 3 metres blades diameter, that diameter gives 1363W of power, seemed to 1326 W that is the minimum necessary power.
6.9.-Cavitacion on the wings
if the speed of the blades trespass that velocity could appear the cavitacion phenomenon, this could diminish the yield of the generator, shorten the life of the blades, vibrations and noise.
To calculate that value is used the equation.For that calculation is used the rated speed for the blades of 325 rpm, the maximum of the interval that the manufacturers give.
To finish with the main design of the wind generator it is necessary to chose how many blades will have.
First of all it have to be calculated the tip speed ratio λ with the equation and then look for in
the following table.
=325 ∗ 2 ∗ 𝜋
60 ∗ 1.5
9 = 5.67
λ Nº of blades
1 6-20
2 4-12
3 3-8
4 3-5
5-8 2-4
5-15 1-2
7.-Design of the parts
7.1.-Parts of a Wind Turbine
A wind turbine usually comprises the following parts
Figure 7.1.-Parts of a wind turbine[8]
-Rotor: The blades of the rotor are designed to spin in the wind, driving the turbine generator. Sometimes gearing is used to increase the frequency for electricity generation.
-Generator: This generates the electricity when there is sufficient wind to rotate the blades. There are now many designs of generator, including some with new powerful
permanent magnets. Electricity is transferred to the next stage (either for storage, exporting to the grid or for direct use) using cabling.
-Directional system: Horizontal axis machines require a mechanism to swing them into line with the wind. Small machines usually have a tail assembly for furling. Large machines usually have a 'servo mechanism' that orients them into the direction of maximum output.
-Protection system: Modern wind turbines are usually equipped with mechanisms to prevent damage in excessively high winds. Large machines may use active methods involving aerodynamic and mechanical brakes to shut down generation at high wind speeds. Smaller systems may use passive methods such as furling or changing the blades' pitch so that they present a smaller surface to the wind and thereby reduce the speed of rotation.--
-Tower: The tower raises the turbines assembly well above the turbulent air currents close to the ground and captures higher wind speeds, as described earlier in this fact file. Tower design is particularly critical, as it must be as tall as economically possible, robust, enable access to the turbine for maintenance, and yet not add unnecessarily to the cost of the system. A particularly important aspect of tower design is elimination of resonance between the frequency range of rotating blades and the resonant frequency of the tower.
support bearings, the generator, plus other machinery; a tower; and ground-mounted electrical equipment.
The wing shaped blades on the rotor actually harvest the energy in the wind stream. The rotor converts the kinetic energy in the wind to rotational energy transmitted through the drivetrain to the generator. Generated electricity can be connected directly to the load or feed to the utility grid.
The weight and cost of the turbine is the key to making wind energy competitive with other power sources, because research programs have significantly improved the efficiency of the rotor and maximized the energy capture of the machine. The real opportunity today is through better, low cost materials and though high volume production, while ensuring the reliability is maintained. The typical weight and cost of the primary turbine components today are shown in the following table In addition there are foundations and conventional ground-mounted systems, including transformers, switching and other power equipment.
Table 7.1.-%cost and weight on aerogenerator
There appear to be several areas where technological progress and cost reduction are needed. Turbine subsystem costs are generally evenly split between rotor, nacelle, drivetrain power systems, and the tower. There is no single component that dominates turbine cost. The rotor is the highest cost item on most machines and must be the most reliable. Towers are normally the heaviest component and could benefit from weight reduction, but lightening the rotor or tower-top weight has a multiplier effect throughout the system including the foundation.
7.2.-Components of Wind Energy Systems
It is referred to the electronical part and how the windmill produces electricity to the public and your own red.
There are two big systems on-grid and off-grid, explained better in the economical part because it have a very importal body in the economical problem.
Figure 7.2.- Off grid system[6]
7.3.-Materials Usage nowadays
A wide range of materials are used in wind turbines. There are substantial differences between small and large machines and there are projected changes in designs that will accommodate the introduction of new material technologies and manufacturing methods. To arrive at a total, the material usage is weighted by the estimated market share of the various manufacturers and machines types.
Table 7.2.- Large Turbine/Component material
to meet strength and structural fatigue requirements. The size of steel castings for large turbines, especially the blade hub units, is one of the manufacturing challenges.
Material fatigue properties are an important consideration in wind turbine design and materials selection. During the expected 30 year life of a wind turbine, many of the
components will need to be able to endure 4 x 10⁸ fatigue stress cycles. This high cycle fatigue resistance is even more severe than aircraft, automotive engines, bridges and most other man-made structures.
7.4.-Material Usage Trends
The component development trends described above are reflected in the following material use projections. The overall annual material usage trends are shown in the following figure for two periods, from 2001 though 2005 and for 2006 though 2010. Introduction of much of the new technology discussed above is expected to be incorporated in commercial machines during the later period. Materials used in machines installed in the U.S. are included as part of the global totals.
Figure 7.3.-Wind material usage trends
The following observations are based on the results of the material usage analysis:
• Turbine material usage is and will continue to be dominated by steel, but
opportunities exist for introducing aluminum or other light weight composites, provided strength and fatigue requirements can be met.
• Small turbine production volume is increasing rapidly which can be accommodated
• Elimination of the gearbox by using variable speed generators will increase through
use of permanent magnetic generators on larger turbines increasing the need for magnetic materials.
• New high power electronics will help reduce the need for gearboxes and also
decrease losses occurred during transmission of wind power to distant load centers.
• Simplification of the nacelle machinery may not only reduce costs, but also increase
reliability.
• Blades are primarily made of GRP, which is expected to continue. While use of CFRP
may help to reduce weight and cost some, low cost and reliability are the primary drivers.
• Increasing the use of offshore applications may partially offset this trend in favor of
the use of composites.
• Prestressed concrete towers are likely to be used more, but will need a substantial
amount of steel for reinforcement.
• Wood epoxy, used in early blade production, is not expected to be a material of
choice despite excellent fatigue properties.
• Wind turbine component and materials manufacturing are major and expanding
business opportunities for at least the next 10 years.
• The largest market for wind turbine systems and materials in the future will be
outside North America and Europe, but this market will be slower in development.
7.5.-Device of orientation
The mechanism of orientation aligns the rotor with perpendicularly to the wind, without that device the rotor could have a mistake of orientation. That is very important because a bad orientation could be a loss of power so almost all the small generators has that devices. There are different mechanisms of orientation, the most common are:
- Orientation by stabilizing fin -Servomotor.
![Figure .2.3.-European total wind investments[1]](https://thumb-us.123doks.com/thumbv2/123dok_es/6124216.178978/15.892.158.738.756.1051/figure-european-total-wind-investments.webp)
![Figure .2.4.- Cumulative investments. [1]](https://thumb-us.123doks.com/thumbv2/123dok_es/6124216.178978/16.892.148.738.137.783/figure-cumulative-investments.webp)
![Figure .2.6.- Share of wind energy[2]](https://thumb-us.123doks.com/thumbv2/123dok_es/6124216.178978/19.892.211.673.235.664/figure-share-of-wind-energy.webp)
![Figure 2.7.-Installed capacity[2]](https://thumb-us.123doks.com/thumbv2/123dok_es/6124216.178978/20.892.134.746.622.1079/figure-installed-capacity.webp)
![Figure 2.8.- GW politics[2]](https://thumb-us.123doks.com/thumbv2/123dok_es/6124216.178978/21.892.150.743.164.464/figure-gw-politics.webp)
![Table 2.2.-Possible scenarios[2]](https://thumb-us.123doks.com/thumbv2/123dok_es/6124216.178978/22.892.308.676.523.772/table-possible-scenarios.webp)
![Figure 6.2.- Romania wind map[7]](https://thumb-us.123doks.com/thumbv2/123dok_es/6124216.178978/35.892.136.722.319.751/figure-romania-wind-map.webp)
![Figure 6.6.-Representation values Iasi[7]](https://thumb-us.123doks.com/thumbv2/123dok_es/6124216.178978/40.892.204.694.822.1064/figure-representation-values-iasi.webp)
![Figure 6.7.-Density Air Iasi[7]](https://thumb-us.123doks.com/thumbv2/123dok_es/6124216.178978/41.892.136.737.674.992/figure-density-air-iasi.webp)