On the Structure and Properties of Silver Nanoparticles
Miguel A´ . Gracia-Pinilla,† Eduardo Pe´rez-Tijerina,†,§Joel Antu´nez Garcı´a,‡
Carlos Ferna´ndez-Navarro,‡Alfredo Tlahuice-Flores,‡Sergio Mejı´a-Rosales,‡
Juan M. Montejano-Carrizales,| and Miguel Jose´-Yacama´n*,⊥
Laboratorio de Nanociencias y Nanotecnologı´a (FCFM), Centro de InnoVacio´n, InVestigacio´n y Desarrollo en Ingenierı´a y tecnologı´a (CIIDIT), UniVersidad Auto´noma de NueVo Leo´n, Monterrey, NueVo Leo´n, Me´xico 66450, Laboratorio de Disen˜o Molecular (FCFM), Centro de InnoVacio´n, InVestigacio´n y Desarrollo en Ingenierı´a y tecnologı´a (CIIDIT), UniVersidad Auto´noma de NueVo Leo´n, Monterrey, NueVo Leo´n, Me´xico 66450, Centro de InVestigacio´n en Materiales AVanzados (CIMAV), Unidad Monterrey, Parque de InVestigacio´n e InnoVacio´n Tecnolo´gica (PIIT), Monterrey, NueVo Leo´n, Me´xico 66600, Instituto de Fı´sica, UniVersidad Auto´noma de San Luis Potosı´, SLP Me´xico 78000, and Department of Physics and Astronomy, UniVersity of Texas at San Antonio, San Antonio, Texas 78249-0697
ReceiVed: May 8, 2008; ReVised Manuscript ReceiVed: June 12, 2008
Silver tetrahedral nanoparticles (NP) were synthesized using the inert gas condensation technique. We performed morphological and optical characterization of the nanoparticles (NPs) using atomic force microscopy (AFM), mass spectroscopy (MS), and UV-visible spectroscopy. The Ag NPs were produced by modified magnetron sputtering, followed by thermalization and condensation in a high pressure zone. Along the synthesis process, the size of the NPs was controlled through the handling of the gas flow (Ar and He), the magnetron power, and the length of the aggregation zone. We optimized the synthesis parameters to obtain a peak on the size distribution of Ag NPs around of 5 nm (as measured with AFM and MS). The AFM measurements show that the particles have tetrahedral shape, with a fair correspondence with a 2925-atoms ideal tetrahedron. We performed a set of Molecular Dynamics (MD) calculations using the Embedded Atom potential model to simulate the dynamics of particles with different shapes, obtaining that, at sizes close to that of the particles produced experimentally, the tetrahedra may be as energetically stable as cuboctahedra of roughly the same size, and that their melting point is below but close to that of the bulk. We also found that both the size and shape of the nanoparticles determine the shift of the UV-visible absorption spectrum. Finally, we observed the formation of atomic islands above the faces of the Ag tetrahedral NPs, in agreement with the results obtained from the MD simulations.
Introduction
The past decade has witnessed a great increase in the use of computer simulations of nanostructures, mainly due to the availability of inexpensive commodity hardware, the develop-ment of efficient simulation codes, and the construction of reliable atomistic interaction models. The simulation results for structural and thermodynamical properties, and their comparison against the experiments, have a direct effect on the way that novel nanomaterials are produced and characterized. Thus, the development of new nanomaterials for applications in medicine, catalysis, electronics, optics and plasmonics, commonly involves molecular simulations to some degree.1-4In this work we use
the results of molecular dynamics simulations to compare the structural and energetic behavior of several geometries proposed as models for the Ag tetrahedral nanoparticles that were synthesized by physical processes, and to predict the thermo-dynamical conditions needed for the stability of these structures.
It is well established that silver nanoparticles have unique antibacterial and antiviral properties.1,5Different methods can
be used to synthesize Ag nanoparticles, but the predominant methods are those based on chemical reactions, mainly because no special equipment is needed, the reactants are usually inexpensive, and there is no limit on the production rate other than the amount of available material. In these methods, Ag salts are reduced with a reductor agent, and the kind of reductor strongly determines the geometry and shape of the resulting particles.6,7 Nevertheless, the chemical route involves many
technical issues that broaden the distribution of sizes and shapes. In contrast, physical methods such as thermal abrasion and ionic erosion are frequently used when the dispersity in size and the variations in the geometry of the particles are critical factors. In particular, the inert gas aggregation (IGA) method allows the optimal control in the size of metal and metallic alloy nanoparticles.8-11A mass filter located along the path of the
nanoparticles allows to monitor in situ the size variations as the control variables of the IGA reactor are modified. In this way is possible to find the optimal conditions to produce nanoparticles of specific mean sizes and small deviations.
A fine control of size and composition, along with the use of high resolution electron micrographs under controlled thermal conditions, make possible the direct comparison of the structural details of the particles with those predicted by molecular dynamics (MD) simulations. Thus, former MD studies on Au and Au/Pd nanoparticles confirm the appearance of a hysteresis
* To whom correspondence should be addressed. Phone: 210-458-5451. Fax: 210-458-4919. E-mail: [email protected]. Web: http://www. che.utexas.edu/yacaman/.
†Laboratorio de Nanociencias y Nanotecnología, CIIDIT, Universidad
Auto´noma de Nuevo Leo´n.
‡Laboratorio de Disen˜o Molecular (FCFM), CIIDIT, Universidad
Auto´noma de Nuevo Leo´n. §Unidad Monterrey.
|Universidad Auto´noma de San Luis Potosí. ⊥University of Texas at San Antonio.
loop in the melting-freezing cycle,12-14and that the melting
temperature of the Au nanoparticles strongly depends on the size of the cluster.15Recently, Chen et al. 16investigated the
melting transition of Ag/Au small particles (n ) 55), and constructed a transition phase diagram that may be contrasted with experiments using particles of the same size.
Baletto, et al.17,18have devoted several papers to investigate
the lowest energy structures of silver nanoparticles, and how the shape of the particle depends on its size. Using numerical simulations, they found that Marks decahedra and fcc truncated octahedra are the most stable structures when the size of the particle is around 3000 atoms. Nevertheless, since more than half of the surface in cuboctahedra consists on (100) faces, cuboctahedra are not the most energetically stable structures. Truncated octahedra (Wulff shapes) should be more favorable. On the same order of ideas, there exist some results by Grochola et al.19using a slightly different approach to that of Baletto,
that suggest that the formation of tetrahedral structures is similar of that of Dh structures (for Au nanoparticles).
In this work we show the results of the controlled synthesis of Ag NPs, produced by dc-sputtering and selected by size. We used AFM to characterize the shape and crystal structure of the nanoparticles, and compared these measurements with theoretical calculations using Molecular Dynamics (MD) simulations using the embedded atom model (EAM) interatomic potential. These calculations were made for different geometries (icosahedron, cuboctahedron, sphere, perfect tetrahedron, tetrahedron with its upper apex displaced to one of the vertices of the base, and tetrahedron with its upper apex displaced to one of the lateral face).
Experimental Methods and Theoretical Calculations
We produced Ag nanoparticles by the Inert gas aggregation technique (8,9,10,11), using a synthesis reactor built by Mantis Deposition Ltd.;20 Figure 1 shows a schematic diagram of
experimental setup. In this method, a supersaturated vapor of metal atoms is generated by sputtering; the process of production of nanoparticles takes place in the active chamber, by a combination of three mechanisms: aggregation or attachment of atoms around to clusters (dimmer, trimers, etc.); coagulation of nanoparticles, and coalescence process (this last process takes predominance at high temperatures).21In any synthesis
experi-ment the competition of these three mechanisms exists, but by an adequate choice of parameters is possible to make the first mechanism (aggregation or attachment) to predominate above the others. The generation rate of metallic nanoparticles is controlled through the variation of (i) Ar gas flow and He,(ii)
partial pressure (1-2× 10⁻¹torr), (iii) magnetron power (in
the range of 30-70 W), and (iV) length of the aggregation zone (from 80 to 130 mm). The nucleation rate of the nanoparticles is varied controlling the Ar gas flow (at fixed partial pressure); the Ar gas produces the erosion of the metal target such that as more argon is present into the chamber, the amount of erosion is larger. Thus, if the flow of argon is kept low, is possible to obtain nanoparticles as small as a few Angstrom in size. The role of the He gas is somewhat different: when the helium flow is increased, the number of collisions is high, reducing the mean free path of the nanoparticles, which diminish their mean size. The power of the magnetron controls the kinetic energy, which determines the amount of erosion on the metal target, whereas the aggregation zone length sets the residence time of the nanoparticles on the aggregation zone. By the manipulation of these parameters is possible to find the optimal conditions to produce particles of a specific mean size. In the case concerning this paper, the parameters were set to produce Ag nanoparticles of 5nm, deposed on quartz substrates. To keep a low density of nanoparticles, the depositions were made in just a few minutes. In order to preserve the structural and morphological properties, the energy of cluster impact22,23was controlled; the energy of
acceleration was close to 0.1 eV/atom, which corresponds to a soft landing regime.22,24The morphological characterization of
the particles was made by AFM analysis, using a Veeco CPII AFM system in contact mode. The size analysis was made by mass spectroscopy using a RF quadrupole.25
To get insight on the nature of the formation of tetrahedral clusters, we carried out a set of molecular dynamics (MD) simulations, where the energetic and structural behavior for a set of clusters (Figure 2) was analyzed as function of the temperature under both heating and cooling. Based on the experimental results, we focused on the simulation of tetrahedral structures, particularly on a tetrahedron with an apex displaced to one vertex. We used the Embedded Atom Model (EAM) to define the atomic interactions, as implemented in the XMD code,26 and employing the parametrization following the
theoretical framework of Johnson.27The equations of motion
were solved every time step of∆t)2 fs. All the clusters were initially thermalized at 300 K for 1 ns, and heated above their melting temperature at a rate of 1011K/s. For the cooling series,
the starting configurations were taken from the results of the heating series at 1000, 800, and 600 K. Starting from these temperatures, the tetrahedral clusters were cooled down to 300 K, at the same rate as they were heated.
pressure inside of the nanocluster aggregation zone (∼10 torr), (f) cooling lines, (g) aggregation zone, (h) vapor generation, (i) skimmers, (j) beam of nanoparticles, (k) partial pressure outside of the nanocluster aggregation zone (∼10-4torr).
Results and Discussion
Experimental Measurements.We used different techniques to characterize the structural and optical properties of the Ag
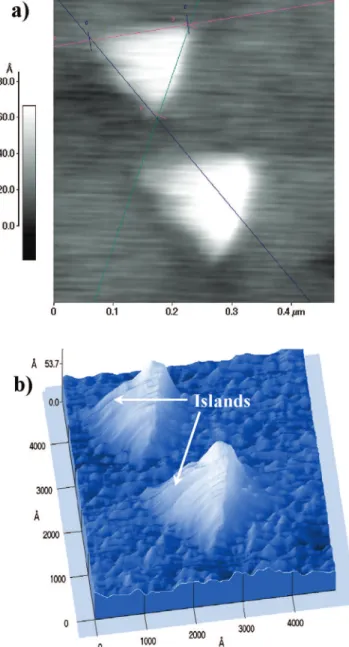
particles. By AFM imaging we found that the particles are tetrahedral in shape, with a mean height of 5 nm, see Figure 3. Whereas AFM measurements of distance in the z-axis are directly related to the real height of the structures, it is well-known that distances laying on the xy-plane must not be interpreted as the real spatial dimensions since at this range of sizes, the width of the AFM tip is comparable to the diameter of the nanoparticles, and for this reason any measured distance may be increased as much as an order of magnitude. Taking this into consideration, it is not surprising that the measured vertex-to-vertex distance is 150 nm. Figure 3b shows a 3D projection of the particles, where it can be clearly noted that the shape corresponds to a tetrahedron with an apex displaced to one of its vertices.
Figure 4 shows the UV-visible absorption spectrum of the Ag tetrahedral nanoparticles supported in the quartz substrate. Here, only one band of plasmon resonance absorption is observed, centered at 437 nm. This peak is characteristic of Ag nanoparticles,28and the shift-both in shape and size- with respect
to the Ag in bulk, is a fingerprint of the particles being supported
Figure 3. (a) Monodisperse Ag tetrahedral nanoparticles, with a vertex-to-vertex distance of 150 nm and height of 5 nm. (b) Topographic view of the Ag tetrahedral nanoparticles.
Figure 4. UV absorption spectrum of the Ag tetrahedral nanoparticles.
Figure 5. Mass spectrometer profile of Ag nanoparticles.
TABLE 1: Typical Ranges of theQ6Order Parameter for Several Ideal Structures
Ih Q6g0.61892
FCC 0.541eQ6<0.618
BCC 0.497eQ6<0.541
HCP 0.457eQ6<0.497
Dh 0.391eQ6<0.457
SC Q6<0.3917
by a substrate, since the interaction between the substrate and the nanoparticles changes the optical response of the latter.29
The synthesis parameters that determine the mean size of the particles were optimized to produce particles of 5 nm. The mass spectrum of Figure 5 shows that the distribution of sizes is indeed centered around 5 nm. In general, we do not expect that particles of the same size produced under different sets of parameters to have the same shape or crystalline structure, since the kinetic processes during the growth of the particles are qualitatively different.
MD Simulations.The MD simulations were performed using six different initial structures, for purposes of comparison. Figure 2 shows these structures: (a) an icosahedron (2869 atoms), (b) a cuboctahedron (2869 atoms),c)a spherical cluster of 2899 atoms obtained from and fcc lattice, (d) a perfect tetrahedron of 2925 atoms (which we identify as Tetrahedron I), (e) a tetrahedron with its upper apex displaced to one of the vertices of the base (Tetrahedron II, 2856 atoms), and (f) a tetrahedron with its upper apex displaced to one of the lateral face (Tetrahedron III, 2925 atoms). To investigate the structural behavior of the clusters during the heating and cooling processes, we calculated the global order parameterQ6,24,31,32which is defined as
Q6)
(
4π
13m
∑
)-66
|Q6m|
2
)
1⁄2(1)
where Q6m)
∑
i)1
N
∑
j)1
Nnb
Y6m(rij)
∑
i)1
N
Nnb(i)
(2)
Y6m(rij) are the 6m spherical harmonics, rij is the distance
between atomsiandj,Nis the total number of atoms of the cluster, andNnb(i) is the numbers of neighbor atoms surrounded
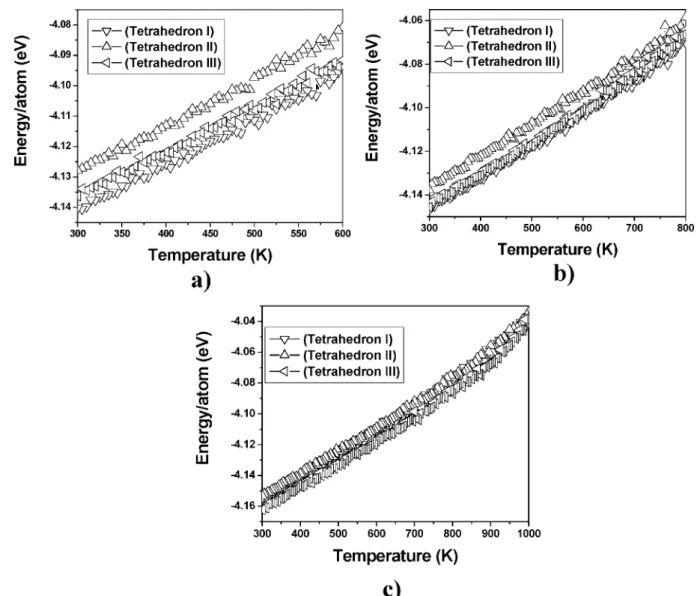
clusters show a multiple step behavior (marked with colored arrows in the extensive figures in the Supporting Information available), where the energy turns deviates from a linearly increasing behavior. In agreement with the calorimetric curves for tetrahedral clusters, theQ6curves (Figure 7) show structural changes at the temperatures at which the energetic steps occur. Furthermore, the Q6 curves show a major detail of certain changes that the calorimetric curves do not resolve clearly. Eventually, the structural changes during the heating process lead the decahedral clusters to improve their configurational energy and thus to reach higher melting points than the icosahedral and spherical clusters (see Table 2).
To discuss the dynamic stability of the atoms on the clusters, we considered the normalized relative displacement (NRD), defined here asdi(T))
√
(ri(T)-ri(T0))2⁄rmax, wherejri(T) is theposition vector of thei-th atom measured at a temperatureT,
r
ji(T0) is the position vector of the i-th atom measured at a temperatureT)300 K (this is, at timet)0).rmaxis the global maximum relative displacement magnitude, taken from the maximum relative displacement value obtained in the simula-tions (it occurred in the icosahedral cluster). Defined in this way, thedi(T) values can be used as a measure of how stable is
the structure of a specific region of the particle. We calculated the values of di(T) every ∆T )1 K. The comparison of the
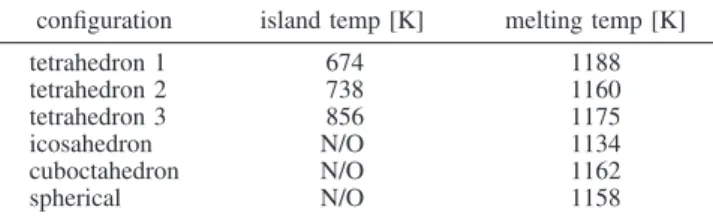
NRD values, made in Figure 8 for two values of temperature, shows that these structural changes indeed increase the stability of the atoms around their equilibrium sites. In the figure, we show snapshots of the icosahedron and Tetrahedron I clusters, where the atoms are represented by colored spheres, in a color scale related to their NRD values. It can be observed that at 700 K the majority of atoms in the icosahedral cluster have low NRD values, except for atoms close to the vertices, which have a low coordination number. In contrast, at this temperature the Tetrahedron I shows appreciable structural changes, with the atoms on the vertex have migrating to the center of the faces forming atomicislands(small aggregates of 1.3 nm in size). In Table 2 we indicate the temperature at which the atomic island appear for the simulated structures. We propose that the formation of atomic islands are favored by the surface recon-struction.33
The tetrahedral clusters observed in the experiments present islands of atoms at their faces, in agreement with the molecular dynamics results. This feature has a reasonable explanation from energetic arguments, since the atomic migration to form islands increases the coordination number of the atoms, which improves the structural stability of the particle. The atomic migration, observed in the simulations at a temperature close to 700 K, promotes the formation of the islands on the (111) planes in the surface of the tetrahedra, whereas the less coordinated atoms are restrained in a small region. Only a few atoms at the surface (those originally located at the corners and vertices) of the
Figure 7. Q6 curves for the different structures during the heating process. The more pronounced structural changes for the tetrahedral clusters are marked with arrows.
TABLE 2: Island Formation Temperatures and Melting Temperatures for the Simulated Structuresa
configuration island temp [K] melting temp [K]
tetrahedron 1 674 1188
tetrahedron 2 738 1160
tetrahedron 3 856 1175
icosahedron N/O 1134
cuboctahedron N/O 1162
spherical N/O 1158
tetrahedra have high NRD values, in contrast with the icosa-hedral cluster, see Figure 8 c and d. Eventually, the islands evolve to form a new layer, and atoms with high NRD values are confined to the vertices and borders.
We performed a set of cooling simulations starting at three different temperatures: (a) 1000, (b) 800, and (c) 600 K, using as initial configurations those obtained by the heating series. In general, we did not find significant changes in the final structures
Figure 8. Atomic configurations for (a) and (c) Icosahedron, and (b) and (d) Tetrahedron I clusters, at two different orientations. The color scale corresponds to the normalized relative displacementsdi(T) values. Two temperatures below the melting point are shown: (a and b) 700 and (c and
d) and 1122 K. (the white color corresponds to short displacements and the black color corresponds to long displacement).
of the tetrahedra when the cooling process was simulated, but an anomalous behavior of theQ6parameter was observed for the tetrahedron II, see Figure 9. By inspecting the simulation trajectory we found that this anomaly is mainly due to the reorganization of the atoms on the vertex, with low coordination values. The values of Q6 obtained at the end of the cooling series correspond to a structure closed to a fcc for the Tetrahedron I, and to a Dh structure for the Tetrahedron II and III. The caloric curves corresponding to the cooling series are shown in Figure 10, where it can be noted that, whereas the Tetrahedron I cluster appears to be the most energetically favorable when the simulation begins at 600 or 800 K, when the run is started at 1000 K the Tetrahedron II is the structure with the lowest final energy. These results not only reinforce the accepted fact that the trajectory taken by the system in a MD simulation performed under a temperature gradient may determine the final structure, but they also show that these two modified tetrahedra are suitable candidates to describe the particles observed in the experiments.
Conclusions
We synthesized Ag tetrahedral nanoparticles by the use of Inert Gas Aggregation techniques, obtaining modified tetrahedral structures with an apex displaced to one vertex. AFM images
validate the size, shape of Ag tetrahedral nanoparticles. We observed the formation of atomic islands on the faces of the Ag tetrahedral nanoparticles, in agreement with simulation results obtained using MD. These results show that the proposed tetrahedral models are unstable, but the relocation of the less coordinated atoms, originally located at the vertices and corners of the particle, to form atomic islands on the faces of the tetrahedra, make the structures energetically stable at low temperatures. The presence of these islands is in agreement with the AFM results. We suggest that the surface roughness originated by the formation of these islands may have a high relevance in the catalytic activity of the tetrahedral nanoparticles, and further work will be devoted to investigate this relation.
Acknowledgment. This work was supported by the Inter-national Center for Nanotechnology and Advanced Materials of the University of Texas at San Antonio (ICNAM), the Council for Science and technology of the State of Nuevo Leo´n, Me´xico, and the National Council for Science and Technology, Me´xico (CONACYT), Grants No. 43772 and 207569.
References and Notes
(1) Morones, J. R.; Elechiguerra, J. L.; Camacho, A.; Holt, K.; Koutri, J. B.; Ramirez, J. T.; Yacama´n, M. J.Nanotechnology2005,16(10), 2346– 2653.
(2) Rodriguez-Gattorno, G.; Diaz, D.; Rendon, L.; Hernandez-Segura, G. O.J. Phys. Chem. B2002,106, 2482.
(3) Zhou, W. P.; Lewera, A.; Larsen, R.; Masel, R. I.; Bagus, P. S.; Wieckowski, A.J. Phys. Chem. B2006,110, 13393.
(4) Nehl, C. L.; Liao, H. W.; Hafner, J. H.Nano Lett.2006,6, 683. (5) Elechinguerra, J. L.; Burt, J. L.; Morones, J. R.; Camacho, A.; Gao, X.; Lara, H.; Yacaman, M. J.J. Nanobiotech.2005,3, 6.
(6) Pileni, M. P.J. Phys. Chem. C2007,111, 9019–9038.
(7) Maillard, M.; Giorgio, S.; Pileni, M. P.J. Phys. Chem. B2003,
107, 2466.
(8) Sttaler, K.; Mu¨hlbach, J.; Recknagel, E.Phys. ReV. Lett.1980,45
(10), 821–824.
(9) Barker, S. H.; Thorton, S. C.; Keen, A. M.; Preston, T. I.; Norris, C.; Edmonds, K. W.; Binns, C.ReV. Sci. Instrum.1997,68, 1853–1857. (10) Goldby, I. M.; Von Issendorff, B.; Kuipers, L.; Palmer, R. E.ReV. Sci. Instrum.1997,68, 3327–3334.
(11) Pe´rez-Tijerina, E.; Gracia-Pinilla, M. A.; Mejı´a-Rosales, S.; Ortiz-Me´ndez, U.; Torres, A.; Jose´-Yacama´n, M.Faraday Discuss.2007,138, 353–362.
(12) Nose´, S.J. Chem. Phys.1984,81, 511.
(13) Mejı´a-Rosales, S. J.; Ferna´ndez-Navarro, C.; Pe´rez-Tijerina, E.; Blom, D. A.; Allard, L. F.; Jose´-Yacama´n, M.J. Phys. Chem. C2007,
111, 1256.
(14) Mejı´a-Rosales, S. J.; Ferna´ndez-Navarro, C.; Pe´rez-Tijerina, E.; Montejano-Carrizales, J. M.; Jose´-Yacama´n, M.J. Phys. Chem. B2006,
110, 12884.
(15) Shim, J.-H.; Lee, B.-J.; Choo, Y. W.Surf. Sci.2002,512, 262– 268.
(16) Chen, F.; Jhonston, R. L.ACS Nano2007,1, 165–175. (17) Baletto, F.; Ferrando, R.; Fortunelli, A.; Montalenti, F.; Mottet, C. J.Chem. Phys.2002,116, 3856.
(18) Baletto, F.; Ferrando, R.ReV. Mod. Phys.2005,77, 37. (19) Grochola, G.; Snook, I. K.; Russo, S. P. J., Chem. Phys.2007,
127, 224704.
(20) Mantis Deposition Ltd. Oxford, England. www.mantisdeposition. com.
(21) Shyjumon, I. Ph. D. thesis, University of Greifswald, 2005. (22) Haberland, H.; Insepov, Z.; Moseler, M.Phys ReVB1995,51(16), 11061–11067.
(23) Rattunde, O.; Moseler, M.; Ha¨feler, A.; Kraft, J.; Rieser, D.; Haberland, H.J. Appl. Phys.2001,90(7), 3226–3231.
(24) Meiwes-Broer, K.-H. Metal Clusters at Surfaces, structure, Quantum Properties, Physical Chemistry, Springer Series, ed 1999.
(25) Quadrupole mass spectrometer - QMS. Mantis Deposition Ltd. Version 1.1.
(26) XMD program developed by the group of Rifkin, at Center for Simulation, University of Connecticut, http://www.ims.uconn.edu/centers/ simul.
(27) R.A., Johnson.Phys. ReV. B1989,39, 12554–12559.
(28) Sosa, I. O.; Noguez, C.; Barrera, R. G.J. Phys. Chem. B2003,
107, 6269.
(29) Noguez, C.J. Phys. Chem. C2007,111, 3806.
(30) Steinhardt, P. J.; Nelson, D. R.; Rochetti, M.Phys. ReV. B1983,
28, 784.
(31) Chushak, Y. G.; Bartell, L. S.J. Phys. Chem. B2001,105, 11605. (32) Wolde, P. R. T.; Ruiz-Montero, M. J.; Frenkel, D.J. Chem. Phys. 1996,104, 9932.
(33) Rodrı´guez-Lopez, J. L.; Montejano-Canrrizales, J. M.; Pal, U.; Sa´nchez-Ramı´rez, J. F.; Troiani, H. E.; Garcı´a., D.; Miki-Yoshida, M.; Jose´-Yacama´n, M.Phys. ReV. Lett.2004,92, 196102.