Serie documentos de trabajo
Serie documentos de trabajo
THE REFORM OF THE MEXICAN NATURAL GAS MARKET: EFFECTS ON PRODUCTION AND DISTRIBUTION
Luis F. López Calva and Juan Rosellón
THE REFORM OF THE MEXICAN NATURAL GAS MARKET: EFFECTS ON PRODUCTION AND DISTRIBUTION.*
Luis F. López-Calva
El Colegio de México
and Juan Rosellón
Centro de Investigación y Docencia Económicas
October, 2000
Abstract
One of the main objectives of the reform of the natural gas sector in Mexico was to develop a formerly underdeveloped market of this product. This paper shows clear econometric evidence of structural change in the series of production of natural gas in Mexico after the reform period. When compared to the case of a complete deregulation of the sector, as in the case of Argentina, we can see the type of gains Mexico could have achieved through a more aggressive deregulation. The paper also discusses the concession contracts awarded for distribution of natural gas because of the overwhelming recent evidence of renegotiation of concession contracts around the world. Some potential room for renegotiation in the
future is discussed.
*
1. Introduction
The Mexican government recently deregulated its natural gas sector. This deregulation, however, differs from other reform programs in this sector due to specific political and legal constraints, as described below. It is important to assess the effect such reform has had on the evolution of the natural gas market after the reform because of the potential impact this might have on consumers´ welfare and the growth potential of the economy in the long run. The latter is the main theme of this study. The paper aims at analyzing the existing evidence and assessing the effects of the reform to the natural gas sector in Mexico in 1995. Also, it sheds some light on the challenges the regulator faces and potential problems to be solved. The main result is that the reform has been successful in terms of attracting investment at the distribution stage, expanding significantly production and creating the basis for a formerly almost non-existent gas market.
2.Background
In the Mexican energy sector, state companies had historically controlled energy activities: Petróleos Mexicanos (Pemex) in the oil sector, and Comisión Federal de Electricidad (CFE) and Luz y Fuerza del Centro (LFC) in the electricity industry. Some reforms to power generation were carried out in 1992 and a more ambitious reform in natural gas was achieved in 1995. Notwithstanding, reform decisions in terms of gas production, oil extraction, production of petrochemicals, and the structural reform of the complete electricity sector have been postponed.1
1
The reform to the natural gas sector of 1995 allowed for private investment in new transportation projects, and in distribution and marketing but kept the Pemex’ monopoly in production. The institutional reform created an independent regulatory body, the Energy Regulatory Commission (CRE), and issued newly designed bylaws, the Reglamento de Gas Natural Natural (Natural Gas Regulations).
Natural gas is one of the most important sources of energy these days because its use provides us with economic and technical advantages, in addition to the fact that it is environmentally friendlier than other sources of energy. After a period of intervention by the government in the energy sector, countries in Asia, Europe, and North and South America are introducing reforms to promote efficiency and attract investment to their natural gas industries.
The liberalization of this sector is complex since the natural gas market combines naturally monopolistic with potentially competitive activities. Pipeline transportation and distribution have natural monopoly characteristics and require regulation of price and non-price behavior. Production is a contestable market, even though in Mexico it was maintained as a state monopoly. Marketing of gas is also contestable but the regulator must make sure that there are no entry barriers to this activity. Market architecture decisions - such as degree of vertical integration, horizontal structure, and regional development – are also crucial.
A picture of the situation of natural gas consumption in Mexico is given by gas penetration rates in the energy matrix. Natural gas represents 25% of the total energy consumption in Mexico. In fact, this weight is similar to the US one (27%) but much smaller than in Argentina (53%). In 1999, Pemex was the main consumer using 42% of the available gas, while the remaining consumption was shared by industry (31%), electricity generation (22%) and residential and commercial customers (6%). This structure might be compared with the US one where natural gas used for oil production represents 8.9%, industrial purposes 40%, residential consumption 37.6%, and electricity generation 13.5 %.2 So one main difference between Mexico and the US is that natural gas is not much utilized in Mexico for residential consumption. LPG is used instead with a subsidized price and with a fairly good distribution in large cities.
After the Mexican economic crisis of the 80’s it became evident that some sectors, such as infrastructure, needed major reforms in order to foster economic growth. It was thus necessary to implement a structural reform program which was eventually carried out in several sectors and included a deregulation plan to eliminate artificial entry and exit barriers in contestable markets such as transport, ports and telecommunications. The reform included privatization of state-owned enterprises, including the telephone company, deregulation in potentially competitive sectors and, in 1995, the opening to private investment in the natural gas sector.3
3. Main aspects prior to the reform
Natural gas has some economic and technical advantages as a source of energy, but it is especially important because of its environmentally friendly properties. Estimates indicate that between 1998 and 2007, the share of natural gas in energy consumption will attain 58.1% for
2
thermal power generation, 70% for industrial use and 25% for distribution systems serving residential, commercial and municipal users.
Before 1995 PEMEX had the monopoly over production and transportation in natural gas. Even though PEMEX carried out a gross rationalization program cutting half of its excess labor force, it just did not invest in this “strategically unimportant” sector. At that time PEMEX itself functioned as an owner, operator and regulator.
Mexican fuel oil is the main natural gas substitute for industrial consumption. Since 1997 this source of energy has been cheaper than natural gas. The former is, however, very polluting due to its high sulfur content. Due to the enormous growth in demand for natural gas (9% per year in the next decade), important changes in industry structure, price, tariff regulation, and permits regime have been introduced in order to attract private investment in natural gas pipeline transportation distribution, storage and commercialization.4
In 1992 the first steps in energy sector reform took place when private investment was allowed in power generation. In October 1993 the Energy Regulatory Commission was created to regulate the electric sector only in auto-consumption, cogeneration, and independent power projects (IPP) which were forced to sell any generation surplus to the Federal Commission of Energy (CFE). Two years later, the reform of the natural gas market initiated with the opening to private participation in transportation, distribution and marketing projects. The liberalization of this market was especially complex since it combined natural monopoly as well as
potentially competitive activities. Production was protected as a monopoly, even though
3
A detailed discussion of the deregulation of the natural gas sector is Rosellón (1997). An interesting reference related to the privatization process is Rogozinski (1998).
4
competition is possible from a technical point of view. Gas transportation and distribution were left as natural monopolies and the marketing of gas was recognized as a contestable market.
To establish the general principles for developing the natural gas industry in 1995 the gas Law was amended. The Reglamento de Gas Natural became the regulatory framework that specified the organization, operation and regulations of the industry with a long-term
perspective. The most important market players in the sector are transporters, operators of storage facilities, distributors, marketers, consumers and PEMEX, which still participates as a state monopoly gas supplier due to political, historical and cultural reasons.
There are incentives for firms to invest because of the autonomous regulatory institution that implements the regulatory instruments, CRE. The Ministry of Energy (SE) became the head of the Nation’s energy resource policy, as before, while PEMEX was restricted in its activities and the CRE was separated from the SE.
4. Key policies in the Reglamento
In this section we analyze the main policies articulated in the Reglamento, namely: permit regime, vertical integration, international trade, marketing activities and open access. Permits are granted for thirty years and are renewable. In order to get one, parties have to present a technical project, and then market decides which project is carried out. Transportation, storage and distribution permits are issued in a different manner. This kind of regulatory instrument has been successful since it ensures more uniform technical and economic characteristic of the projects across the country, and therefore provides certainty to investors.
In the case of transportation, policy makers decided that access of parties to the
ensures competitive conditions in the provision of goods and services along natural gas industry. 21 distribution permits and 66 transportation permits have been granted to date with pipeline lengths of 28, 042 kilometers and 11, 478 respectively. Many of the tranportation permitsserve to supply gas to the new independent power production plants.
Due to the dominant role of PEMEX, the Reglamento permits some degree of vertical integration for other market participants. However the vertical integration between
transportation and distribution is not allowed unless transportation (distribution) permit is necessary for a distribution (transportation) project. In terms of international trade the
Reglamento established a measure that permits free imports of natural gas from the US without an import license or duties.
Regulation of domestic gas first-hand-sale price and distribution
It is well known that welfare increases as transportation and distribution networks are better designed, and as prices and tariffs are lower. After considering the main aspects of the Mexican natural gas sector and that the main goal was to maximize the social welfare, policy makers focused on the regulation of domestic gas price and development of distribution systems.
Policy makers confronted a serious problem when they decided how to regulate the price of the natural gas. After considering the international experience they chose among three well-analyzed alternatives to set the price according to the international benchmark. This benchmark is given by the regulated price of domestic price of domestic gas plus the regulated tariffs for transporting and storing gas. This instrument seems not to be very innovative because PEMEX used something similar before, but it has served to try to introduce competition into the
to be affected according to the externalities of the US market implying in some cases consumers’ bills increases. 5
After five years of the liberalization process, on February 2000, CRE finally issued the directive on first hand sales of natural gas. Since PEMEX vertical integration has been an obstacle to the introduction of competition into the market, the directive obligates PEMEX to present information of all the operations it is doing. It also has to offer the same price to power generators located in the north or south, this will allow power generators to compete in
technical and financial concerns. The directive assumption on first hand sales is that PEMEX will remain as a monopoly in gas marketing so it must be regulated, but regulation of
commercialization activities has proven to be difficult, therefore competitive evolution of the Mexican gas industry will not be easy to attain.
Economic entry barriers to the construction of a distribution network explain in a certain manner the natural monopolies that have characterized the distribution sector. However, regulators in Mexico considered very important the harmonic development of distribution systems.From international experience Mexico learned that the exclusivity period for a distributor plays a fundamental role because short periods do not allow the firms to recover investment costs so they are obligated to set high tariffs, but long periods are not necessary due to natural-market barriers. In Mexico they were many opinions about the optimal length of the exclusivity period. The decision was to grant an exclusivity period of 12 years in conjunction with the initial distribution bidding. But exclusivity only refers to gas conduction. Physical by-pass was to be gradually implemented and commercial by-pass was accepted immediately.
The international experience has shown that marketing activities are important in promoting competition through price arbitration. Mexico put in place this idea by permitting
marketers to buy gas, transport and sell it to distributors or to consumers directly connected to the transportation system gas within a franchise area. In order to get a franchise, parties have to present an economic and technical project, then CRE choose one of them and defines the distribution geographical zone and the consumer target that it has to covere by the end of the first five years. Since the first franchise granted to Mexicali, 21 distribution permits have been awarded. The distribution infrastructure that belonged to PEMEX and CFE in the distribution zones was privatized. Distributors have made investment commitments of around 1 billion dollars, therefore one can say that this regulation has been successful.
To protect captive consumers an acquisition-price regulation was chosen. This
methodology establishes the maximum price that can be passed through to the final user by the distributor resulting from costs of gas purchase, transportation, distribution and storage
services. Distributor is able to transfer the cost as long as it is less than or equal to a predetermined benchmark.
because it permits firms to maximize consumer surplus and at the same time recover its fixed costs.6
At this time it is not possible to make a deep comprehensive evaluation of the regulatory decisions because during the small period of time of the reform the CRE has onlybeen concerned with issuing permits, promoting distribution and transportation projects and incorporating PEMEX into the regulatory framework. One of its last task was to work on a arrangement with the National Institute of Ecology (INE) and the Water Commission (CAN) to simplify the process that LDC’s have to meet. For the same purpose federal and local
regulatory authorities are working to establish agreements of coordination with the states and municipalities.
Domestic production of natural gas increased by 33% from 1994 to 1998. Policy makers expected a supply growth rate of 4.5% from 1998 to 2007. Demand for natural gas was expected to grow at about 9% per year specially for electricity generation and because higher environmental standards are pushing firms to change fuel oil for natural gas. Comparing current production trends with expected consumption it is evident that a huge deficit willprevail in the near future. To diminish this deficit, it was recently announced in a “Gas Strategic Plan” that the government will increase its investment in natural gas production: PEMEX will invest around 12.5 billion US dollars in hydrocarbon extraction during the next fifteen years. This is difficult to believe because PEMEX’ has not historically shown efficiency in production in the gas sector, but also because PEMEX’ budget is determined by the Mexican Congress. To exploit its natural gas resources rather than increases the natural gas imports, Pemex should establish new arrangements for risk sharing with experienced private companies with associated changes in licensing, taxation and audit policies and practices.
Among the distribution companies that were granted permits, the results in terms of investment and prices are as expected. Some of these firms are actually publicly traded (see Table 1) and the performance of its shares in the market denote that the public has good expectations about the market, and perhaps more important, that the regulatory regime is credible.
Table 1
Distribution Companies that are Publicly Traded
Distribuidora de Gas Natural de Mexicali Proxima
Enova-San Diego Gas & Electric Pacific Enterprises
Compañía Mexicana de Gas (Piedras Negras)
DGN Chihuahua Próxima Gas
Enova Internacional- San Diego Gas & Electric (Actualmente Sempra Energy)
Pacific Enterprises- Southern California Gas.
Gas Natural México (Saltillo) Repsol
Gas Natural del Noroeste KN Energy Inc.
KN Energy International Grupo Marhnos.
Gas Natural de México (Toluca) Repsol
Compañía Mexicana de Gas (Monterrey) Grupo Diavaz
Enserch de México. Subsidiaria de National Pipeline Company (Enserch Corporation)
Gas Natural de México (Nuevo Laredo) Repsol
Gas Natural de Juárez
Gas Natural del Río Pánuco Corporación Gutsa
NorAm Energy de México.(Actualmente Reliant Energy)
Actualmente quien posee el permiso es Tractebel (Belgica)
Tamauligas Bufete industrial
Gaz de France
Gas Natural de México (Monterrey) Gas Natural SDG (Repsol)
Distribuidora de Gas Natural del Estado de México (D.F.)
Grupo Diavaz 15%
Lone Star Gas International (Enserch Cop.)70% Controladora Comercial e Industrial 15%
Consorcio Mexi-Gas (Valle Cuautitlán-Texcoco)
Grupo Bufete Industrial Construcciones 25% Gaz de France 26%
Mexigas 49%
Distribuidora de Gas de Querétaro Tractebel
Gas Natural de México (Bajío) Gas Natural SDG (Repsol)
DGN de la Laguna-Durango Sempra Energy International
(Cananea)
The market performance of the shares of Repsol, Sempra and San Diego gas & Electric is shown in graphs 1-3. As can be seen, the market performance is, on average, very good.
Graph 1
Market Performance: Sempra Sempra
0 20 40 60 80 100 120
29/06/98 29/07/98 29/08/98 29/09/98 29/10/98 29/11/98 29/12/98 29/01/99 28/02/99 29/03/99 29/04/99 29/05/99 29/06/99 29/07/99 29/08/99 29/09/99 29/10/99 29/11/99 29/12/99 29/01/00 29/02/00
Close Low High Open
Graph 2
Market Performance: San Diego San Diego
0 20 40 60 80 100 120 140 160
3/01/95 3/04/95 3/07/95 3/10/95 3/01/96 3/04/96 3/07/96 3/10/96 3/01/97 3/04/97 3/07/97 3/10/97 3/01/98 3/04/98 3/07/98 3/10/98 3/01/99 3/04/99 3/07/99 3/10/99 3/01/00
Graph 3
Market Performance: Repsol Repsol
0 20 40 60 80 100 120
3/01/95 3/04/95 3/07/95 3/10/95 3/01/96 3/04/96 3/07/96 3/10/96 3/01/97 3/04/97 3/07/97 3/10/97 3/01/98 3/04/98 3/07/98 3/10/98 3/01/99 3/04/99 3/07/99 3/10/99 3/01/00
Close Low High Open
Some of the relevant questions to be answered regarding the reform in the sector are: i) Has the reform resulted in a more dynamic natural gas market?
ii) What have been the incentives to increase production?
iii) Is there room for higher gains if the regime were changed in some stages of the chain?
iv) Is there room for renegotiation in the distribution contracts in detriment of consumers?
v) What is the connection between the reform in the natural gas sector and the success in other related sectors like electricity?
All these questions are addresses in the sections to follow.
This analysis uses monthly series for production and sales of natural gas in millions of cubic feet between January 1988 and March 1999.As can be seen in Graph 4, natural gas production showed an upward trend from 1988 to November 1995. The behavior is similar after that date, but the rate of growth seems to be steeper. Between 1988 and 1999 the average annual rate of growth was 0.25% while the rate of growth during the whole period was 31.18%.
Graph 4
Production and sales of Natural Gas in Mexico1988-1999
0 1,000 2,000 3,000 4,000 5,000 6,000
1988/Ene 1988/Jul 1989/Ene 1989/Jul 1990/Ene 1990/Jul 1991/Ene 1991/Jul 1992/Ene 1992/Jul 1993/Ene 1993/Jul 1994/Ene 1994/Jul 1995/Ene 1995/Jul 1996/Ene 1996/Jul 1997/Ene 1997/Jul 1998/Ene 1998/Jul 1999/Ene
Mill. Of cubic feet per day
Production Domestic Sales
Tests of structural change
Economic series are generally non-stationary. Thus, integration tests must be carried out. The Integration order of a series is the number of times it has to be differentiated to make it stationary. Regressions with non-stationary series could results in spurious relationships and that is why the Integration order of a series becomes important before any type of statistical analysis of time series
Table 1a
Unit Root Tests7
Variable Phillips Perron (4 lags)
(t statistic)
lprod 0.0118
∆lprod -16.2148
lcons 1.1295
∆lcons -17.6209
Note: Phillips-Perron test suggests four lags taking into account possible correlation. This results
does not include a trend nor a constant, however if we carry out the test with a trend or a constant the integration order does not change.
Table 1b
Dickey Fuller Test (levels)
Augmented Dickey-Fuller Test Equation (levels) Dependent Variable: D(LP)
Sample(adjusted): 1984:06 1999:03
Included observations: 178 after adjusting endpoints
Variable Coefficient Std. Error t-Statistic Prob.
LP(-1) 0.014582 0.018850 0.773560 0.4403
D(LP(-1)) -0.298892 0.079131 -3.777197 0.0002**
D(LP(-2)) -0.228403 0.081994 -2.785599 0.0059**
D(LP(-3)) -0.136428 0.081264 -1.678827 0.0950*
D(LP(-4)) -0.094608 0.077863 -1.215063 0.2260
C -0.117953 0.155098 -0.760504 0.4480
R-squared 0.093298 Mean dependent var 0.001180
Adjusted R-squared 0.066940 S.D. dependent var 0.024125
S.E. of regression 0.023304 Akaike info criterion -4.647289
Sum squared resid 0.093406 Schwarz criterion -4.540038
Log likelihood 419.6088 F-statistic 3.539681
Durbin-Watson stat 1.991680 Prob(F-statistic) 0.004517
ADF Test Statistic 0.773560 1% Critical Valuea -3.4682
5% Critical Value -2.8777
10% Critical Value -2.5753
* 90% level of significance
** 95% level of significance
a
MacKinnon critical values for rejection of hypothesis of a unit root.
7
Table 1b
Dickey Fuller Test (differences)
Augmented Dickey-Fuller Test Equation (differences) Dependent Variable: D(LP,2)
Sample(adjusted): 1984:07 1999:03
Included observations: 177 after adjusting endpoints
Variable Coefficient Std. Error t-Statistic Prob.
D(LP(-1)) -1.671141 0.235829 -7.086246 0.0000**
D(LP(-1),2) 0.384269 0.204823 1.876100 0.0623*
D(LP(-2),2) 0.169814 0.167486 1.013898 0.3121
D(LP(-3),2) 0.059732 0.123837 0.482342 0.6302
D(LP(-4),2) -0.013497 0.076574 -0.176258 0.8603
C 0.002231 0.001766 1.262824 0.2084
R-squared 0.633913 Mean dependent var 0.000186
Adjusted R-squared 0.623209 S.D. dependent var 0.037766
S.E. of regression 0.023182 Akaike info criterion -4.657551
Sum squared resid 0.091898 Schwarz criterion -4.549885
Log likelihood 418.1933 F-statistic 59.22037
Durbin-Watson stat 2.011638 Prob(F-statistic) 0.000000
ADF Test Statistic -7.086246 1% Critical Valuea -3.4684
5% Critical Value -2.8778
10% Critical Value -2.5754
* 90% level of significance ** 95% level of significance
a
MacKinnon critical values for rejection of hypothesis of a unit root
In Tables 1a and 1b we can see that t statistics of the unit root tests (ADF) and PP for lprod
Structural break tests are carried out as a next step. The main idea of the stability test in the parameters is that at any date in time T1 it is believed that a structural change has occurred.
There are several ways to carry out structural change tests. Before doing so, the specification of the time series process has to be done. In this case, after several specification tests we found that the process can be modeled as a ARIMA(10,1,1) process. The results are shown in Table 2.
Table 2 Modeling the Series
Dependent Variable: DLP
Sample(adjusted): 1984:12 1999:03
Included observations: 172 after adjusting endpoints Convergence achieved after 11 iterations
Backcast: 1984:11
Variable Coefficient Std. Error t-Statistic Prob. C 0.000378 0.001486 0.254621 0.7993 DE 0.005457 0.002925 1.865625
0.0638* AR(10) 0.172472 0.076048 2.267941
0.0246** MA(1) -0.381160 0.071814 -5.307589
0.0000** R-squared 0.140597 Mean
dependent var
0.001592 Adjusted
R-squared
0.125251 S.D. dependent var
0.024179 S.E. of regression 0.022614 Akaike info
criterion
-4.717533 Sum squared
resid
0.085912 Schwarz criterion
-4.644336 Log likelihood 409.7079 F-statistic 9.161548 Durbin-Watson
stat
1.851577 Prob(F-statistic) 0.000012 Inverted AR Roots .84
.68+.49i
.68 -.49i .26 -.80i .26+.80i .26
-.80i
-.26+.80i -.68+.49i -.68 -.49i -.84
Inverted MA Roots .38 * 90% level of significance
Thus, production of natural gas follows an ARIMA (10,1,1) process.8 However, the normality test shows unexpected results, which could be due to the structural change that seems to have occurred.
Natural gas sales follow an AR(2) process. The series also shows normality problems. The residuals of the models are stationary (See Table 3).
Table 3
Unit Root Tests
Variable
Augmented Dickey Fuller (four lags)
(t statistic)
Phillips Perron (four lags) (t statistic)
Residual production model -6.4007 -12.0085
Residual sales model -5.0673 -10.8330
One common structural break test is due to Chow. The structural break point proposed is November 1995. The idea is to prove the null hypothesis of non structural change. The main results are shown in Table 4.
Table 4
Natural Gas Production
Chow Forecast Test: Forecast from 1995:11 to 1999:03
F-statistic 2.425678 Probability 0.000239
Log likelihood
ratio
98.96503 Probability 0.000001
Gas Sales
Chow Forecast Test: Forecast from 1995:11 to 1999:03
F-statistic 0.437056* Probability 0.99802
Log likelihood
ratio
24.14935* Probability 0.983246
* Significant at a 99% level.
8
From these results it is possible to state that the natural gas production series shows a structural change in November 1995 but the gas sales series does not show such a change. The null hypothesis is rejected in the case of production but not in that of sales. In order to verify the robustness of this result is performing an alternative test of structural change. This is done by using a dummy variable after the reform period and checking for its “redundance”. The models are then modified and the results are shown in the following Tables:
Table 5a
Test of Redundance in the Model with a Constant Redundant Variables: DE
F-statistic 3.298747 Probability 0.071115 Log likelihood
ratio
3.344559 Probability 0.067428 Dependent Variable: DLP
Sample: 1984:12 1999:03 Included observations: 172
Convergence achieved after 11 iterations Backcast: 1984:11
Variable Coefficient Std. Error t-Statistic Prob. C 0.001748 0.001407 1.242722 0.2157 AR(10) 0.201679 0.074592 2.703770
0.0076** MA(1) -0.355878 0.072084 -4.937014 0.0000** R-squared 0.123723 Mean dependent
var
0.001592 Adjusted
R-squared
0.113353 S.D. dependent var
0.024179 S.E. of
regression
0.022767 Akaike info criterion
-4.709716 Sum squared
resid
0.087599 Schwarz criterion -4.654818 Log likelihood 408.0356 F-statistic 11.93067 Durbin Watson 1.871145 Prob (F-statistic) 0.000014 Inverted AR
Roots
.85 .69+.50i .69 .50i .26 -.81i .26+.81i -.26 -.81i .26+.81i
-.69 -.50i -.85 Inverted MA
Roots
.36
Table 5b
Redundance Test without a Constant Redundant Variables: DE
F-statistic 4.761321 Probability 0.030487 Log likelihood
ratio
4.778835 Probability 0.028812 Dependent Variable: DLP
Sample: 1984:12 1999:03 Included observations: 172
Convergence achieved after 10 iterations Backcast: 1984:11
Variable Coefficient Std. Error t-Statistic Prob. AR(10) 0.210309 0.074508 2.822647 0.0053**
MA(1) -0.334959 0.072407 -4.626081 0.0000** R-squared 0.116048 Mean dependent
var
0.001592 Adjusted
R-squared
0.110849 S.D. dependent var
0.024179 S.E. of
regression
0.022799 Akaike info criterion
-4.712624 Sum squared
resid
0.088366 Schwarz criterion -4.676025 Log likelihood 407.2857 Durbin-Watson
stat
1.888135 Inverted AR
Roots
.86 .69+.50i .69 .50i .26 -.81i .26+.81i -.26 -.81i .26+.81i
-.69+.50i -.69 -.50i -.86
Inverted MA Roots
.33
** 95% level of significance
is that the demand for natural gas was already growing at high rate and the structural change in production was needed just to match the demand dynamics.
Even though the increase in production shows a positive effect of the reform on the market, a new question that arises is whether the change could be larger if a complete liberalization, without monopoly in production had taken place. In order to pursue such investigation, an imperfect, though useful, method shall be used: the same tests are carried out for a case in which the liberalization was complete, as in the case of Argentina. Proving that the Argentinean market had a larger response could indicate that the reform in Mexico was indeed limited by the historical constraints on the production side. This is so especially because the natural gas market in Argentina was more developed than its counterpart in Mexico even before the reform, so it cannot be argued that a smaller response in Mexico was due to a smaller deficit at the moment of the policy change.
6. Full Liberalization: Argentina
Graph 5
Total
0 2000000 4000000 6000000 8000000 10000000 12000000
1982 1983 1984 1985 1986 1987 1988 1989 1990 1991 1992 1993 1994 1995 1996 1997 1998 1999
Year
Total
Structural Change
We proved the integration order of the series using Augmented Dickey Fuller (ADF) and Phillips-Perron (PP) tests. As we can see in Table 6 this series has an integration order of one,
I(1). This result is taken from the statistical values of the t-test, ADF and PP.
Table 6
Unit Root Test9
Variable
Augmented Dickey Fuller (2)
(t-statistic)
Phillips Perron (2) (t-statistic)
Largen 1.7817 1.4699
∆largen -3.3653 -4.6284
Note: Phillips Perron taste suggests two lags taking into account possible manifestations of
correlation. This results does not include a trend or a constant, but when they are included the integration order does not change.
9
The best model that fits the series is as follows:10
largent = 1.0043 largent-1 +0.9346 MA(2)
(944.41) (-23.507)
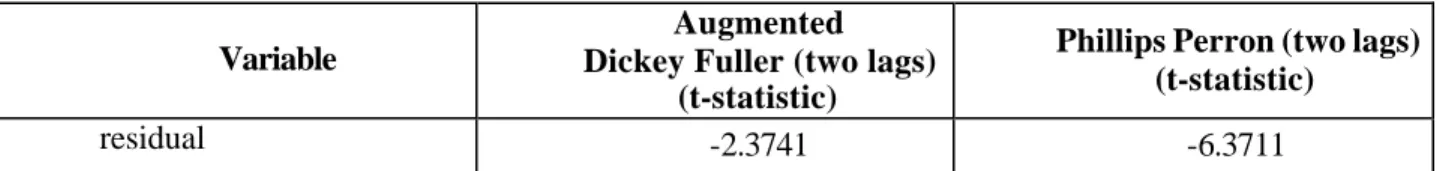
This series follows an ARIMA process (1,2,1).11 The residuals of this model have constant mean and variance, so they are stationary. ADF and PP tests are presented in the next table.
10
Numbers in brackets are t-test values
11
Table 7
Unit Root Tests
Variable
Augmented Dickey Fuller (two lags)
(t-statistic)
Phillips Perron (two lags) (t-statistic)
residual -2.3741 -6.3711
Note: Phillips Perron taste suggests two lags taking into account possible manifestations of
correlation. These results do not include a trend or a constant, but when they are included the integration order does not change.
The year 1992, i.e., the year of the reform, is taken as a potential structural break. The idea is again to prove the null hypothesis of no-structural change. The results are shown in Table 8.
Table 8 Chow Test
Argentina
Chow Forecast Test: Forecast from 1992 to 1999 F-statistic 0.744797 Probability 0.657808 Log likelihood
ratio
10.46914 Probability 0.733629
From these results we can conclude that the null hypothesis is rejected, so there was a structural change in production in 1992. We now follow the dummy procedure to check the robustness of the result. The model becomes:
largent = 1.0068 largent-1 -0.9367 MA(2) - 0.06622 dummy
(406.32) (-22.8006) (-2.1320)
From this analysis we conclude that the series does show a structural change in 1992.
discussed in Rosellón and Halpern (2000), some regulatory problems still persist and may explain efficiency losses. These are related to PEMEX´s virtual vertical integration and the incentives it sometimes has to reduce production and to congest the transport pipelines. Brito and Rosellón (2000) propose that PEMEX should not be allowed to commercialize, and that such measures would result in higher efficiency gains in the natural gas market.
7. The importance of Natural Gas for the Development of the Electricity Markets
One of the key factors in the development of the natural gas sector is its importance in the development of another crucial energy market: electricity. As an example, in Argentina the use of the combined cycle technology –natural gas-based – after the reform has gained importance as a source of energy. In graph 6 we can see that in Argentina the combined cycle technology has gone from being almost unimportant as a source of electricity generation to representing around 20% of total installed capacity. This figure can tell us the relevance of a well-functioning natural gas market as a pre-condition for a competitive electricity market.
Graph 6 Argentina
Sources of Energy as Percentage of Total Capacity
0 10 20 30 40 50 60
1992 1993 1994 1995 1996 1997 1998 1999 2000
Year
% of Total
Turbina de Vapor
Turbina de Gas Motores Diesel
Ciclo Combinado Turbina Hidraúlica
Among the reasons for the importance of the combined cycle technology in electricity generation is its relatively low cost and its environmentally friendly characteristics. Table 9 below shows the ranking of different technologies in electricity generation by components. The data are for generation plants in Mexico, as reported in 1997. Combined cycle plants were ranked as the cheapest.
Finally, when one looks at the composition of the generation capacity, 59% of the total is carried out from hydrocarbons. Out of that 59%, only 12% comes from combined cycle technologies (see Graph 7). There seems to be indeed a large potential for the development of this generation technology with its implicit cost reductions and environmental benefits. A well-functioning natural gas market, however, is a pre-condition for such a change.
Graph 7
Effective Capacity, Hydrocarbons 1999
66% 10%
12%
11% 1%
Table 9
Total Costs of Generation and Ranking
(1 = Cheapest)
(Average Prices 1997)
Ranking Plant Power Investment Fuel Maintenance Total
P $/MW
H
P $/MWH P $/MWH Indice $/MW
H
1 Combined Cycle 1*532 1 49.06 14 135.53 7 16.6 57 201.19
2 Combined Cycle 1*268 2 58.17 15 136.39 8 24.38 62 218.94
3 Carbon 2*350 6 150.92 11 85.92 10 26.30 74 263.14
4 C. dual with sulfur 2*350 7 151.85 12 93.52 11 26.94 79 281.67
5 C. dual without sulfur 2*350 11 186.57 13 102.88 17 43.92 91 324.01
6 La Amistad 2*33 15 272.41 8 9.94 18 44.99 92 327.34
7 Chicoasen 5*300 17 329.51 3 3.20 1 8.76 96 341.47
8 Thermal 2*350 3 103.31 23 236.34 5 14.93 100 354.58
9 Bacurato 2*46 18 335.82 5 5.41 13 31.55 105 372.78
10 Penitas 4*105 19 348.24 9 17.11 3 12.44 107 377.79
11 Comedero 2*50 20 368.79 7 7.03 14 31.80 115 407.62
12 Termal 2 2*160 4 138.68 24 244.95 9 25.33 115 408.96
13 Diesel 2*38.6 9 178.56 16 169.85 22 63.26 116 411.57
14 Geotermoeléctrica 1*25 12 196.86 18 182.75 19 45.90 120 425.51
15 Diesel 5*5.65 5 151.19 20 192.80 27 122.02 131 466.01
16 Nuclear 1*135
6
16 318.26 10 68.17 23 85.98 133 472.41
17 Termal 3 2*84 8 157.39 25 283.40 15 32.63 134 473.42
18 Diesel 2*13.5 13 208.67 17 179.76 24 92.01 135 480.44
19 Turbogas 1*175 14 257.89 21 205.95 21 63.35 140 498.03
20 Agua Milpa 3*120 23 496.30 4 4.33 4 14.17 145 514.80
21 Caracol 3*200 22 494.76 6 6.17 6 15.81 146 516.74
22 Termal 4 2*37.5 10 186.48 26 302.53 20 62.40 156 551.41
23 Zimapan 2*146 26 645.40 2 0.99 2 10.26 185 656.65
24 Turbogas 2 1*70 21 400.79 22 223.51 21 63.35 194 687.65
25 Agua Prieta 2*120 27 683.31 1 1.16 12 28.55 201 713.02
26 Turbogas 3 1*141 24 506.51 19 192.18 25 107.34 227 806.03
27 Turbogas 4 1*41 25 519.17 27 349.33 26 118.08 278 986.58
Source: CFE
8. Distribution Concessions and the Potential Room for Renegotiation
selection bias given that we only observe the maximum income in the bid for those who are the winners.12 Our interest is to assess whether there is a systematic component in the bidding process to draw some policy recommendations. First, before looking at the regression results, we see a simple negative correlation before the maximum income (lowest bid) offered by the winner company and the number of firms competing in the bidding process. This is consistent with the theory and tells us that the more competitive the bidding process, the lower the maximum income offered and thus the higher the benefits for the consumers (see Graph 8). The regression analysis is useful, however, to verify these results.
The specification of the model is:
Price = a0 emp + a1 inver + a2 usua + a3 partic + u
Where
Price = maximum income bid of the winner,
emp = number of firms in the bidding process
inver = required investment by the 5th. year
usua = number of consumers by the 5th. year
partic = a dummy variable, 1 if the winner has public participation in its home country
u = error term with usual properties
12
Graph 8
Maximum Income in Bids and Number of Competitors
0 0.5 1 1.5 2 2.5 3 3.5 4 4.5
0 1 2 3 4 5 6 7
Number of Firms
Maximum Income
Precio
The econometric results show that the most important variable is systematically the number of potential users by the 5th year (Tables 10-11). The coefficient is always positive and significant, which is related to the fact that the firms incur higher costs by having to supply a larger number of residential consumers.
Table 10
Econometric Analysis of the Bidding Process
Dependent Variable: PRICE Sample: 1 15
Included observations: 15
Variable Coefficient Std. Error t-Statistic Prob. FIRMS -0.399284 0.192149 -2.057132 0.0318
C 2.170767 0.768596 2.824328 0.0143 R-squared 0.076419 Mean
dependent v.
1.426774 Adjusted
R-squared
0.005374 S.D. dependent var
1.071573 S.E. of regression 1.068689 Akaike info
criterion
Sum squared resid
14.84726 Schwarz criterion
3.188715 Log likelihood -21.20732 F-statistic 2.075643 Durbin-Watson
stat
1.948736 Prob(F-statistic) 0.031858
Table 11
Dependent Variable: PRICE Sample: 1 15
Included observations: 15
Variable Coefficient Std. Error t-Statistic Prob. PART -0.125745 0.087302 -1.544033
0.1381** FIRMS -0.206572 0.202826 -1.018467
0.3303 USERS 3.20E-06 1.56E-06 2.054907
0.0644* C 1.774362 0.749200 2.368343
0.0373 R-squared 0.353678 Mean
dependent var
1.426774 Adjusted
R-squared
0.177409 S.D. dependent var
1.071573 S.E. of regression 0.971882 Akaike info
criterion
3.004014 Sum squared
resid
10.39010 Schwarz criterion
3.192827 Log likelihood -18.53010 F-statistic 2.006465 Durbin-Watson
stat
1.702842 Prob(F-statistic) 0.171542
*95% Significance ** 85% Significance
the fact that the winner has public ownership in its home country affects negatively the
maximum income required by the firms.13 This means that those firms are systematically able to offer lower bids. A warning should be made in this respect in the sense that those firms might potentially be more likely to renegotiate, unless they have subsidies in their home countries that allow them to bid sustain lower prices or have more technical capabilities than the rest. The former is more likely to be the case. Guasch (1999) has shown the incidence of renegotiation in concession contracts around the world, showing the common aspects of concession contracts that are renegotiated around the world. We propose hereby that the fact that firms have public
ownership in their home countries should be taken into account in such analysis.14
Final Remarks
The structural Reform in Mexico´s gas industry has been successful in inducing a
significant increase in production as a response to demand. The regulator has faced important challenges in terms of choosing the right institutional framework and incentives in an
environment of asymmetric information and short history of a regulatory culture in the country. The econometric evidence, however, clearly shows the structural change in production induced from 1995, when the reform took place. All the challenges ahead notwithstanding, the route chosen seems to be strengthening the development of a natural gas market in Mexico. The comparison with a completely liberalized market –Argentina—has shown that there might still be room for gains in Mexico. The lower response of production as compared to the full-liberalization scenario could be interpreted as the price to be paid for maintaining a
13
Firms with public ownership are from France (Gaz de France), and Spain (Repsol).
14
Appendix 1 Correlation Tests Production Series Breusch-Godfrey Serial Correlation LM Test:
F-statistic 3.211753 Probability 0.042802
Obs*R-squared
6.407526 Probability 0.040609 Dependent Variable: RESID
Presample missing value lagged residuals set to zero
Variable Coefficient Std. Error t-Statistic Prob. C 1.93E-05 0.001465 0.013163 0.9895 DE 0.000249 0.002886 0.086173 0.9314 AR(10) -0.001698 0.075130 -0.022604 0.9820 MA(1) -0.655171 0.493501 -1.327597 0.1861 RESID(-1) 0.718741 0.485930 1.479104 0.1410 RESID(-2) 0.100434 0.203427 0.493711 0.6222 R-squared 0.037253 Mean
dependent var
-2.47E-05 Adjusted
R-squared
0.008255 S.D. dependent var
0.022415 S.E. of regression 0.022322 Akaike info
criterion
-4.732243 Sum squared
resid
0.082712 Schwarz criterion
-4.622447 Log likelihood 412.9729 F-statistic 1.284659 Durbin-Watson
stat
References
Armstrong, M., S. Cowan, and J. Vickers, 1994, Regulatory Reform: An Economic Analysis and The Brittish Experience, Cambridge, MIT Press.
Brito, D.L., and J. Rosellón, 1999, “Regulating Gas Marketing Activities in Mexico,” CIDE Working Paper, E-165.
Brito, D., W.L. Littlejohn, and J. Rosellón, 2000, “Pricing Liquid Petroleum Gas in Mexico,”
Southern Economic Journal 66, January.
Brito, D. L., and J. Rosellón, 2000, “Pricing Natural Gas”, under revision in Energy Journal. Green, W., 1998, Econometric Analysis, McMillan.
López-Calva, L.F., 1998, "On Privatization Methods", HIID Development Discussion Paper No. 665, Central America Project Series, Harvard University.
López-Sandoval, Ignacio, 1999, “Análisis de las Elasticidades de Demanda Ante el Cambio Estructural de la Industria del Gas en México,” Master´s Thesis, CIDE.
Maddala, G. S. And I. M. Kim (1998), Unit Roots, Cointegration, and Structural Change, Cambridge University Press.
Ramírez, J. C., y J. Rosellón (2000), "La Regulación de las Tarifas de Distribución del Gas Natural en México: Un Modelo Estocástico", El Trimestre Económico, Vol. LXVII (2), No. 266, abril-junio.
Rao, B. (ed.), 1994, Cointegration for Applied Economists, St. Martin´s Press. Rogozinski, J. (1998); High Price for Change: Privatization in Mexico, Inter-American Development Bank.
Rosellón, J. and J. Halpern, 2000, “Regulatory Reform in Mexico´s Natural Gas Industry: Liberalization in the Context of a Dominant Upstream Incumbent,” Policy Research Working Paper Series, The World Bank.
Sheshinski, E. and L.F. López-Calva, 1999, “Privatization and Its Benefits: Theory and Evidence,” CAER II Discussion Paper No. 35, Harvard Institute for International Development, Harvard University.