Defect characterization of UMG mc-Si solar cells using LBIC and
luminescence imaging techniques
L.A. Sánchez1, A. Moretón1, M. Guada1, S. Rodríguez-Conde1, O. Martínez1 and J. Jiménez1
1
GdS-Optronlab, Dpto. Física de la Materia Condensada, Universidad de Valladolid, Edificio LUCIA, Paseo de Belén 19, 47011 Valladolid, Spain.
ABSTRACT
Upgraded metallurgical-grade silicon (UMG Si) solar cells with different ranges of efficiencies were characterized through electroluminescence imaging (ELi) and light-beam induced current (LBIC) measurements. The results showed a good correlation between the EL intensity and the efficiency of the solar cells. ELi images gave a bright contrast at the defects, grain boundaries and intragrain defects, and dark contrast inside the grain bodies. Metallic impurities are much more present in some cells due to the directional solidification of the Si ingot. Local short-circuit current mapping with LBIC measurements revealed a bright zone in the neighborhoods of the defects due to the depletion of impurities. Internal quantum efficiencies (IQE) and effective diffusion lengths (Leff) were calculated using different excitation wavelengths. High resolution LBIC measurements revealed micrometric clusters of impurities around intragrain defects.
INTRODUCTION
Photovoltaic (PV) industry is currently dominated by multicrystalline silicon (mc-Si) due to its cost-efficiency ratio. The traditional purification method of metallurgical grade silicon is called Siemens process. This process uses chemical vapor deposition (CVD) to obtain high-quality solar-grade Silicon (SoG-Si) but it results to a be a very energy-intensive mechanism [1]. SoG-Si produced through metallurgical purification processes is called upgraded metallurgical-grade silicon (UMG Si), and it appears as an alternative method to Siemens process due to reduced production cost and time. Directional solidification is one of the steps of this method, exploiting the small segregation coefficient of many impurities between the solid and liquid silicon [2]. Most of the impurities removed by this solidification process are metals, therefore elements like boron (B) and phosphorus (P) need to be removed by other processes. These impurities act like shallow acceptors and donors and reduce the minority carrier diffusion length. UMG Si is not the main material in PV industry; however, efficiencies of 20% have been achieved [3], which makes this material an attractive field of research for the future PV market.
In this study, UMG Si solar cells with different efficiencies (15.8% - 18.4%) were characterized at macroscopic and microscopic scales through ELi and LBIC measurements.
EXPERIMENTAL DETAILS
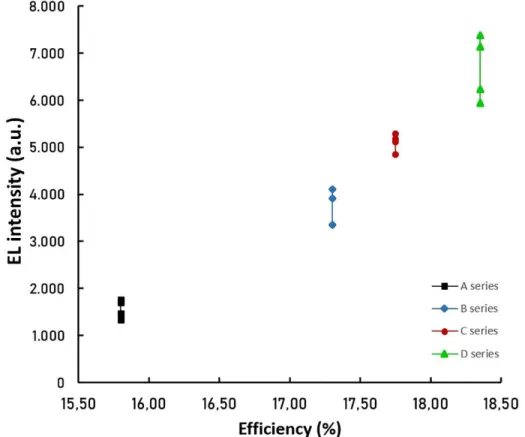
UMG Si solar cells used in this study were classified into four series as a function of their efficiencies and maximum power input: A series (15.8%, 3.85 W), B series (17.3%, 4.19 W), C series (17.75%, 4.31 W) and D series (18.4%, 4.46 W). The cells of each series were produced with wafers cut from the same parts of the bricks. ELi was carried out in all series biasing the solar cells with a constant intensity current of 1.35 A. The electroluminescence emission of the cells was captured in a dark environment with a 640 x 512 pixels 14-bit InGaAs camera (Hamamatsu C12741-03) and a 12.5 mm focal length objective. The exposure time used for all the cells was 300 ms.
LBIC measurements were performed on some of the solar cells belonging to each series. The homemade LBIC system contains two lasers (Omicron) with excitation wavelengths of 853 and 975 nm to achieve different penetration depths. The output powers were 10 mW for the 853 nm laser and 20 mW for the 975 nm laser. The laser beam is directed into a trinocular microscope which focuses it onto the surface of the cell. Different magnification objectives (20x, 100x) were used in order to achieve different spatial resolutions. A Si-CCD camera coupled to the top ocular is used to collect the reflected light by the surface. The scanning of the sample is achieved with a x-y-z motorized translation stage (Prior Scientific) over areas as large as 76.7 x 144 mm2
and step sizes as small as 1 µm. All the LBIC maps presented here contain 200 x 200 points. The photocurrent is collected by a multimeter (Keithley Instruments). Hardware control and data acquisition were developed in LabVIEW.
RESULTS AND DISCUSSION
Electroluminescence imaging (ELi)
Figures 1a—c show the EL images obtained in three solar cells from A, B and C series. The evolution in the grain distribution along the ingot can be observed in these images. At a glance it can be established an agreement between the efficiencies and the amount of dark areas. The A and B series cells present many dark contrasted areas covering most of the grains whereas the C series cell does not.
Surprisingly, the grain boundaries and defects present bright contrast, instead of the expected trapping activity. In order to discard this bright contrast and the dark areas as a consequence of leakage currents through the GBs, photoluminescence emission (PL) images were also acquired using three 20 W 808 nm laser diodes as sources of excitation. The results were similar to ELi, therefore the bright contrast of the boundaries and defects cannot be associated with leakage currents, but with the distribution of the impurities. Solar cells presenting more impurities than others belong to upper sections of the ingot due to the directional solidification process [8].
Figure 2 shows the EL intensity as a function of the efficiency for all the four series of solar cells. The EL intensity is calculated as the sum of all the values of the pixels of each EL image. A nearly linear correlation between the EL intensity and the cell efficiency can be appreciated.
Figure 2. Dependence between the EL intensity of the images taken and the efficiency of the four series of solar cells. Almost linear correlation can be established between EL intensity and efficiency.
Light-beam induced current (LBIC)
The LBIC measurements were carried out over the square regions indicated in Figures 1a—c with a 20x objective. The 1.8 x 1.8 cm2 short-circuit current maps obtained with the 853 nm laser are shown in Figures
in which the concentration of impurities is significantly higher as seen by the dark grain bodies as compared to cells B and especially cells C. This evidences an impurity concentration gradient from A cells to C ones.
Figure 3. (a—c) LBIC maps of the square regions indicated in Fig. 1a—c, obtained with an 853 nm laser (1.8 x 1.8 cm2, 20x objective, step size 90 µm).
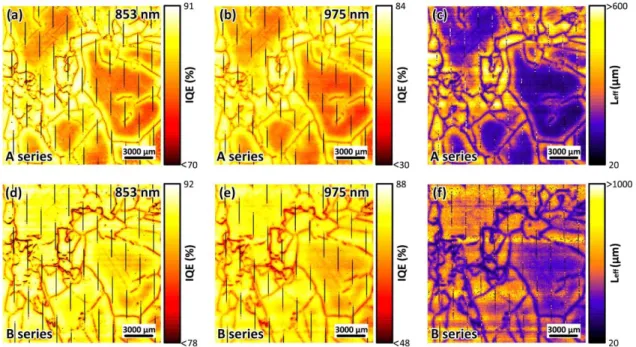
In figures 4a—b and 4d—e the internal quantum efficiencies (IQE) of the regions studied by LBIC in A and B-series solar cells for 853 and 975 nm are shown. The IQE contrast between defective and non-defective areas increases with the wavelength and decreases with the efficiency, as it can be seen in the ranges of the scale. Figures 4c and 4f show the effective diffusion lengths (Leff) of these areas calculated from [9,10]:
1
𝐼𝑄𝐸(𝜆)
≈ 1 +
1
𝛼(𝜆)𝐿𝑒𝑓𝑓
(1)
where α(λ) is the Si absorption coefficient at 300 K for the excitation wavelength (534 cm-1 for 853 nm and
106 cm-1 for 975 nm).
High resolution LBIC measurements were carried out using a 100x objective with 0.95 numerical aperture (NA). Figures 5a—b show the A series solar cell 600 x 600 µm2 LBIC maps from the square areas drawn in
figure 3a. Figure 5a corresponds to intragrain defects inside the left square in figure 3a, while figure 5b corresponds to the GB inside the right square. The highlighted points in blue in figure 5b correspond to isolated Figure 4. (a—c) IQE and Leff maps of the A series solar cell obtained with 853 nm and 975 nm lasers. (d—f) Same
spots around these intragrain defects where the generated photocurrent was relatively low. These points can be associated with metallic clusters without optical and electrical activity, as deduced from the absence of any contrast gradient around them [11]. This effect was mainly observed in intragrain defects, but it was not seen at the GBs. This is a characteristic of feedstock with low purification as UMG Si.
Figure 5. High resolution LBIC maps of the A series solar cell obtained with an excitation wavelength of 853 nm (600x600 µm2, 100x objective, step size 3 µm). (a) Intragrain defect. Highlighted points correspond to isolated spots with relatively high electrical activity. (b) GB.
CONCLUSION
UMG Si solar cells with different efficiencies have been characterized through ELi and LBIC techniques. A full wafer study of the cells with ELi revealed areas with high electrical activity associated to impurities. A very good agreement between the efficiencies and the EL intensity signal over the full cell was established. The high spatial resolution LBIC maps revealed the electrical activity of the GBs and intragrain defects, showing dark contrast at the defects and leaving an impurity depleted area around both GBs, and intragrain defects. This photocurrent distribution is associated with the impurity concentration; in the cells with lower impurity concentration the role of the GBs changes, and they are not always revealed in the LBIC maps. IQE and Leff maps
were calculated using LBIC maps obtained with two different excitation wavelengths. Some defective areas were studied with high spatial resolution LBIC ( 1μm) revealing tiny dark spots, probably related to impurity clusters precipitated in impurity rich regions, preferentially around intragrain defects. These defects are characteristic of low feedstock purification.
ACKNOWLEDGMENTS
This work was supported by the Spanish MINECO project, ref. ENE2014-56069-C4-4-R and “Junta de Castilla y León (Spain)” project number VA081U16. We wish to thank Silicio Ferrosolar for providing the samples studied in this work.
REFERENCES
1. J.O. Odden, H. Halvorsen, H. Rong and R. Gløckner in Silicon for the Chemical and Solar Industry IX (Oslo, Norway, 2008) pp. 75-90.
2. J. Safarian, G. Tranell and M. Tangstad, Energy Procedia 20, 88-97 (2012).
4. T. Trupke, B. Mitchell, J. W. Weber, W. McMillan, R. A. Bardos and R. Kroeze, Energy Procedia 15, 135-146 (2012).
5. M. Bliss, X. Wu, K. Bedrich, T. Betts and R. Gottschalg, IET Ren. Pow. Gener. 9, 446–452 (2014).
6. B. Moralejo, M. A. González, J. Jiménez, V. Parra, O. Martínez, J. Gutiérrez and O. Charro, J. Electron. Mater. 39, 663–670 (2010).
7. M.K. Juhl, M.D. Abbott, T. Trupke, IEEE J. Photovolt. 7, 1074–1080 (2017).