1
A STUDY OF PHOTOSYNTHETIC BIOGAS UPGRADING BASED ON A HIGH 1
RATE ALGAL POND UNDER ALKALINE CONDITIONS 2
3
Mariana Franco-Morgado1, Cynthia Alcántara2, Adalberto Noyola1, Raúl Muñoz2, 4
Armando González Sánchez1* 5
1. Instituto de Ingeniería, Universidad Nacional Autónoma de México, Circuito Escolar, 6
Ciudad Universitaria, 04510 Mexico City, Mexico 7
2. Department of Chemical Engineering and Environmental Technology, University of 8
Valladolid, C/Dr. Mergelina s/n, 47011 Valladolid, Spain 9
*Corresponding author: agonzalezs@iingen.unam.mx 10
11
ABSTRACT 12
Microalgal-bacterial processes have emerged as environmental friendly systems for the 13
cost-effective treatment of anaerobic effluents such as biogas and nutrients-laden 14
digestates. Environmental parameters such as temperature, irradiation, nutrient 15
concentration and pH effect the performance of the systems. In this paper, the potential of a 16
microalgal-bacterial photobioreactor operated under high pH (≈9.5) and high alkalinity to 17
convert biogas into biomethane was evaluated. The influence of the illumination regime 18
(continuous light supply vs 12 h/12 h light/dark cycles) on the synthetic biogas upgrading 19
efficiency, biomass productivity and nutrient removal efficiency was assessed in a High-20
Rate Algal Pond interconnected to a biogas absorption bubble column. No significant 21
differences in the removal efficiency of CO2 and H2S (91.5 ± 2 % and 99.5% ± 0.5,
22
respectively) were recorded regardless of the illumination regime. The high fluctuations of 23
the dissolved oxygen concentration during operation under light/dark cycles allowed to 24
evaluate the specific growth rate and the specific partial degradation rate of the microalgae 25
biomass by photosynthesis and respiration, respectively. The respiration reduced the net 26
microalgae biomass productivity under light/dark cycles compared with process operation 27
under the continuous light supply. 28
Keywords: alkaliphilic algal-bacterial consortium, biogas desulfurization, illumination 29
regime 30
*Manuscript
2 INTRODUCTION
31
Biogas and digestate are the main byproducts from anaerobic digestion of organic waste. 32
The composition of raw biogas varies depending on the type of residue and conditions of 33
anaerobic digestion. A typical raw biogas composition accounts for CH4 40-70% vol, CO2
34
15-60% vol, H2S 0.005-2% vol, and trace contaminants like water, siloxanes and volatile
35
organic compounds (Muñoz et al., 2015) . Raw biogas can be used directly to generate heat 36
and/or power or injected into natural gas grids when its quality is comparable with that of 37
natural gas. The high content of CO2 in raw biogas reduces its specific heating value and
38
increases its transportation costs. Another undesirable biogas component is H2S, which is a
39
highly corrosive, toxic and malodorous gas (Noyola et al., 2006; Redondo et al., 2008). On 40
the other hand, anaerobic digestates are characterized by a high concentration of nutrients, 41
such as nitrogen (950 mg N-NH4 L-1) and phosphorus (415 mg P-PO43- L-1) which are
42
representative values from anaerobic sludge digestion made in municipal wastewater 43
treatment plants (Uggetti et al., 2014). These aqueous effluents must be treated to avoid 44
eutrophication of inland waterbodies and coastal areas (Batten et al., 2013). In this context, 45
there is crucial need to develop cost-effective and environmentally friendly technologies for 46
biogas upgrading and nutrient removal, based on both the versatile potential of biogas as a 47
renewable energy source and the high eutrophication impact of digestates. 48
Algal-bacterial processes have emerged as the only technology capable of simultaneously 49
upgrading biogas while recovering nutrients from digestates (Muñoz and Guieysse, 2006) . 50
On one hand, microalgae can photosynthetically use the CO2 present in the biogas as a
51
carbon source while supporting the bacterial oxidation of H2S via an in-situ O2 supply
52
- ,. 2008; de Godos et al., 2009; Bahr et al., 2014; Posadas et al., 53
3
microalgae and bacteria growth represents an opportunity to mitigate its eutrophication 55
potential (Batten et al., 2013; Franchino et al., 2013; Uggetti et al., 2014). Despite the 56
promising results obtained so far using algal-bacterial photobioreactors, biogas 57
bioconversion to biomethane is still limited by the low CO2 mass transfer rates of this
58
technology (Yan et al., 2016). For instance, CO2 removals ranging from 55 to 62 % were
59
recorded by Alcántara et al., (2015) and Lebrero et al., (2016) using High Rate Algal Pond 60
(HRAP) or bubble column algal-bacterial photobioreactors, which hindered the direct 61
injection of the upgraded biogas into natural gas grids. 62
In this context, pH has been identified as a critical parameter determining the mass transfer 63
rate of acidic gases such as H2S and CO2 in conventional gas-liquid contactors
64
- ., 2008). Process operation at pH>9 mediate an enhancement 65
in the absorption rates of these biogas contaminants induced by chemical reactions 66
(González-Sánchez and Revah, 2007; Markou et al., 2014). The use of carbonated alkaline 67
cultivation media in algal-bacterial photobioreactors could support a long term efficient 68
biogas upgrading. In these systems, medium acidification induced by CO2 and H2S
69
absorption is counterbalanced by microalgae CO2 uptake in the presence of light and CO2
70
stripping under dark conditions. In addition, the use of extreme pH values promotes the 71
stability of microalgae populations by preventing contamination with predators or other 72
photosynthetic microorganisms (Lee, 2001). Despite the above mentioned advantages, the 73
understanding of biogas upgrading using alkaliphilic algal-bacterial consortia is very 74
limited. 75
This work aimed at evaluating the performance of a novel alkaliphilic microalgae-based 76
4
illumination regimes, assessing both the fate of carbon, nitrogen, phosphorous and sulphur 78
and biomass productivity through mass balances under steady state. 79
80
MATERIAL AND METHODS 81
Microorganisms and culture conditions 82
An alkali-tolerant microalgae culture (AMC) was used as a model photosynthetic 83
consortium throughout the entire experiment. The AMC was enriched from Texcoco soda 84
lake in Mexico City according to De los Cobos-Vasconcelos et al. (2015). A culture of 85
alkaliphilic sulphur oxidizing bacteria (ASB) was used as a model H2S degrading
86
consortium (González-Sánchez and Revah, 2007). The mixed AMC/ASB culture was 87
grown in a mineral salt medium (MSM) composed of (g/L): Na2CO3 (4.03); NaHCO3
88
(13.61); NaCl (1); K2HPO4 (1); K2SO4 (1); CaCl·H2O (0.04); KNO3 (2.52); MgCl2·6H2O
89
(0.2) and 2 mL of a micronutrient solution (Sorokin et al., 2001). The final pH of the MSM 90
medium was 9.3. 91
92
Experimental set-up 93
The experimental system consisted of a 25 L HRAP interconnected with a 0.35 L 94
Absorption Bubble Column (ABC) (Figure 1). The HRAP dimensions were 1.25 m long × 95
0.25 m width × 0.14 cm deep, which entailed an effective illuminated area of 0.28 m2. The 96
HRAP was illuminated at a photosynthetically active radiation (PAR) of 500 µmolm-2s-1 97
(model LI250A, LI-COR, USA) provided by LED white-cool light lamps (model 511919, 98
Ecosmart, USA). The cultivation broth in the HRAP was continuously mixed using a six 99
5
× 0.019 m of internal diameter) was interconnected to the HRAP via culture broth 101
recirculation. 102
103
Here Figure 1 104
Operational conditions 105
The HRAP was initially filled with 21 L of MSM and inoculated with four liters of AMC 106
containing a biomass concentration of 0.12 g TSS L-1. The system was operated as fed-107
batch under continuous illumination for 39 days. Four liters of algal cultivation broth were 108
drawn by day 20 and replaced with fresh ASB (0.2 g TSS L-1) grown in MSM containing 109
10 g L-1 of sodium thiosulfate (Na2S2O3) as energy source. The mixed culture was then
110
cultivated in batch mode for 19 days (stage I). From day 40 to 166 (stage II), the HRAP 111
was continuously fed at a hydraulic retention time of 9.5 days with a 1.8 times diluted 112
MSM, mimicking the composition of a digestate, supplemented with 0.35 g Na2S2O3 L-1.
113
From day 167 to 269 (stage III), a gas mixture composed of CO2 (30%vol), H2S (0.5%vol)
114
and balanced with N2 was considered as synthetic biogas, it was continuously bubbled at 22
115
L d-1 through a porous stone located at the bottom of the ABC. The column was operated 116
co-currently at a liquid to synthetic biogas volumetric ratio (L/G) of 5 using the algal-117
bacterial cultivation broth from the HRAP as scrubbing solution. From day 270 to 399 118
(stage IV), the illumination regime was set at a 12h:12 h light/dark photoperiod. The last 119
period (stage V) was operated for 117 days under similar operational conditions than those 120
imposed in stage II. Water evaporation rates were quantified and compensated by addition 121
of distilled water before sampling of the HRAP-ABC system. 122
6 Here table 1 124
Aliquots of 70 mL of HRAP cultivation broth and influent mineral salt medium were drawn 125
three times per week in order to monitor the concentration of TSS, total organic carbon 126
(TOC), inorganic carbon (IC),total nitrogen (TN), nitrite (NO2-), nitrate (NO3-) , sulphate
127
(SO42-), tiosulphate (S2O32-) and phosphate (PO43-). The pH and dissolved oxygen (DO)
128
concentration of the cultivation broth were on-line recorded every 3 min. The composition 129
of synthetic biogas at the inlet and outlet of the ABC was daily monitored by non-130
dispersive infrared sensor analysis. Finally, the elemental composition of the algal-bacterial 131
biomass was determined in stage III and IV. 132
133
Analytical Procedures 134
The concentration of TSS was measured according to Standard Methods (APHA, 2012). 135
Liquid samples were filtered through 0.45 µm Whatman filters prior determination of IC, 136
TOC, TN, PO43-, SO42- and S2O32- concentrations. The concentration of IC, TOC and TN
137
was determined by a TOC-L CSH analyzer coupled to a TNM-L chemiluminescence 138
module (Shimadzu, Japan). The concentration of N-NO3- and N-NO2- were measured
139
spectrophotometrically with commercial Nitraver and Nitriver kits, respectively (HACH, 140
USA). S-S2O32- concentration was measured by titration according to (Rodier J, 1988). The
141
concentration of S-SO42- was analyzed according to the Standard Methods (WEF, 2012).
P-142
PO43- concentration was analyzed using a Dionex ICS 2000 Ion Chromatograph (USA)
143
equipped with a IonPacAS23 column (250 × 4 mm) eluted at 1 mL min-1 with a mobile 144
phase containing CO32- and HCO3- at 4.5 y 0.8 mM, respectively. The elemental biomass
145
7
of 50 mL of cultivation broth centrifuged at 10,000 rpm (Avanti 123, Beckman Coulter, 147
USA) and washed 3 times with Milli-Q water. The salt-free pellets were dried at 105°C for 148
24h and grinded prior analysis in a Flash 2000 Elemental Analyzer CHNS-O Analyzer 149
(Thermo Scientific, USA). The gas concentration of CO2, O2 and H2S at the inlet and outlet
150
of the ABC were analyzed with continuous nondispersive infrared sensor gas analyzer 151
(Ultramat 23, Siemens, Germany). The dissolved oxygen concentration and pH were online 152
determined using Applisens Z10023525 (Applikon, The Netherlands), Orion 9107BNMD 153
(Thermo Scientific,USA) and temperature probes. 154
155
Calculations 156
A series of elemental mass balances under steady state, showed in equations 1, 2, 3 and 4 157
and expressed as loading rates (Qi = mass flow rate of component i/total liquid volume),
158
allowed to assess the fate of carbon, nitrogen, phosphorus and sulphur under steady state in 159
the HRAP-ABC. 160
(1)
161
(2)
162
(3)
163
(4)
164
165
Where Qi, in and Qi, out represent the inlet and outlet mass loading rates, respectively, of all
166
species (i= carbon-C, nitrogen-N, phosphorous-P and sulphur-S) in liquid (L) and gas (G) 167
phases. Qi_X represents the loading rate of each i contained in the biomass present in the
168
effluent. Qc, stripping represents the C as CO2 lost by stripping from the HRAP. The CO2
8
stripping from the HRAP was evaluated from equation 5 including the discrete IC 170
measurements together with the corresponding pH. The dissolved CO2 (D ) was
171
calculated as a function of pH, according to equation 6. 172
CO2 stripping rate
(5)
173
(6) 174
Where VH and VT represent the volume of the aqueous phase in the HRAP and total
175
aqueous volume in the HRAP+ABC. represents the CO2 Henry constant (1.1
176
dimensionless at 20 °C). represents the global volumetric gas-liquid mass transfer 177
coefficient (20 d-1) in the HRAP, which was experimentally determined . CO2air is the
178
carbon dioxide concentration in air (350 ppmv = 1.1×10⁻⁵ mol L-1). K1 and K2 are the
179
dissociation constants for the system CO2-H2O (4.66×10⁻⁷ mol L-1 and 4.67×10⁻¹¹ mol L-1,
180
respectively) and [H+] is the proton concentration in the cultivation broth (mol L-1). 181
182
Assessment of the specific growth and partial degradation rates of microalgae under 183
light/dark cycles 184
The fluctuations of the DO measurements recorded during stage IV under steady state were 185
described using a dynamic oxygen mass-balance applied to the liquid phase (Eq. 7). This 186
mass balance was used to estimate either the volumetric oxygen production or consumption 187
(rO2) associated to microalgae biomass metabolism, accounting for the variation on the
188
temperature. 189
190
(7)
9
Where VC represents the volume of the aqueous phase in the ABC (0.3 L), represents
192
the microalgal oxygen consumption or production rate (mol L-1 d-1), represents the 193
oxygen Henry constant (32 dimensionless at 20 °C). stands the global volumetric gas-194
liquid mass transfer coefficient (141 d-1) in the ABC, which was experimentally determined 195
using the gassing-out method. was estimated to 0.0007 mol O2 L-1 d-1 based on the
196
sulphur mass balance under steady state conditions, assuming complete oxidation to 197
sulphate. 198
The evaluation of the specific growth rate μlight) and the specific partial degradation rate
199
μdark) of the microalgae biomass by photosynthesis and by respiration, respectively, was
200
based on the assumption of a 15 % w/w biomass loss by respiration during the 12 h dark 201
period (Grobbelaar and Soeder, 1985). This entails a μlight/μdark ratio of -4.2. μlight can be
202
expressed in terms of the photosynthetic oxygen/biomass ( ) yield (de los Cobos-203
Vasconcelos et al., 2015) and the oxygen production rate ( ). Similarly, μdark can be
204
defined in terms of an endogenous respiration oxygen/biomass ( ) yield and its 205
corresponding oxygen respiration rate ( ). Therefore, the overall was evaluated 206
according to equation (8) for several light/dark cycles exposed to constant temperature 207
fluctuations. and represent averaged values for a set of continuous days reaching 208
uniform temperature fluctuations. 209
(8)
210
The net volumetric biomass productivity (Px) was evaluated from the condition of steady 211
state for a continuous cultivation (see equation 9). 212
(9)
10
Where D is the dilution rate (d-1) and Xthe experimental biomass concentration (g TSS L -214
1
). 215 216 217 218 219
RESULTS AND DISCUSSION 220
Synthetic biogas upgrading performance 221
The removal efficiencies of CO2 and H2S during stage III accounted for 89 ± 4 % and 99.5
222
± 0.5%, respectively, and 94 ± 1% and 99.5 ± 0.5%, respectively, during stage IV. The 223
similar pH values recorded during both stages explain the comparable synthetic biogas 224
upgrading performance regardless of the illumination regime. Thus, in spite of the 225
continuous feeding of CO2 and H2S during stage III the pH remained constant ≈9.5 likely
226
due to high buffer capacity (alkalinity) of cultivation medium and the high photosynthetic 227
activity of the AMC under continuous illumination. However, pH fluctuated from 9.3 to 9.7 228
during stage IV as a result of the periodic medium acidification during the dark period due 229
to CO2 and H2S absorption, and the microalgae-based regeneration of alkalinity during the
230
light period. In this context, the increase in pH mediated by microalgae growth during the 231
illuminated period is expected to support a high biogas upgrading performance during 232
outdoors operation. These high CO2 and H2S removal efficiencies were also supported by
233
the high L/G ratio of 5), which prevented a deterioration in the CO2 /H2S mass transfer
234
induced by a decrease in the pH of the cultivation medium in the ABC (Serejo et al. 2015). 235
However, high L/G ratios often promote a high O2 stripping from the recirculation medium
236
11
study, the oxygen concentration in upgraded synthetic biogas averaged 2.6% v/v during 238
stage III and IV. According to the Mexican regulation (NOM-001-SECRE 2010) oxygen 239
concentration in biomethane must be lower than 0.20% v/v. This requires an optimization 240
of the L/G ratio or the implementation of operational strategies devoted to decrease the 241
oxygen liquid concentration prior recirculation to the ABC (Toledo-Cervantes et al., 2016). 242
The complete removal of H2S recorded in stage III and IV promoted the accumulation of
243
SO42- in the cultivation broth concomitantly with synthetic biogas upgrading. The high DO
244
concentration prevailing in the HRAP during the entire experimental period (even during 245
dark periods DO remained > 2 mg O2 L-1) supported a complete oxidation of H2S to
246
sulphate (González-Sánchez and Revah, 2007) (Table 2). The concentration of S-SO4
2-247
achieved during steady state in stages III and IV were 0.32 ± 0.02 g L-1 and 0.34 ± 0.05 g L -248
1
, respectively. 249
250
Photobioreactor performance 251
The batch cultivation during stage I supported an increase in biomass concentration in the 252
HRAP-ABC system from 0.12 g TSS L-1 to 0.77 g TSS L-1 by day 39, concomitant with a 253
decrease in IC concentration from 1.25 g C L-1 to 0.21 g C L-1 (Figure 2). Process operation 254
under continuous illumination at a HRT of 9.5 days entailed steady state biomass 255
concentration of 0.72 ± 0.04 g TSS L-1 during stage II. The continuous supply of MSM 256
mediated an increase of the IC concentration in the HRAP, which stabilized at 1.13 ± 0.09 257
g C L-1 from day 120 till 166. Synthetic biogas supply during stage III under continuous 258
illumination resulted in an increase in biomass concentration up to 1.23 ± 0.05 g TSS L-1, 259
which suggested that microalgae growth was limited by CO2 concentration during stage II
260
12
reduction in light energy supply mediated by process operation under 12h/12h light /dark 262
cycles induced a decrease in biomass concentration from 1.23 ± 0.05 g TSS L-1 to steady 263
state values of 0.23 ± 0.05 g TSS L-1 by the end of stage IV. This decrease in TSS 264
concentration entailed a reduction in the volumetric biomass productivity from 0.129 to 265
0.023 g TSS L-1 d-1, but did not impact on the concentration of IC in the HRAP, which 266
remained constant at 1.02 ± 0.06 g C L-1 (Table 2 and Figure 2) probably due to the CO2
267
stripping as it is explained below. A detailed explanation of the mechanisms underlying the 268
unexpectedly low biomass productivity is provided below. Process operation under 269
continuous illumination during stage V supported an increase in biomass concentration and 270
productivities up to steady state values of 0.94 ± 0.09 g TSS L-1 and 0.098 g TSS L-1 d-1 271
(Table 2). The absence of synthetic biogas supply during stage V resulted in an increase in 272
the pH up to 10.23 ± 0.05 and in the expected decrease in IC concentration to steady state 273
values of0.86 ± 0.12g C L-1 via biomass assimilation (Figure 2). 274
275
Here figure 2 276
The average removal efficiencies of nitrogen and phosphorous during stages III, IV and V 277
are shown in Table 2. Similar nutrient removal efficiencies were achieved during stage III 278
and V, while the decrease in biomass productivity recorded in stage IV resulted in a 279
significant decrease in the removal efficiency of phosphate. An experimental error in the 280
determination of nitrate concentrations might explain the unexpectedly high nitrate 281
removals recorded during stage IV (comparable to stage III and IV), since no noteworthy 282
differences were observed in the elemental composition of the biomass along the three last 283
operational stages and N-NO2- concentrations were very low ≈ 0.0004 mg N-NO2-.L-1). A
13
potential N2O production in the system was also ruled out due to the relatively high DO
285
present in the HRAP during stage IV (> 2mg O2 L-1), which prevented nitrate
286
denitrification (Wang et al., 2008). 287
288
Here table 2 289
290
C, N, P and S mass balances 291
Mass balance calculations for the main elemental components were conducted in the 292
experimental system under steady state in stages III, IV and V. 293
294
Here figure 3 295
The carbon present in the synthetic biogas as CO2 accounted for approx. 40 % of the
296
inorganic carbon inlet load in stage III and IV (Figure 3 a). Dissolved inorganic carbon 297
accounted for 58 % of the output carbon from the system. On the other, the carbon present 298
as biomass in the liquid effluent represented 30 % of the output carbon during continuous 299
illumination, while this share decreased to 7 % under light/dark cycles as a result of the 300
limited microalgal productivity. This limited microalgae growth during stage IV resulted in 301
an enhanced carbon stripping, which increased from 5 to 12 %. The restoration of 302
continuous illumination in the absence of synthetic biogas in stage V increased the share of 303
inorganic carbon assimilated into biomass, which accounted for 37 % of the total output 304
carbon, thereby minimizing carbon stripping. The nitrogen assimilated as biomass 305
14
(Figure 3b). Similarly, the phosphorous fixed in the biomass represented 17, 3 and 14 % of 307
the output phosphorous in stages III, IV and V, respectively. For both nutrients, the share in 308
the output streams was correlated with biomass productivity since no difference in the 309
biomass N and P content was recorded. Finally, the H2S present in the synthetic biogas
310
accounted for 12 and 10% of the inlet Sulphur in stages III and IV, respectively. This share 311
was significantly lower than the sulphur present as thiosulphate in the feed. Both reduced 312
forms of sulphur were completely oxidized to sulphate, which represented 99.5% of the 313
output sulphur in stage III, IV and V. 314
315
Effect of light/dark cycles on the biomass productivity 316
During the illuminated period in stage IV, microalgal photosynthesis was responsible of a 317
net oxygen production in the HRAP. However, in the dark period, the microalgae and 318
sulfide oxidizing bacteria consumed by respiration the dissolved oxygen present in the 319
cultivation broth, with a concomitant production of CO2 (Bahr et al., 2014; Masojídek and
320
Koblízek, 2004). Hence, the dynamic balance between microalgae growth and endogenous 321
biomass consumption entailed a steady state biomass concentration 0.2 g TSS L-1, which 322
were significantly lower than the expected value derived from a 50% reduction in light 323
supply. In the absence of light supply, the microalgae consumed their intracellular organic 324
carbon (i.e. carbohydrates) for cell maintenance, which was likely responsible of the lower 325
biomass concentrations recorded. Figure 4, based on the estimated volumetric oxygen 326
production and consumption (rO2) rates from equation 7, shows that endogenous
327
respiration activity was similar to the photosynthetic activity responsible of microalgae 328
growth. 329
15 Here figure 4 331
Two different temperature fluctuation trends can be observed in Figure 4, since the HRAP-332
ABC was exposed to the daily outdoors temperature fluctuations. These variations in the 333
temperature of the cultivation broth influenced the extent of the oxygen production and 334
endogenous respiration rates of the algal-bacterial consortium. From day 370 to 377, the 335
temperature fluctuated from 13 to 24°C, while for days 387 to 396 the range was 16 to 336
28°C. This difference of 4 °C in the temperature fluctuation range induced a 60 % increase 337
in both μlight, μdark and biomass productivity (Table 3). Therefore, the microalgae
338
productivities estimated were highly affected by the lower temperatures, which correlated 339
with the decrease in the photosynthetic growth rates. The endogenous respiration yield, 340
, was up to three times higher than the photosynthetic oxygen production yield, 341
, and showed an inverse correlation with temperature. The here estimated were 342
in agreement with the respiration yields typically reported in microalgal cultures (0.0034-343
0.124 mol O2/gTSS) (Le Borgne and Pruvost, 2013; Ruiz-Martinez et al., 2016). The novel
344
methodology for the calculation of microalgae biomass productivity here developed based 345
on continuous DO measurements was validated by the empirical biomass productivity 346
estimated on the empirical measurements of the dilution rate and effluent biomass 347
concentration (Table 3). 348
349
Here table 3 350
16 Conclusions
352
Alkaliphic algal-bacterial consortia were shown as an effective platform to bioconvert 353
biogas into biomethane. Microalgal photosynthesis was able to effectively regenerate the 354
alkalinity consumed during CO2 and H2S absorption even during light/dark illumination
355
regimes similar to those prevailing under outdoors conditions. Carbon and nutrient recovery 356
was a function of the biomass productivity, which itself depended on the photobioreactor 357
illumination regime and temperature. The endogenous microalgae respiration during the 358
dark period was likely responsible of the higher decrease in biomass compared to that 359
expected from a 50% reduction in light supply. 360
361
Acknowledgements 362
This research was supported by the National Science Foundation of Mexico (CB-Conacyt 363
168288), Mexican Secretary of Marine (SEMAR-Conacyt 207151), Mexican Secretary of 364
Energy (SENER-Conacyt 247006) and by the internal project IIUNAM 4328. The 365
analytical assistance of Dr. Juan Gabriel Vigueras Ramírez and the financial support of 366
projects CTM2015-70442-R (MINECO-FEDER) and VA024U14 are also gratefully 367
acknowledged. This research work was performed in the IIUNAM-Environmental 368
Laboratory with ISO9000 certificate. 369
370
References 371
Alcantara, C., Garcia-Encina, P.A., Muñoz, R., 2015. Evaluation of the simultaneous 372
biogas upgrading and treatment of centrates in a high-rate algal pond through C, N and 373
P mass balances. Water Sci. Technol. 72, 150–157. doi:10.2166/wst.2015.198 374
17
biotechnology as a platform for an integral biogas upgrading and nutrient removal 376
from anaerobic effluents. Environ. Sci. Technol. 48, 573–581. doi:10.1021/es403596m 377
Batten, D., Beer, T., Freischmidt, G., Grant, T., Liffman, K., Paterson, D., Priestley, T., 378
Rye, L., Threlfall, G., 2013. Using wastewater and high-rate algal ponds for nutrient 379
removal and the production of bioenergy and biofuels. Water Sci. Technol. 67, 915– 380
24. doi:10.2166/wst.2012.618 381
De Godos, I., González, C., Becares, E., García-Encina, P. a, Muñoz, R., 2009. 382
Simultaneous nutrients and carbon removal during pretreated swine slurry degradation 383
in a tubular biofilm photobioreactor. Appl. Microbiol. Biotechnol. 82, 187–194. 384
doi:10.1007/s00253-008-1825-3 385
de los Cobos-Vasconcelos, D., García-Cruz, E.L., Franco-Morgado, M., González-Sánchez, 386
A., 2015. Short-term evaluation of the photosynthetic activity of an alkaliphilic 387
microalgae consortium in a novel tubular closed photobioreactor. J. Appl. Phycol. 388
doi:10.1007/s10811-015-0612-7 389
Franchino, M., Comino, E., Bona, F., Riggio, V. a, 2013. Growth of three microalgae 390
strains and nutrient removal from an agro-zootechnical digestate. Chemosphere 92, 391
738–44. doi:10.1016/j.chemosphere.2013.04.023 392
González-Sánchez, A., Revah, S., 2007. The effect of chemical oxidation on the biological 393
sulfide oxidation by an alkaliphilic sulfoxidizing bacterial consortium. Enzyme 394
Microb. Technol. 40, 292–298. doi:10.1016/j.enzmictec.2006.04.017 395
- , A., Revah, S., Deshusses, M.A., 2008. Alkaline Biofiltration of H 2 S 396
Odors. Environ. Sci. Technol. 42, 7398–7404. doi:10.1021/es800437f 397
Grobbelaar, J.U., 2004. Algal Nutrition, in: Amos, R. (Ed.), Handbook of Microalgal 398
18
Grobbelaar, J.U., Soeder, C.J., 1985. Respiration losses in planktonic green algae cultivated 400
in raceway ponds. J. Plankton Res. 7, 497–506. doi:10.1093/plankt/7.4.497 401
Hernández, D., Riaño, B., Coca, M., García-González, M.C., 2013. Treatment of agro-402
industrial wastewater using microalgae-bacteria consortium combined with anaerobic 403
digestion of the produced biomass. Bioresour. Technol. 135, 598–603. 404
doi:10.1016/j.biortech.2012.09.029 405
Le Borgne, F., Pruvost, J., 2013. Investigation and modeling of biomass decay rate in the 406
dark and its potential influence on net productivity of solar photobioreactors for 407
microalga Chlamydomonas reinhardtii and cyanobacterium Arthrospira platensis. 408
Bioresour. Technol. 138, 271–276. doi:10.1016/j.biortech.2013.03.056 409
Lebrero, R., Toledo-Cervantes, A., Muñoz, R., del Nery, V., Foresti, E., 2016. Biogas 410
upgrading from vinasse digesters: a comparison between an anoxic biotrickling filter 411
and an algal-bacterial photobioreactor. J. Chem. Technol. Biotechnol. 91, 2488–2495. 412
doi:10.1002/jctb.4843 413
Lee, Y., 2001. Microalgal mass culture systems and methods : T i imi i d 414
potential 307–315. 415
Markou, G., Vandamme, D., Muylaert, K., 2014. Microalgal and cyanobacterial cultivation: 416
The supply of nutrients. Water Res. 65, 186–202. doi:10.1016/j.watres.2014.07.025 417
Masojídek J, Koblízek M, T.G., 2004. Photosynthesis in Microalgae, in: Amos, R. (Ed.), 418
Microalgal Culture: Biotechnology of Applied Phycology. Blackwell Publishing, UK, 419
pp. 20–39. 420
Muñoz, R., Guieysse, B., 2006. Algal-bacterial processes for the treatment of hazardous 421
contaminants: a review. Water Res. 40, 2799–815. doi:10.1016/j.watres.2006.06.011 422
19
physical/chemical and biological technologies for biogas upgrading. Rev. Environ. 424
Sci. Biotechnol. 14, 727–759. doi:10.1007/s11157-015-9379-1 425
NOM-001-SECRE-, 2010. Especificaciones del gas natural. Diario Oficial. Secretaria de 426
Energia, Mexico. 427
Noyola, A., Morgan-Sagastume, J.M., López-Hernández, J.E., 2006. Treatment of Biogas 428
Produced in Anaerobic Reactors for Domestic Wastewater: Odor Control and 429
Energy/Resource Recovery. Rev. Environ. Sci. Bio/Technology 5, 93–114. 430
doi:10.1007/s11157-005-2754-6 431
Posadas, E., Garcia-Encina, P.A., Soltau, A., Dominguez, A., Diaz, I., Muñoz, R., 2013. 432
Carbon and nutrient removal from centrates and domestic wastewater using algal-433
bacterial biofilm bioreactors. Bioresour. Technol. 139, 50–58. 434
doi:10.1016/j.biortech.2013.04.008 435
Redondo, R., Machado, V.C., Baeza, M., Lafuente, J., Gabriel, D., 2008. On-line 436
monitoring of gas-phase bioreactors for biogas treatment: hydrogen sulfide and sulfide 437
analysis by automated flow systems. Anal. Bioanal. Chem. 391, 789–98. 438
doi:10.1007/s00216-008-1891-5 439
Rodier J, 1988. Analisis de las aguas. Omega S.A., Barcelona, Spain. 440
Ruiz-Martinez, A., Serralta, J., Seco, A., Ferrer, J., 2016. Behavior of mixed 441
Chlorophyceae cultures under prolonged dark exposure. Respiration rate modeling. 442
Ecol. Eng. 91, 265–269. doi:10.1016/j.ecoleng.2016.02.025 443
Serejo, M.L., Posadas, E., Boncz, M.A., Blanco, S., García-Encina, P., Muñoz, R., 2015. 444
Influence of biogas flow rate on biomass composition during the optimization of 445
biogas upgrading in microalgal-bacterial processes. Environ. Sci. Technol. 49, 3228– 446
20
Sorokin, D.Y., Lysenko, A.M., Mityushina, L.L., Tourova, T.P., Jones, B.E., Rainey, F.A., 448
Robertson, L.A., Kuenen, G.J., 2001. nov . and Thioalkalimicrobium sibericum sp . 449
nov ., and Thioalkalivibrio versutus gen . nov ., sp . nov ., Thioalkalivibrio nitratis sp . 450
nov . and Thioalkalivibrio denitrificans sp . nov ., novel obligately alkaliphilic and 451
obligately chemolithoautotroph 565–580. 452
Toledo-Cervantes, A., Serejo, M.L., Blanco, S., Pérez, R., Lebrero, R., Muñoz, R., 2016. 453
Photosynthetic biogas upgrading to bio-methane: Boosting nutrient recovery via 454
biomass productivity control. Algal Res. 17, 46–52. doi:10.1016/j.algal.2016.04.017 455
Uggetti, E., Sialve, B., Latrille, E., Steyer, J.-P., 2014. Anaerobic digestate as substrate for 456
microalgae culture: the role of ammonium concentration on the microalgae 457
productivity. Bioresour. Technol. 152, 437–43. doi:10.1016/j.biortech.2013.11.036 458
Wang, J., Peng, Y., Wang, S., Gao, Y., 2008. Nitrogen Removal by Simultaneous 459
Nitrification and Denitrification via Nitrite in a Sequence Hybrid Biological Reactor. 460
Chinese J. Chem. Eng. 16, 778–784. doi:10.1016/S1004-9541(08)60155-X 461
WEF, A.A. and A.P.H.A., 2012. Water Environment Federation, Standard methods for the 462
examination of water and wastewater. 463
Yan, C., Muñoz, R., Zhu, L., Wang, Y., 2016. The effects of various LED (light emitting 464
diode) lighting strategies on simultaneous biogas upgrading and biogas slurry nutrient 465
reduction by using of microalgae Chlorella sp. Energy 106, 554–561. 466
doi:10.1016/j.energy.2016.03.033 467
21 Legends of figures
470 471
Figure 1. Experimental set-up used for the alkaliphilic synthetic biogas upgrading. Dashed 472
lines represent synthetic biogas streams and continuous lines represent liquid streams. 473
474
Figure 2. Time course of concentration of biomass () and inorganic carbon (
) during the 475
operation of the HRAP-ABC. 476
477
Figure 3. Carbon (a), nitrogen (b), phosphorous (c) and sulphur (d) mass balances for 478
stages III, IV and V under steady state in the experimental HRAP-ABC. Numbers above 479
bars represent the respective input and output loading rates (g L-1d-1). 480
481
Figure 4. Time course of the estimated oxygen production and consumption rates (a) and 482
temperature (b) in the cultivation broth during the light and dark periods. Shade areas 483
Table 1. Operational conditions deployed in the experimental system HRAP-ABC.
Stage Period (d)
MSM
condition Operation mode Illumination
Synthetic biogas supply
I 0-39 (a) Fed-batch 24 h No
II
40-166 (b)
Continuous
HRT = 9.5 d 24 h No
III
167-269 (b)
Continuous
HRT = 9.5 d 24 h Yes
GRT=
23 mi
n
IV
270-399 (b)
Continuous
HRT = 9.5 d 12 h/12 h
light/dark Yes V
400-517 (b)
Continuous
HRT = 9.5 d 24 h No
(a) Cultivation in MSM
(b) Cultivation in 1.8 diluted MSM containing 0.35 g Na2S2O3 L -1
GRT-Gas residence time; HRT-Hydraulic residence time
Table 1
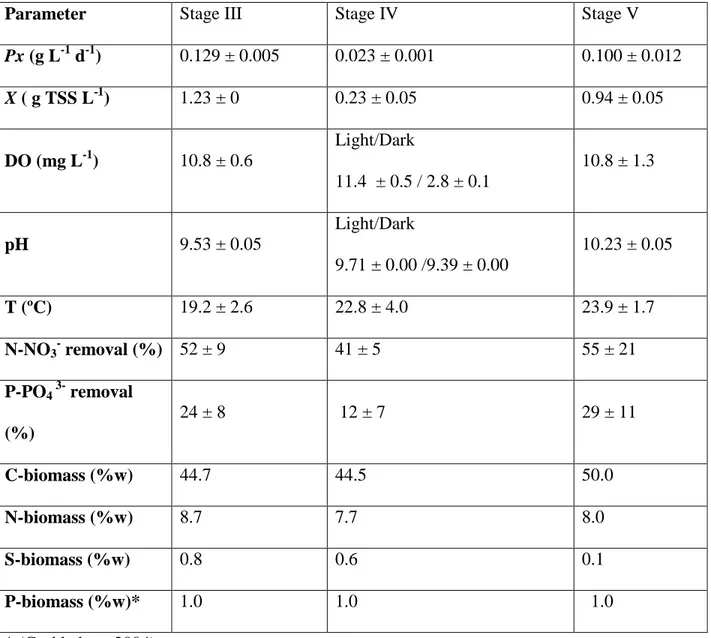
Table 2. Summary of the environmental and operational parameters in the HRAP-ABC system under steady state during Stages III, IV and V.
Parameter Stage III Stage IV Stage V
Px (g L-1 d-1) 0.129 ± 0.005 0.023 ± 0.001 0.100 ± 0.012
X ( g TSS L-1) 1.23 ± 0 0.23 ± 0.05 0.94 ± 0.05
DO (mg L-1) 10.8 ± 0.6
Light/Dark
11.4 ± 0.5 / 2.8 ± 0.1
10.8 ± 1.3
pH 9.53 ± 0.05
Light/Dark
9.71 ± 0.00 /9.39 ± 0.00
10.23 ± 0.05
T (ºC) 19.2 ± 2.6 22.8 ± 4.0 23.9 ± 1.7
N-NO3- removal (%) 52 ± 9 41 ± 5 55 ± 21
P-PO4 3- removal (%)
24 ± 8 12 ± 7 29 ± 11
C-biomass (%w) 44.7 44.5 50.0
N-biomass (%w) 8.7 7.7 8.0
S-biomass (%w) 0.8 0.6 0.1
P-biomass (%w)* 1.0 1.0 1.0
* (Grobbelaar, 2004) Table 2
Table 3. Influence of photosynthesis and respiration on the kinetic parameters and biomass productivity during light/dark cycles, based on the assumption of a 15 % w/w biomass lost by respiration during a 12 h dark period.
Temp. Range (°C)
Kinetic parameters
Biomass productivity (Px)
μlight μdark
(mol L-1 d-1) (mol g-1) d-1 g L-1 d-1
13 to 24 0.0010 0.0009 0.2441 0.0786 -0.0184 0.0120 0.0208 16 to 28 0.0016 0.0006 0.1017 0.1258 -0.0295 0.0193 0.0208 Table 3
Figure 1
Figure 2
Figure 3
Figure 4