Comparing face patch systems in macaques
and humans
Doris Y. Tsao1, Sebastian Moeller, and Winrich A. Freiwald1
Institute for Brain Research and Center for Advanced Imaging, University of Bremen, P.O. Box 330440, D-28334 Bremen, Germany Communicated by David H. Hubel, Harvard Medical School, Boston, MA, October 14, 2008 (received for review April 29, 2008) Face recognition is of central importance for primate social
behav-ior. In both humans and macaques, the visual analysis of faces is supported by a set of specialized face areas. The precise organi-zation of these areas and the correspondence between individual macaque and human face-selective areas are debated. Here, we examined the organization of face-selective regions across the temporal lobe in a large number of macaque and human subjects. Macaques showed 6 regions of face-selective cortex arranged in a stereotypical pattern along the temporal lobe. Human subjects showed, in addition to 3 reported face areas (the occipital, fusi-form, and superior temporal sulcus face areas), a face-selective area located anterior to the fusiform face area, in the anterior collateral sulcus. These results suggest a closer anatomical corre-spondence between macaque and human face-processing systems than previously realized.
face processing兩fMRI兩evolution兩form perception兩vision
F
or primates as social animals, faces are immensely important stimuli, carrying a wealth of social information. Given the paramount importance of face recognition for primates, the underlying neural mechanisms must have been subject to the highest selective pressure through the course of evolution (1, 2). As a consequence, a common primate face recognition system may exist, providing the basic scaffold around which species-specific specializations may have then evolved.In humans, extensive behavioral and neurological evidence suggests that specialized mechanisms exist for processing faces (3, 4). This notion is supported by functional imaging experi-ments showing several face-selective areas in the temporal lobe, including the fusiform face area (FFA), the occipital face area (OFA), and a face area in the superior temporal sulcus (STS-FA) (5). Furthermore, evidence has been put forward that these areas have different functional specializations, suggesting that the OFA is involved in processing face parts (6), the STS-FA in processing changeable aspects such as gaze direction (7), and the FFA in processing identity (8, 9). Thus, the human face-processing system seems to be organized around 3 specialized face areas (10).
In macaque monkeys, the existence of face-selective cortical areas, so called ‘‘face patches,’’ was demonstrated by fMRI (11, 12). Tsaoet al.(11) reported 3 regions of face-selective cortex in inferotemporal (IT) cortex, organized along an anterior– posterior axis. This finding immediately raised the question of how macaque face patches relate to those of humans and, more generally, whether there is a common functional organization for face processing in primates. By computationally stretching the cortical surface of the macaque brain over the human cortical surface, the macaque middle face patch was found to lie quite close to the human FFA (11). The human FFA and macaque middle face patch were also the largest within each species.
Although this spatial correspondence analysis is, of course, a far cry from demonstrating homology, it raises an important question about the functional organization of face-selective cortex. If the human FFA corresponds to the macaque middle face patch, then what does the macaque anterior face region correspond to? Because no face area anterior to the FFA has
been reported in humans to date, an area corresponding to the anterior macaque face region seems to be missing. Therefore, the correspondence between macaque and human face areas re-mains unclear, and it is an open question whether the 2 species whose last common ancestor dates back more than 20 million years (13) share a common functional architecture for face processing.
Here, we used fMRI in macaques and humans to address two fundamental questions about the organization of the primate face processing system. First, what is the exact composition of the macaque face processing system? Is there a consistent and reproducible pattern of face-selective cortex across individuals? The numbers of face-selective regions reported in previous studies differ [three (11), two (12, 14)], but only small numbers of animals were used in these studies. Here, we identified face-selective regions across the temporal lobes of 10 macaques, allowing a true population perspective. Second, is there face-selective cortex anterior to the FFA in humans? Intracranial electrocorticograms show face-selective evoked potentials (15) anterior to the FFA, suggestive of an anterior temporal face region. However, earlier fMRI studies did not cover the anterior portions of the human temporal lobe (5) and, therefore, could not address the existence of face-selective regions in the anterior temporal lobe. Here, we used a slice prescription that covered the entire human temporal lobe (as well as a large portion of the frontal lobe).
Results
Both monkeys and humans were scanned while awake and passively fixating. Stimuli consisted of human faces, macaque faces, hands, gadgets, fruits and vegetables, headless bodies, and scrambled patterns, presented in separate blocks. By using the same method (fMRI), the same stimulus material, and the same analysis procedures, we could directly compare the functional organization of face selectivity in these 2 species.
Face-Selective Regions in Monkeys.We scanned 10 macaques with the standard face localizer stimulus to identify face-selective regions. In 1 animal (M10), we did not find any face-selective regions despite repeated scans [see supporting information (SI) Table S1]. Fig. 1 andFigs. S1 and S2present results from the 9 remaining monkeys. Fig. 1Ashows face-selective regions in the left and right hemispheres of monkey M1 on flattened maps of the posterior half of the brain;Fig. S2ashows the same data on high-resolution coronal slices. This animal had 6 discrete face patches in each hemisphere, distributed along the anterior– posterior axis of the temporal lobe. The 2 main subdivisions of IT cortex are TEO (a cytoarchitectonic area in posterior IT
Author contributions: D.Y.T. and W.A.F. designed research; S.M. performed research; D.Y.T. and S.M. analyzed data; and D.Y.T. and W.A.F. wrote the paper.
The authors declare no conflict of interest.
1To whom correspondence may be addressed. E-mail: doris@nmr.mgh.harvard.edu or
winrich.freiwald@googlemail.com.
This article contains supporting information online atwww.pnas.org/cgi/content/full/ 0809662105/DCSupplemental.
cortex) and TE (a cytoarchitectonic area in anterior IT cortex). These patches were organized into 1 posterior patch on the lateral surface of TEO (which we will refer to as PL, for posterior lateral), 2 middle face patches in posterior TE, 1 located in the fundus of the STS (MF, for middle fundus) and 1 on the lower lip of the STS (ML, for middle lateral), and 3 patches in anterior TE, 1 located near the fundus of the STS (AF, for anterior fundus), 1 on the lower lip of the STS and adjacent gyrus, in anterior dorsal TE (AL, for anterior lateral), and 1 more medially on the ventral surface, just lateral and anterior to the AMTS, in anterior ventral TE (AM, for anterior medial).
The set of face patches for monkey M1 (Fig. 1AandFig. S2a) represents the prototypical pattern. Face patches of 8 additional animals (Figs. S1b–iand 2b–i) confirmed this pattern. Individ-ual animals and hemispheres exhibited slight variations from this pattern. We observed 4 specific types of variation: (i) In 4 of 18 hemispheres, PL and ML were confluent (right hemispheres of M2, M4, and M6; left hemisphere of M5). (ii) In 3 hemispheres, ML and MF were confluent (left hemispheres of M5, M8, and
M9). (iii) In several animals, ‘‘extra’’ spots of face-selective activation beyond the prototypical 6 patches were observed; these were usually small and unilateral (e.g., left hemisphere of M2, just posterior to AL; right hemisphere of M3, just posterior to ML; right hemisphere of M9, posterior to MF in the fundus of the STS). In 1 case, we observed a sizeable, bilateral pair of face patches at an unexpected location (M7, posterior to PL, in both hemispheres). (iv) Finally, in 2 hemispheres, 1 or more of the 6 patches were absent (AM and AF in the right hemisphere of M7; PL in the right hemisphere of M9). Overall, despite these variations, the robustness of the 6-patch pattern across the 9 animals is striking.
In cases where 2 patches were confluent (always either PL and ML, or ML and MF), we could also, in theory, have concluded that 1 of the patches was missing. However, the size of agglom-erate patches suggests that they do indeed represent confluent subcomponents. For example, in monkey M6, PL was confluent with ML in the right hemisphere but discrete from ML in the left hemisphere (Fig. S1f). The size and location of the PL–ML agglomerate in the right hemisphere were similar to that of PL and ML combined in the left hemisphere.
All of the patches shown in Fig. 1 and Figs. S1 andS2were robust and reproducible across independent scan sessions (Fig. S3). Thresholds were chosen to allow all robust patches to be revealed, and the number of patches was not dependent on the
Fig. 1. Face-selective regions in 2 macaques, superimposed on flattened cortical surfaces (AandB) and a lateral view of the inflated hemispheres (C). Computational flattening involves distorting the spatial arrangement of the data and underestimates the size of the sulci (shown in dark gray). Color scale bars indicate the negative common logarithm of the probability of error. PL, posterior face patch; MF, middle face patch in the STS fundus; ML, middle face patch on the STS lip; AF, anterior face patch in the STS fundus; AL, anterior face patch on the STS lip; AM, anterior face patch on the ventral surface of IT just lateral and anterior to the AMTS; ls, lunate sulcus; ios, inferior occipital sulcus; ots, occipitotemporal sulcus; sts, superior temporal sulcus; ips, intraparietal sulcus; sf, Sylvan fissure.
Fig. 2. Face-selective regions in the left and right temporal lobes of 2 humans, superimposed on flattened cortical surfaces (AandB) and a ventral view of the inflated hemispheres (C). OFA, occipital face area; FFA, fusiform face area; STS-FA, superior temporal sulcus face area; AFP1, anterior face patch 1; aos, anterior occipital; los, lateral occipital; lots, lateral occipitotem-poral; ips, intraparietal; its, inferior temoccipitotem-poral; sts, superior temoccipitotem-poral; pos, parietooccipital; cas, calcarine; cos, collateral; tos, transoccipital; pcs, precen-tral; and sf, Sylvan fissure.
particular threshold chosen. The pattern of temporal lobe patches was identical when all data are shown at a common threshold ofP⫽10⫺3.1(Fig. S4), with 2 exceptions: AM, the face patch on the ventral surface of IT that is most susceptible to signal extinction because of use of a surface coil, was not visible in 2 cases at this threshold (right hemisphere of M4 and left hemisphere of M7).
Table S2gives the sizes of the 6 face patches in each of the 9 macaques. ML was the largest of the 6 patches, followed by AL, PL, MF, AM, and AF. For the 7 cases of confluent patches, regions of interest (ROIs) were drawn to conform as best as possible to the pattern in the opposite hemisphere (in which patches were discrete) (Fig. S4).
Face-Selective Regions in Humans.We scanned 13 human subjects with the same face localizer stimulus used for the monkeys. We took care to use a slice prescription covering the entire temporal lobe. In addition to reported face areas OFA, FFA, and STS-FA, in the majority of subjects (9 of 13) we identified 1 or 2 face-selective regions anterior to the FFA. We call these regions AFP1 (anterior face patch 1) and AFP2 (anterior face patch 2). Fig. 2 shows face-selective regions in the left and right temporal lobes of 2 human subjects, superimposed on flattened cortical surfaces (Fig. 2AandB) and a ventral view of the inflated brain (Fig. 2C). AFP1 can be seen to lie in the anterior collateral sulcus in both subjects.Fig. S5shows face-selective regions in the left and right temporal lobes of all 9 human subjects that had at least 1 anterior face patch, superimposed on coronal, horizontal, and sagittal MRI slices. Subjects 1 and 2 (Fig. S5aandb) had both AFP1 and AFP2, whereas the remaining subjects (Fig. S5 c–i) each had 1 anterior face patch (AFP1). AFP2 was also located in the collateral sulcus, at its anterior-most tip. All 9 subjects had an FFA and OFA in both hemispheres, and 6 of 9 subjects had an STS-face area.
Table S3gives the sizes of the face-selective regions in each of the 9 human subjects. The largest face-selective region was the FFA, followed by the OFA, STS-FA, AFP1, and AFP2. Human temporal face-selective regions were larger over the right than the left hemisphere, whereas the monkey temporal face-selective regions were bilateral (Table S2).
All of the human face-selective regions, including AFP1 and AFP2, were reproducible across independent scan sessions within the same subject.Fig. S6shows face-selective regions of 4 subjects (S1, S2, S4, and S5) obtained in 2 independent scan sessions. Subjects S1 and S2 each had 2 anterior face patches that were reproducible across scan sessions (Fig. S6aandb). Subjects S4 and S5 each had 1 anterior face patch (S4 only in the right hemisphere and S5 bilaterally), and the anterior patch in the right hemisphere was reproducible in both subjects.
Susceptibility artifacts created by the ear canals cause major signal loss in a significant portion of the temporal lobe in humans; the effects are much less in macaques because of the smaller voxels sizes (16–18).Fig. S7shows face patches displayed on raw EPI (echo planar imaging) slices; for each subject, the slice containing the anterior face patch is shown. In several cases, the anterior face patch can be seen to lie close to the ear canal artifact (e.g.,Fig. S7b Rightandd). This raises the possibility that AFP1/AFP2 are actually continuations of the FFA and only appear discrete from it because of the chasm created by the ear canal susceptibility artifact. We doubt this for 2 reasons: (i) in all 9 subjects, non-face-selective gray matter lying outside the artifact could be found between the FFA and AFP1/AFP2, and (ii) there was a wide separation between AFP1 and the FFA (typically ⬎2 cm). It is entirely possible that additional face-selective regions could lie within the artifact zone, e.g., in the 4 subjects in which we did not find any anterior face-selective regions. Methodological improvements, including use of spin
echo imaging (19) and high-resolution scanning (18, 20), may uncover such regions.
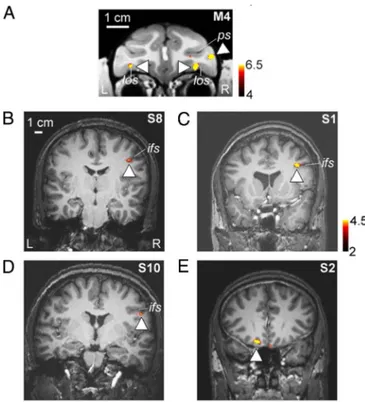
Face-Selective Regions in Prefrontal Cortex.We recently reported the existence of 3 face-selective regions in macaque prefrontal cortex (51). These include a bilateral pair of face patches in orbitofrontal cortex (within the lateral orbitofrontal sulcus), a patch located in the inferior convexity below the principal sulcus that is lateralized to the right hemisphere, and a patch in the anterior bank of the lower arcuate sulcus (Fig. 3A). In 3 of 9 human subjects, we observed face-selective activation within prefrontal cortex (see also ref. 21). The location of this activa-tion, in the inferior frontal sulcus (IFS) and lateralized to the right hemisphere, was consistent across the 3 subjects (Fig. 3 B–D). In a few subjects we also observed face-selective activation in orbitofrontal cortex (Fig. 3E). The fact we observed these prefrontal face patches in only 3 of 9 subjects may be caused by variability across subjects or by their small size (in the latter case, higher resolution scanning may reveal prefrontal face-selective regions more consistently).
Selectivity Profiles of Macaque and Human Face-Selective Regions. Average time courses (Fig. S8aandb) and percentage signal changes (Fig. S8candd) to faces and nonface objects confirm the strong face selectivity of each of the 6 macaque temporal face patches (PL, ML, MF, AL, AF, AM) and 6 human face-selective regions (OFA, FFA, STS-FA, AFP1, AFP2, and IFS). To compute response profiles, we used half of the data to define
ROIs, and the other half to extract time courses and percentage signal changes from the ROIs.
In humans, activation was significantly greater (atP⫽0.01) to human faces than to macaque faces in AFP1 (but not in OFA, FFA, or STS-FA); this is consistent with anterior human tem-poral regions being more sensitive to familiar faces (22) (because human subjects are presumably more familiar with human than macaque faces). In macaques, ML and AL were the only 2 macaque regions that showed a significantly greater response to human than macaque faces.
None of the face-selective regions in either humans or ma-caques appeared to require viewing of familiar faces to be activated. The face stimuli used in the present work were familiar to a subset of the monkeys (M1, M2, M3, M4, M7) who had seen the stimuli during training but were completely novel (i.e., seen for the first time during the face localizer scan) to the remaining monkeys (M5, M6, M8, M9). The stimuli were completely novel to all human subjects except S2, S9, and S10. The pattern of face-selective regions was similar regardless of whether the stimuli were familiar or not; in particular, we identified anterior face regions in both human and macaque subjects for whom the face stimuli were completely novel.
The face localizer stimulus contained 4 categories of nonface objects (hands, gadgets, vegetables and fruits, and headless human bodies) presented in separate blocks. Therefore, we could compare the response to bodies with that to other nonface object categories within each face region. Consistent with pre-vious reports of body areas neighboring face areas in both macaques (11, 12) and humans (20, 23), we observed a stronger response to bodies than to the other nonface object categories across the macaque and human face regions (Fig. S8eandf); this difference reached significance in PL, ML, MF, AL, and AF in macaques, and in the FFA, AFP1, and IFS in humans. Whether these body responses arise from the face-selective regions them-selves, or from nearby regions, will require ultra-high-resolution fMRI and/or single-unit recordings to resolve. High-resolution fMRI shows that the FFA does not respond to bodies (20), and targeted single-unit recordings show that the macaque middle face patch does not respond to bodies either (24). Importantly, the response to faces was significantly greater (atP⫽0.01) than that to bodies in each of the 6 macaque face patches and in OFA, FFA, AFP, and AFP2 in humans (in human STS-FA and IFS, the response to faces was only marginally greater than that to bodies; P⫽0.026 andP⫽0.059, respectively).
Discussion
Stereotyped Face Patch System in the Macaque Temporal Lobe. Expanding earlier reports of face-responsive cortex [responding more to faces than scrambled pattern controls (14, 25)] and face-selective cortex [responding more to face than to nonface object controls (11, 12, 14)] in the macaque temporal lobe, we show here that there is a stereotyped pattern of face-selective patches of cortex in the macaque temporal lobe. The spatial composition of this face patch system was highly reproducible across individuals and consisted of 1 posterior (PL), 2 middle (ML, MF), and 3 anterior (AL, AF, AM) face patches. The distance between PL and AM in the anterior posterior direction was⬎20 mm. The face patch system thus presents us with a new kind of functional organization in TE, more macroscopic than feature columns of IT cortex [⬇0.5 mm in diameter (26, 27)], yet more delicate than the coarse partitioning of IT into anatomi-cally defined subregions (28–30). The components of the face patch system are compact (a few millimeters in diameter) yet transgress area boundaries, with face patches located in poste-rior, middle, and anterior portions of IT (30). Recordings from the 2 middle face patches (24) have shown that these consist almost entirely of face-selective neurons. It is possible that only a limited number of the patches show true preferential coding of
faces. Others may have a more general function and show increased activation as a result of connectivity with the former. Alternatively, each of the face patches may constitute a domain-specific face module.*
Anterior Inferotemporal Face Areas in Humans.In the human brain, multiple face-selective areas exist as well. In addition to the OFA, FFA, and STS-FA, we describe here the existence of up to 2 face-selective regions anterior to the FFA (see alsoFig. S7
and ref. 18). This finding extends earlier lines of evidence on the importance of anterior IT cortex for face recognition. Intracra-nial recordings of epicortical potentials in epileptic patients revealed a face-selective evoked potential (15, 31) originating from anterior IT. A positron emission tomography (PET) study found anterior IT activation specifically during performance of a face identity task (32). fMRI reveals adaptation to face identity in anterior IT (8, 18). Finally, it has been shown that individuals with congenital prosopagnosia often show normal face- and object-related patterns of BOLD activity in the FFA, implying that the processing of face identity requires regions other than just the FFA (22). Subsequent anatomical analyses suggested defects in temporal lobe regions anterior to the FFA: Behrmann et al.(33) found that congenital prosopagnosics have a smaller anterior fusiform gyrus than controls. Taken together, evidence from electrophysiology, functional and structural imaging, and behavioral investigations of prosopagnosia all point to an im-portant role for anterior IT in face recognition. Our results suggest that these functions may be supported by dedicated face areas in this region.
These anterior face areas may have been missed by earlier studies that used similar face localizers either because they did not cover the entire temporal lobe (5) or because they used group analysis to explore new regions (21). Group analysis may fail if the anatomical variance of a region is large or the region is only present in a subset of subjects because of low signal-to-noise ratio caused by susceptibility.
A recent study demonstrates that multivoxel response patterns in anterior human IT cortex can be used to distinguish between 2 different faces (18). Surprisingly, however, the same voxel sets, dubbed ‘‘face-exemplar regions,’’ could not distinguish a face from a house; thus they must be distinct from the human anterior face patches identified in the present article. It remains to be determined whether the human anterior face patches are able to distinguish different face identities.
Possible Homology Between Macaque and Human Face Areas.Both macaque and human temporal lobes host multiple face-selective regions. In the macaque we consistently found 6; in individual hemispheres with less than 6 patches, the lower count could be explained by fusion of patches. In humans the number of face areas varied between 3 and 5. We consistently found the 3 described areas, OFA, STS-FA, and FFA. In addition, we found 1 or 2 anterior face regions. Thus, the overall numbers of macaque and human face-selective regions are comparable.
The spatial patterning of macaque and human face-processing systems exhibits both a striking similarity and a striking differ-ence. The striking similarity is the arrangement of areas along the occipitotemporal axis (compare Figs. 1 and 2), the striking difference is their location along the dorsoventral axis within the temporal lobe. While the macaque face patches are mostly located inside or close to the superior temporal sulcus, all of the human face-selective regions, with the exception of the STS-FA, are located further ventral, on the ventral surface of the temporal
*Freiwald WA, Tsao DT, Face representations in three fMRI-identified macaque face patches. Society for Neuroscience Annual Meeting, November 3–7, 2007, San Diego, CA, program no. 554.10.
lobe lateral to or inside the collateral sulcus. A claim of homology between these areas, then, would imply a major shift of face area location in the course of primate evolution after the split of catarrhine primates into hominoids and Old World monkeys.
It is surprising that humans have a smaller number of face-selective patches compared with macaques. This could be the result of a technical artifact [the use of smaller voxels sizes in macaques leads to decreased interaural susceptibility artifacts, and the use of Sinerem (Guerbet) contrast agent leads to a factor of 3 increase in signal/noise ratio at 3 T (34)]. Alternatively, a subset of human anterior face areas may have coalesced during evolution or acquired new functions, making them more general purpose and less face-selective.
Future Directions. Our findings present steps along the way to establishing whether a common primate face-processing sys-tem exists. Establishing homologies between cortical areas and other brain structures is notoriously difficult and requires the combination of multiple criteria (35–38). It may be argued that the search for homologies between functionally defined high-level cortical areas is in vain because these are developmen-tally malleable and because functional similarities could rep-resent convergent solutions to the same computational problem. Yet, the intraspecies consistency of the spatial pattern of the face-processing system across macaques and across humans indicates that the development of face selec-tivity is not arbitrary within the expanse of IT cortex but rather uses a fixed scaffold. Furthermore, the high social importance of faces for primates provides a rationale for why a specialized face-processing system may have evolved early during primate evolution. Clearly, many more and, ideally, diverse criteria need to be used to test areal homologies between man and macaque. Should these homologies be established for the face-processing system, then face areas could serve as land-marks that can be used to understand the evolution of the large expanse of temporal lobe between them (38).
Among the many criteria necessary to establish homology between cortical areas across species are functional similarities and links to behavior (36). Different functional properties for the different human face areas have indeed been found (6–9) and similarly for face cells in different parts of IT cortex (39–41).* Electrophysiological recordings targeted to the macaque face patches will be a powerful way to determine the functional specializations of these areas. Similarly, electrical stimulation (42) targeted to the different face patches should reveal their involvement in face recognition behaviors. These experiments may suggest future functional testing that can be conducted in both macaques and human subjects by using the same imaging modality to allow for direct comparisons of functional special-izations across species.
Methods
All animal procedures complied with the National Institutes of Health Guide for Care and Use of Laboratory Animals, regulations for the welfare of experimental animals issued by the Federal Government of Germany, and stipulations of Bremen authorities. Informed consent was obtained from all human subjects.
Surgery.The implantation of the MR-compatible headpost (Ultem; General
Electric Plastics) followed standard anesthetic, aseptic, and postoperative treat-ment protocols that have been described in detail in ref. 43. MR-compatible ceramic screws (Thomas Recording) and acrylic cement (Grip Cement, Caulk; Dentsply International) were used to secure the headpost to the skull.
Monkey fMRI.All scanning was performed on a 3 T MR scanner (Allegra;
Siemens). For each monkey, we acquired 10 anatomical volumes at high spatial resolution (0.5 mm isometric). We used a T1 weighted inversion recov-ery sequence (MPRAGE). These scans were performed under anesthesia (ket-amin/medetomidine, 8 mg/kg/0.04 mg/kg) to reduce motion artifacts.
For all functional imaging, a contrast agent, ferumoxtran-10 (concentration, 21 mg of Fe per mL in saline; dosage, 8 mg of Fe per kg; Sinerem) was injected into the femoral vein before each scan session. Sinerem is the same compound as MION, produced under a different name (44). Sinerem/MION increases signal-to-noise and gives finer spatial localization than BOLD (34, 44 – 46). Sinerem results in a signal reduction at activated voxels; for all functional data we inverted the signal to facilitate comparison with BOLD data.
All functional data were acquired in coronal slices, by using a multiecho sequence (EPI, TR 3 or 4 s, TE 30 or 25 ms, 64⫻64 matrix) and a single-loop surface coil. In combination with a concomitantly acquired field map, this procedure allowed high-fidelity reconstruction by undistorting most of the B0-field inhomogeneities (47, 48).
In these localizer experiments, we acquired 136 volumes per run (28 or 42 slices; spatial resolution, 1.25 mm and 1.5 mm isometric). The slice volume was adjusted for each monkey to cover the entire temporal lobe.Table S1 sum-marizes the experiments performed in each monkey for this work.
Human fMRI.Human functional data were acquired in horizontal slices, tilted slightly upward in the front and downward in the back, covering all of the temporal lobe and most of the frontal lobe. We used a standard EPI sequence (EPI, TR 2.5 s, TE 32, 64⫻64 matrix, 2.5-mm⫻2.5-mm in-plane resolution, 2-mm slice thickness, flip angle 90°) and a circularly polarized birdcage coil. At the end of each scan session, we obtained a high-resolution anatomical volume of the entire brain (MPRAGE, 1 mm isometric).Table S1summarizes the experiments performed in each human subject for this work.
Visual Stimulation.The face patch localizer stimulus followed a block design. Blocks lasted 32 s and included the following image categories: human faces (F), monkey faces (M), human hands (H), gadgets (G), fruits and vegetables (V), and headless bodies (B). There were 16 different images in each category. Each image block was preceded by a block consisting of scrambled versions of the same images (S), resulting in the following sequence: S F S H S M S G S F S V S M S B R (the final block consisted of a gray random dot pattern). Each image subtended 12° visual angle (10.4-cm diameter at 49-cm distance) and was presented for 0.5 s.
Visual stimulation was performed by using custom code with the Psycho-physics Toolbox (49). Stimuli were displayed at 60 Hz with a resolution of 1,280⫻1024 pixels, with a video beamer (JVC DLA-G15E) and a back projec-tion screen.
fMRI Data Analysis.We used FreeSurfer and FSFAST (http://surfer.nmr.mgh. harvard.edu) to reconstruct cortical surfaces and perform functional data analysis, following procedures detailed in ref. 11. To define face-selective areas, we calculated the contrast faces vs. all other objects (without scrambled images). Color scale bars show the significance of the contrast maps as negative common logarithm of the probability of error.
The stereotaxic coordinates of the slices were obtained as follows. Each brain was rotated to align the anterior and posterior commisures. Then the slice most closely matching AP 0 inRed’s Atlas(50) was assigned to AP 0. Sulcal identities in humans (Fig. 2) were determined by using the automated sulcus annotation feature of Freesurfer.
Attest was used to determine the significance of the difference in activa-tion to faces vs. objects and to bodies vs. other nonface objects (Fig. S8c–f), with voxels pooled across all monkeys for each patch.
Macaque data (Fig. 1;Figs. S1,S2,S4, andS8) represent averages of all runs across multiple sessions. Human data (Fig. 2 andFigs. S5andS8) were com-puted from a single representative scan session in cases where more than 1 data session was available.
ACKNOWLEDGMENTS.We are grateful to Nicole Schweers, Katrin Thoss, and Ramazani Hakizimana for technical support and to Guerbet for providing Sinerem. This work was supported by a Sofia Kovalevskaya award from the Alexander von Humboldt Foundation, by German Science Foundation Grant DFG FR1437/3-1, and by German Ministry of Science Grant 01GO0506, Bremen Center for Advanced Imaging.
1. Darwin C (1872)The Expression of the Emotions in Man and Animals(John Murray, London).
2. Nelson CA (2001) The development and neural bases of face recognition.Infant Child Dev10:3–18.
3. Moscovitch M, Winocur G, Behrmann M (1997) What is special about face recognition? Nineteen experiments on a person with visual object agnosia and dyslexia but normal face recognition.J Cognit Neurosci9:555– 604.
5. Kanwisher N, McDermott J, Chun M (1997) The fusiform face area: A module in human extrastriate cortex specialized for face perception.J Neurosci17:4302– 4311. 6. Pitcher D, Walsh V, Yovel G, Duchaine B (2007) TMS evidence for the involvement of the
right occipital face area in early face processing.Curr Biol17:1568 –1573. 7. Hoffman EA, Haxby JV (2000) Distinct representations of eye gaze and identity in the
distributed human neural system for face perception.Nat Neurosci3:80 – 84. 8. Rotshtein P, Henson RN, Treves A, Driver J, Dolan RJ (2005) Morphing Marilyn into
Maggie dissociates physical and identity face representations in the brain.Nat Neurosci 8:107–113.
9. Yovel G, Kanwisher N (2005) The neural basis of the behavioral face-inversion effect. Curr Biol15:2256 –2262.
10. Haxby JV, Hoffman EA, Gobbini MI (2000) The distributed human neural system for face perception.Trends Cognit Sci4:223–233.
11. Tsao DY, Freiwald WA, Knutsen TA, Mandeville JB, Tootell RB (2003) Faces and objects in macaque cerebral cortex.Nat Neurosci6:989 –995.
12. Pinsk MA, DeSimone K, Moore T, Gross CG, Kastner S (2005) Representations of faces and body parts in macaque temporal cortex: A functional MRI study.Proc Natl Acad Sci USA102:6996 –7001.
13. Stewart CB, Disotell TR (1998) Primate evolution: In and out of Africa.Curr Biol 8:R582–R588.
14. Hadj-Bouziane F, Bell AH, Knusten TA, Ungerleider LG, Tootell RB (2008) Perception of emotional expressions is independent of face selectivity in monkey inferior temporal cortex.Proc Natl Acad Sci USA105:5591–5596.
15. Allison T, McCarthy G, Nobre A, Puce A, Belger A (1994) Human extrastriate visual cortex and the perception of faces, words, numbers, and colors.Cereb Cortex4:544 – 554.
16. Merboldt KD, Finsterbusch J, Frahm J (2000) Reducing inhomogeneity artifacts in functional MRI of human brain activation-thin sections vs gradient compensation.J Magn Reson145:184 –191.
17. Devlin JT,et al.(2000) Susceptibility-induced loss of signal: Comparing PET and fMRI on a semantic task.NeuroImage11:589 – 600.
18. Kriegeskorte N, Formisano E, Sorger B, Goebel R (2007) Individual faces elicit distinct response patterns in human anterior temporal cortex.Proc Natl Acad Sci USA 104:20600 –20605.
19. Goense JB, Ku SP, Merkle H, Tolias AS, Logothetis NK (2008) fMRI of the temporal lobe of the awake monkey at 7 T.NeuroImage39:1081–1093.
20. Schwarzlose RF, Baker CI, Kanwisher N (2005) Separate face and body selectivity on the fusiform gyrus.J Neurosci25:11055–11059.
21. Avidan G, Hasson U, Malach R, Behrmann M (2005) Detailed exploration of face-related processing in congenital prosopagnosia. 2. Functional neuroimaging findings.J Cognit Neurosci17:1150 –1167.
22. Sugiura M,et al.(2001) Activation reduction in anterior temporal cortices during repeated recognition of faces of personal acquaintances.NeuroImage13:877– 890. 23. Peelen MV, Downing PE (2005) Selectivity for the human body in the fusiform gyrus.
J Neurophysiol93:603– 608.
24. Tsao DY, Freiwald WA, Tootell RBH, Livingstone MS (2006) A cortical region consisting entirely of face-selective cells.Science311:670 – 674.
25. Logothetis NK, Guggenberger H, Peled S, Pauls J (1999) Functional imaging of the monkey brain.Nat Neurosci2:555–562.
26. Wang G, Tanaka K, Tanifuji M (1996) Optical imaging of functional organization in the monkey inferotemporal cortex.Science272:1665–1668.
27. Tanaka K (2003) Columns for complex visual object features in the inferotemporal cortex: Clustering of cells with similar but slightly different stimulus selectivities.Cereb Cortex13:90 –99.
28. Von Bonin G, Bailey P (1947)The Neocortex of Mucoca Mulutru(Univ Illinois Press, Urbana, IL).
29. Seltzer B, Pandya DN (1994) Parietal, temporal, and occipital projections to cortex of the superior temporal sulcus in the rhesus monkey: A retrograde tracer study.J Comp Neurol343:445– 463.
30. Felleman DJ, Van Essen DC (1991) Distributed hierarchical processing in the primate cerebral cortex.Cereb Cortex1:1– 47.
31. Allison T, Puce A, Spencer DD, McCarthy G (1999) Electrophysiological studies of human face perception. I. Potentials generated in occipitotemporal cortex by face and nonface stimuli.Cereb Cortex9:415– 430.
32. Sergent J, Ohta S, MacDonald B (1992) Functional neuroanatomy of face and object processing: A positron emission tomography study.Brain115:15–36.
33. Behrmann M, Avidan G, Gao F, Black S (2007) Structural imaging reveals anatomical alterations in inferotemporal cortex in congenital prosopagnosia.Cereb Cortex 17:2354 –2363.
34. Vanduffel W,et al.(2001) Visual motion processing investigated using contrast agent-enhanced fMRI in awake behaving monkeys.Neuron32:565–577.
35. Striedter GF, Northcutt RG (1991) Biological hierarchies and the concept of homology. Brain Behav Evol38:177–189.
36. Pritz MB (2005) Comparisons and homology in adult and developing vertebrate central nervous systems.Brain Behav Evol66:222–233.
37. Payne BR (1993) Evidence for visual cortical area homologs in cat and macaque.Cereb Cortex3:1–25.
38. Orban GA, Van Essen D, Vanduffel W (2004) Comparative mapping of higher visual areas in monkeys and humans.Trends Cognit Sci8:315–324.
39. Perrett DI, Mistlin AJ, Chitty AJ (1987) Visual neurones responsive to faces.Trends Neurosci10:358 –364.
40. Eifuku S, De Souza WC, Tamura R, Nishijo H, Ono T (2004) Neuronal correlates of face identification in the monkey anterior temporal cortical areas.J Neurophysiol91:358 – 371.
41. De Souza WC, Eifuku S, Tamura R, Nishijo H, Ono T (2005) Differential characteristics of face neuron responses within the anterior superior temporal sulcus of macaques. J Neurophysiol94:1252–1266.
42. Afraz SR, Kiani R, Esteky H (2006) Microstimulation of inferotemporal cortex influences face categorization.Nature442:692– 695.
43. Wegener D, Freiwald WA, Kreiter AK (2004) The influence of sustained selective attention on stimulus selectivity in macaque visual area MT.J Neurosci24:6106 – 6114. 44. Nelissen K, Luppino G, Vanduffel W, Rizzolatti G, Orban GA (2005) Observing others:
Multiple action representation in the frontal lobe.Science310:332–336.
45. Zhao F, Wang P, Hendrich K, Ugurbil K, Kim SG (2006) Cortical layer-dependent BOLD and CBV responses measured by spin-echo and gradient-echo fMRI: Insights into hemidynamic regulation.NeuroImage30:1149 –1160.
46. Leite FP,et al.(2002) Repeated fMRI using iron oxide contrast agent in awake, behaving macaques at 3 Tesla.NeuroImage16:283–294.
47. Zeng H, Constable RT (2002) Image distortion correction in EPI: Comparison of field mapping with point spread function mapping.Magn Reson Med48:137–146. 48. Cusack R, Brett M, Osswald K (2003) An evaluation of the use of magnetic field maps
to undistort echo-planar images.NeuroImage18:127–142.
49. Brainard DH (1997) The Psychophysics Toolbox.Spatial Vis10:433– 436.
50. Ungerleider LG,Red’s Atlas(Laboratory of Neuropsychology, National Institute of Mental Health, Department of Health and Human Services, Washington, DC). 51. Tsao DY, Schweers N, Moeller SM, Freiwald WA (2008) Patches of face-selective cortex
in the macaque frontal lobe.Nat Neurosci11:877– 879.