1
Analysis of volatile compounds in gluten-free bread crusts with an optimised and
validated SPME-GC/QTOF methodology
Joana Pico a*, Beatriz Antolín a, Laura Román b, Manuel Gómez b, José Bernal a a
I.U.Cinquima, Analytical Chemistry Group, University of Valladolid, Paseo de Belén Street 7, E-47011 Valladolid, Spain.
b
Food Technology Area, E.T.S. Ingenierías Agrarias, University of Valladolid, Madrid Avenue 57, E- 34071 Palencia, Spain.
*Corresponding author: Joana Pico e-mail: [email protected] Highlights
A SPME-GC/QTOF method was developed and optimised for analysing bread crust aroma.
SPME conditions implied 0.75 g of crust sample extracted at 60°C for 51 min.
The proposed SPME-GC/QTOF methodology was sensible, precise, accurate and linear.
Furfural was the most abundant compound in commercial wheat bread crust.
2 Abstract
The aroma of bread crust, as one of the first characteristics perceived, is essential for bread acceptance. However, gluten-free bread crusts exhibit weak aroma. A SPME-GC/QTOF methodology was optimised with PCA and RSM and validated for the quantification of 44 volatile compounds in bread crust, extracting 0.75 g of crust at 60°C for 51 min. LODs ranged between 3.60-1760 µgKg-1, all the R2 were higher than 0.99 and %RSD for precision and %Er for accuracy were lower than 9% and 12%, respectively. A commercial wheat bread crust was quantified, and furfural was the most abundant compound. Bread crusts of wheat starch and of japonica rice, basmati rice and teff flours were also quantified. Teff flour and wheat starch crusts were very suitable for improving gluten-free bread crust aroma, due to their similar content in 2-acetyl-1-pyrroline and 4-hydroxy-2,5-dimethyl-3(2H)-furanone compared to wheat flour crust and also for their high content in pyrazines.
Keywords: volatile compounds; SPME-GC/QTOF; bread crust; gluten-free bread; PCA; RSM.
3 1. Introduction
The aroma of bread crust is one of the first attributes sensed when entering a bakery shop. It has been characterised by volatile compounds from Maillard reactions, caramelisation and thermal degradation (Pico, Bernal, & Gómez, 2015), although there can be volatile compounds from lipid oxidation in smaller proportions (Moskowitz, Bin, Elias, & Peterson, 2012). 2-Acetyl-1-pyrroline, generated by Maillard reactions, has been considered the key volatile compound of wheat flour bread crust. Other important volatile compounds include 3-methylbutanal, 2,3-butanedione and 4-hydroxy-2,5-dimethyl-3(2H)-furanone, also from Maillard reactions, along with 2-(E)-nonenal and 2,4-(E,E)-decadienal from lipid oxidation (Zehentbauer & Grosch, 1998).
In the case of gluten-free bread, the sensory quality is barely acceptable, almost notably the texture and the aroma (Pacyński, Wojtasiak, & Mildner-Szkudlarz, 2015). Quality parameters such as nutritional value, rheology of the dough, texture, volume and colour have been widely studied in gluten-free bread (Houben, Höchstötter, & Becker, 2012; Masure, Fierens, & Delcour, 2016). However, there is little knowledge regarding the aroma of gluten-free bread crusts. To our knowledge, only Pacyński et al. (2015) have studied the volatile compounds of gluten-free bread crusts with amino acid – sugar pairs added with the aim of promoting the generation of Maillard compounds and improving the aroma of the crust.
4
analyses, most researchers have studied the crumb and crust together (Paraskevopoulou, Chrysanthou, & Koutidou, 2012; Plessas et al., 2008, 2011; Poinot et al., 2007, 2008a). The study of the volatile compounds from the crust separately from the crumb is very important in order to understand its volatile profile. To our knowledge, only Raffo et al. (2015) and Pacyński et al. (2015) have studied the volatile compounds of bread crust by SPME-GC/MS, the latter examining gluten-free bread crust. On the other hand, understanding the performance characteristics of the analytical methodology is crucial in order to achieve reliable results, but this information has only been reported for SPME-GC/MS analyses of bread by Raffo et al. (2015). They studied the repeatability, intermediate precision, linearity as well as LOD and LOQ for volatile compounds analyses in wheat bread crust. However, to the best of our knowledge, the accuracy has not been studied for any SPME-GC/MS methodology; verifying the accuracy is very important for interpreting the quantifications made from these methodologies, since it expresses the closeness of the experimental result to the accepted value (AOAC guideline, 2002). Finally, the optimisation of the methodology before its validation is also imperative so as to ensure that the maximum amount of analyte is extracted, but any optimisation was carried out by Raffo et al. (2015) for the analysis of the volatile compounds of the crust by SPME-GC/QTOF. Moreover, as far as we know, the use of statistical tools such as the Response Surface Method (RSM) has not been reported for the optimisation of SPME methodologies for bread volatile compounds analyses.
5
commercial sample was made using the Method of Standard Addition (MSA). It must be noted that this is the first time that a SPME methodology has been optimised through the use of Design of Experiments (DOE) in the analysis of volatile compounds in bread, specifically with Principal Component Analysis (PCA) followed by RSM. The second goal was to quantify volatile compounds through the MSA of teff, basmati rice, japonica rice and wheat starch bread crusts for the selection of the most suitable gluten-free flour or starch for the improvement of the final aroma of gluten-gluten-free bread crust, using wheat bread as a control sample. The choice of the quantified gluten-free bread crusts was made using the semi-quantification method as screening process of oat, quinoa, teff, basmati rice, japonica rice and corn and wheat starch.
2. Materials and methods
2.1. Materials, reagents and standards
For the analytical characterisation of the method, 2-acetyl-1-pyrroline (2-ACPY) was purchased from Eptes (Vevey, Switzerland) and the other 43 pure standards found in Table S1 were purchased from Sigma-Aldrich (Steinheim, Germany). Dichloromethane was obtained from Scharlab (Barcelona, Spain) and methanol was from VWR International (Fontenay-sous-Bois, France). Argon, nitrogen and helium were acquired from Carburos Metálicos (Barcelona, Spain).
2.2. Preparation of standard solutions
6
included in Table 1, working solutions of each volatile compound were prepared in methanol. All the solutions were stored in a freezer at -20°C.
2.3. Sample employed for the development of the SPME-GC/QTOF method
The development and characterisation of the methodology were carried out with the crust of wheat bread purchased from Forvasa (Puçol, Spain). The label indicated that the ingredients were wheat flour, water, salt, yeast and flour improver (wheat flour, anti-caking agent (E-170), emulsifier (E-472e), antioxidant (E-300) and enzymes).
Loaves of bread were cut into slices of 5 cm width, including the ends. The crust was scratched with a knife, taking care not to remove pieces of crumb. Once all the crust was removed, it was frozen with liquid nitrogen and finally it was grounded in an Ika grinder model M20 (Staufen, Germany) for 10 seconds.
2.4. Gluten-free bread formulation: flours, starches, hydrocolloid and yeast
Wheat starch was supplied by Roquette Laisa (Valencia, Spain), corn starch by Miwon Daesang (Seul, Korea) and wheat flour by Harinera Castellana (Medina del Campo, España). Japanica rice flour was purchased from Molendum ingredients (Zamora, Spain), oat flour from Emilio Esteban (Valladolid, Spain), quinoa flour from El Granero Integral (Madrid, Spain) and teff flour from Salutef (Palencia, Spain). Basmati flour was milled from basmati rice from Dacsa (Lisboa, Portugal), employing a grinder model Perten 3300 (Hägersten, Sweden). Hydroxyl propyl methyl cellulose (HPMC) K4M was supplied by Dow Chemicals (Michigan, USA) and the dry baker’s yeast (Saccharomyces cerevisiae) by Lesaffre (Cerences, France). All yeasts belonged to the same batch to decrease the risk of different cell count of yeast and different contaminant bacteria.
7
The following ingredients, as g/100g of flour or starch, were used in all the formulas: sunflower oil (6 g/100 g), sucrose (5 g/100 g), salt (1.8 g/100g), yeast (3 g/100 g), HPMC (2 g/100 g) and water (100 g/100 g). They were mixed using a Kitchen-Aid Professional mixer (KPM5, KitchenAid, St. Joseph, Michigan, USA) for 8 min at speed of 56 rpm. The fermentation was carried out for 90 min in a chamber at 30°C with 90% of relative humidity, reaching average specific volumes between 1.91 ml/g and 6.89 ml/g (data not shown). The doughs were baked, in rows of two, at 190°C for 40 min in a convection oven model Salva 5 grid (Guipuzcoa, Spain). After baking, the gluten-free breads were left at room temperature for 30 min and cut as described in sub-section 2.3. Each sample was prepared in duplicate (n=2).
2.6. Solid-phase microextraction
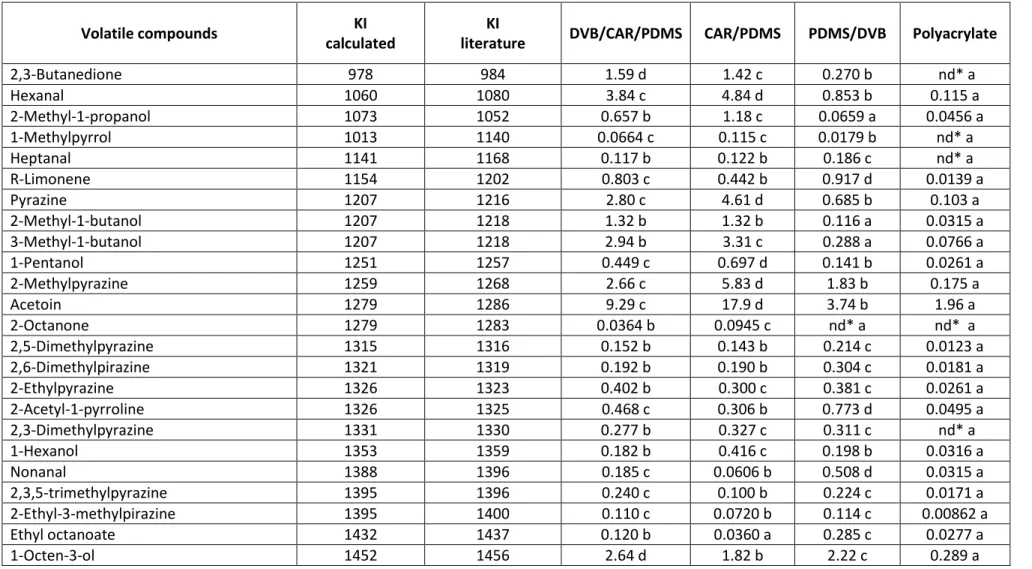
Four fibres were tested, including polydimethysiloxane / divinylbenzene (PDMS/DVB) (65 µm), carboxen / polydimethysiloxane (CAR/PDMS) (85 µm), divinylbenzene / carboxen / polydimethysiloxane (DVB/CAR/PDMS) (50/30 µm) and polyacrylate (85 µm), all of them from Sigma Aldrich (Gillingham, UK). The selected fibre was DVB/CAR/PDMS and an autosampler was employed for the extraction of the volatile compounds. An amount of 0.75 g (± 0.0050 g) of wheat bread crust was weighed into a 20 mL vial and sealed with a magnetic screw cap provided with PTFE/silicone septa. The sample was incubated in the oven for 5 min at 60°C (without the fibre) and then the volatile compounds were extracted in the same oven for 51 min at 60°C, without agitation. After that, the fibre was inserted into the GC injector port for thermal desorption for 5 min at 270°C, with an injection volume of 1 µL. Finally, the fibre was conditioned for 30 min at 270°C after each analysis.
8
9
20–350 m/z, operating in electron ionization mode with energy of 70 eV. All the 44 volatile compounds shown in Table S1 were identified by comparison of their retention times and accurate mass spectra (with four decimal places) with standards as well as using their Kovats Index (Table S1) and their Mass Spectra Library (NIST MS Search 2.2 & MS Interpreter).
2.8. Validation of the SPME-GC/QTOF method
The analytical parameters were evaluated following the AOAC guidelines (2002).
2.8.1. Limits of detection (LODs) and quantification (LOQs)
These parameters were calculated comparing the area of analyte peaks from a spiked crust sample and the area of the noise from a blank (the air of an empty vial) at the same retention time as that of the analyte peaks. Injections were made in quintuplicate (n=5). LODs were calculated as 3 times the signal to noise ratio (S/N), while LOQs were calculated as 10 times the S/N.
2.8.2. Precision: intra-day repeatability and inter-day repeatability
For intra-day repeatability, crust samples were injected in quintuplicate and the RSD (%) of each compound was calculated (n=5). In terms of inter-day repeatability, crust samples were injected in quintuplicate on three alternate days and RSD (%) was calculated (n=5). Following the AOAC guidelines (2002), maximum RSDs of 15% were accepted for the repeatability.
2.8.3. Quantification of volatile compounds of the commercial wheat bread crust
sample: linearity and accuracy.
10
coefficients of determination R2 were obtained and a t-test for the linearity was done in order to ensure the linear tendency of the regression (texperimental > tcritical). The relative errors (% Re) for the accuracy were also calculated. Following the AOAC guidelines (2002), maximum Re of 15% were accepted for accuracy. The concentration of the volatile compounds was calculated through MSA.
2.9. Application of the SPME-GC/QTOF method to the quantification of the volatile
compounds of gluten-free bread crusts
The quantification was made in the same way than for the commercial bread, using the MSA. The volatile compounds of the crusts made with basmati rice, japonica rice and teff flours and wheat starch, as well as wheat flour (control sample), matrix-matched calibration curves were made in the range of 0.150 – 9.00 mg Kg-1 for all the volatile compounds except for 2-ACPY, which was from 0.0200 – 0.960 mg Kg-1. The same procedure as that in sub-section 2.6 - 2.7 was followed.
2.10. Statistical analysis of the data.
11
in the case of the quantitative studies, the concentrations in µg Kg-1 were the data employed for the PCA.
3. Results and discussion
3.1. Optimisation of the SPME conditions
3.1.1. Selection of the fibre
12
3.1.2. Selection of the weight, extraction time and extraction temperature
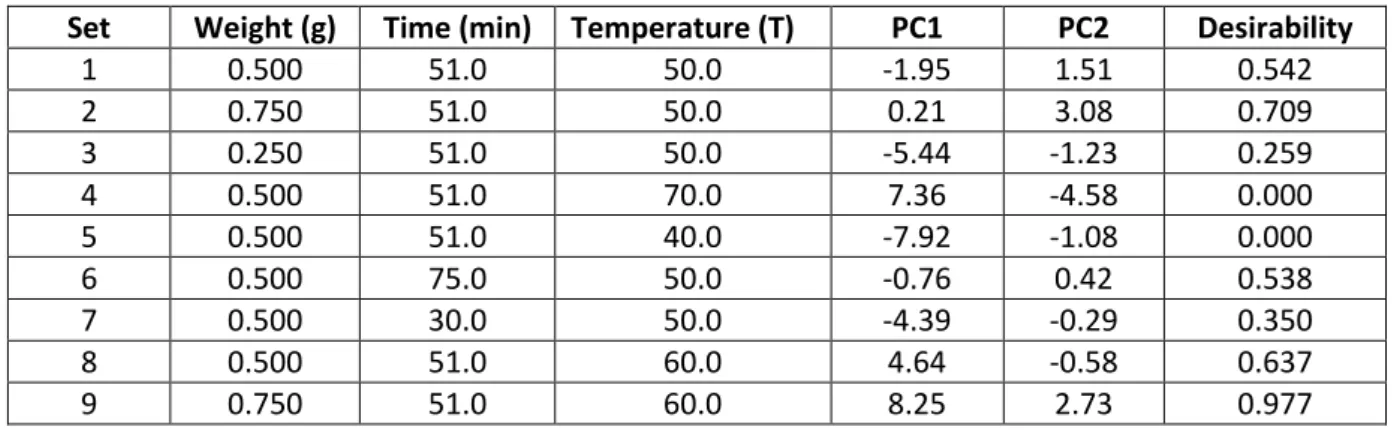
In order to optimise the weight of sample, the extraction temperature and the extraction time, a modification of the Central Composite Design (CCD3) was carried out (Table S2). The starting point of the design was the optimum (set 1, Table S2) obtained from a Central Composite Design (CCD3) with three central points for the optimisation of a SPME-GC/QTOF methodology for the analysis of volatile compounds in flours and starches (Pico, Tapia, Bernal, & Gómez, 2017), since the moisture content of the flours and starches was not expected to be much higher than that of the crust (the moisture of our bread crusts ranged between 7.07% and 11.74%, data not shown). Nine combinations or sets of values of weight, extraction time and extraction temperature higher and lower than the optimum were used for experimentation (Table S2). The maximum value of weight (0.75 g) was selected in order to avoid the saturation of the detector, and the minimum (0.25 g) was selected due to the great losses of signal with lower weights. The maximum value of temperature (70 °C) was chosen so as to avoid the development of Maillard reactions, but with lower temperatures (50 °C) the signal decreased a lot. Finally, the minimum value of time (30 min) was selected due to the great losses of signal at lower times and the maximum time (75 min) because at higher times there was not visible increase of the signal.
13
the volatile compounds at once (Bezerra, Santelli, Oliveira, Villar, & Escaleira, 2008), was 97.7 %.
3.2. Validation of the SPME-GC/QTOF method
3.2.1. Limits of detection (LODs) and quantification (LOQs)
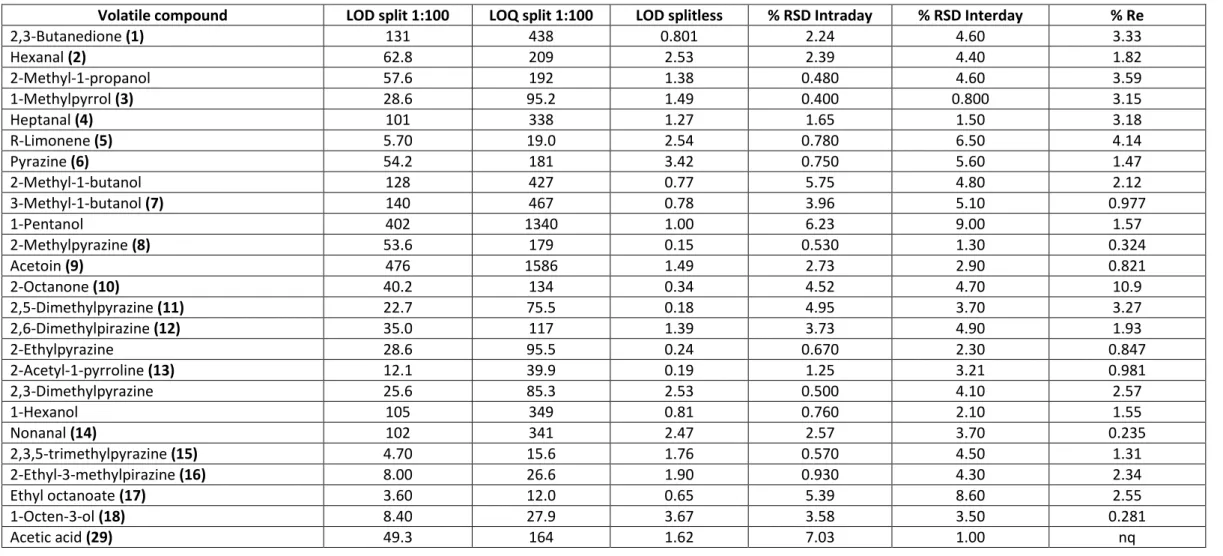
For quantitative purposes, the method was performed in split 1:100 mode, as explained in subsection 2.7. The LODs ranged between 3.60 µg Kg-1 and 1.76 mg Kg-1 while the LOQs were between 12.0 µg Kg-1 and 5.85 mg Kg-1, although the average values were 213 and 709 µg Kg-1, respectively (Table 1).
For semi-quantitative purposes, the method was performed in splitless mode, with LODs ranging between 0.801 µg Kg-1 and 4.46 µg Kg-1 (Table 1). The LODs were much lower because the samples were not diluted.
3.2.2. Precision: intra-day repeatability and inter-day repeatability
Taking results from the quantitative method into consideration, as they allow for drawing better conclusions, the % RSD for intra-day repeatability varied between 0.120% and 7.89%, while values for the inter-day repeatability were between 0.830% and 9.00% (Table 1). Thus, the quantitative method was deemed sufficiently precise with no need for an internal standard.
3.2.3. Linearity and accuracy
14
3.3. Quantification of volatile compounds of commercial wheat bread crust
The results, in µg Kg-1, of the concentration of the 44 volatile compounds quantified in the commercial bread crust sample are shown in Table 2. The most abundant compounds, in decreasing order, were furfural, butyrolactone, acetoin, phenylethyl alcohol, phenylacetaldehyde, 3-methyl-1-butanol, pyrazine, 1-hexanol, 2-methyl-1-propanol and 2-acetylpyrrol, with concentrations higher than 1 mg Kg-1. Furfural has been also reported by Raffo et al. (2015) as the most abundant compound, by far, of the volatile compounds of wheat bread crust analysed by SPME-GC/MS. Phenylacetaldehyde, phenylethyl alcohol, 3-methyl-1-butanol, 1-hexanol and 2-acetylpyrrol were also reported by Raffo et al. (2015) and Pacyński et al. (2015), who also analysed the volatile compounds of wheat bread crust as well as gluten-free bread crust by SPME-GC/MS.
15
broken in the crust, generating volatile compounds too (Moskowitz et al., 2012; Pico et al., 2015). Therefore, 2-acetylpyrrol is the only one generated exclusively by Maillard reactions (Poinot et al., 2010) in the crust.
In accordance with Moskowitz et al. (2012), the main compounds found in our samples generated in the crust have been products of Maillard reactions and lipid oxidation reactions. acetyl-pyrroline, 4-hydroxy-2,5-dimethyl-3(2H)-furanone as well as 2-acetylpyrazine have been reported as the major active volatile compounds from Maillard reactions in wheat bread crust (Moskowitz et al., 2012; Schieberle & Grosch, 1985; Zehentbauer & Grosch, 1998), and 2-(E)-nonenal and 2,4-(E,E)-decadienal have reportedly served as the major active volatile compounds from lipid oxidation reaction (Moskowitz et al., 2012). Consequently, 2-acetyl-1-pyrroline and 2-(E)-nonenal have been selected as the most important aroma contributors due to their high dilution factor (FD) (Schieberle & Grosch, 1991) and their low odour thresholds (OT), which are 0.053 µg Kg-1 and 0.08 µg Kg-1, respectively, in water. Although they were not the most abundant compounds in our samples, all of these volatile compounds have been quantified in the commercial wheat bread crust of the present study.
3.4. Selection of the gluten-free flours or starches in order to quantify the volatile
compounds of the corresponding bread crust: semi-quantitative analyses.
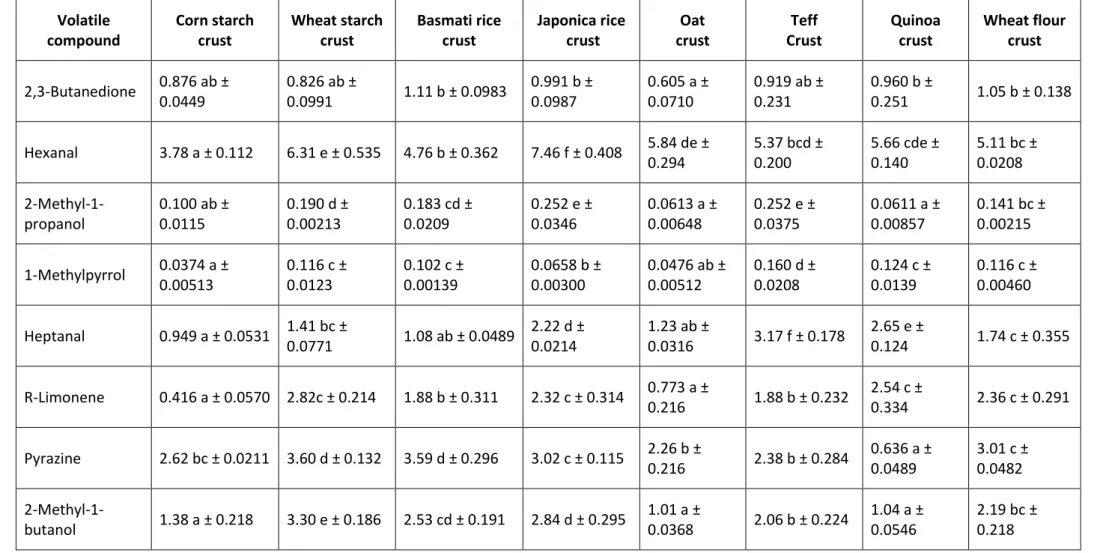
The volatile profile of five crusts of breads made with gluten-free flours (basmati rice, japonica rice, oat, teff and quinoa), two crusts of breads made with starches (corn and wheat) and the crust of wheat bread as a control sample, were studied in a semi-quantitative way in order to select the most suitable gluten-free flour or starch bread crust to be quantified (Table 3).
16
higher than 1 mg Kg-1 were considered. Then, the PCA was constructed with the 30 volatile compounds reported in Table S3, in peak areas, as shown in Figure 1. Moreover, in order to avoid that the highest areas had more importance in the weight of the PCs, the three first PCs were normalised as a correlation matrix (Table S3). Then, only those compounds with normalised PCs higher than 0.700 were taken into consideration in this discussion, which were calculated as the PC multiplied by the square root of the corresponding eigenvalue. These volatile compounds were: pyrazine, 2-methylpyrazine, 2,5,-dimethylpyrazine, 2,3,5-trimethylpyrazine, 2-ethyl-3-methylpyrazine, all from the Maillard reaction, and 2-(E)-nonenal, 2,4-(E,E)-decadienal and benzaldehyde, from lipid oxidation.
17
reactions. Additionally, furan derivatives have been reported to contribute to the colour of the heated food (Hofmann, 1998). Concretely, furfuryl alcohol has been reported to polymerise in acidic conditions to aliphatic polymers that give a brown colouration to the bread (Okaru & Lachenmeier, 2017). Wheat flour crust presented the highest abundance of furfuryl alcohol, which can explain it darkest colour.
Moreover, the similarity between wheat starch crust and wheat flour crust, most notably regarding the negative PC2, was related to the high content of pyrazines. Finally, the highest proportion of 2-ACPY was found in oat crust, although it was located opposite to wheat bread and its use was disregarded.
As a consequence, the crusts were distinguished mainly due to their content in pyrazines, 2-ACPY, 2-(E)-nonenal and 2,4-(E,E)-decadienal, as it was explained in sub-section 3.3. Therefore, since rice crust and teff crust were located near to wheat crust, they were selected to be quantified. Due to the high content of pyrazines, wheat starch crust was also selected to be quantified and basmati crust was chosen in order to study the effect of other varieties of rice.
3.5. Quantification of the volatile compounds of the selected gluten-free bread crusts:
improvement of gluten-free bread crust aroma
Forty-two volatile compounds from wheat starch bread crust as well as teff, japonica rice and basmati rice bread crusts were quantified (Table 2). Wheat bread crust served as a control sample and acetic acid and furfuryl alcohol were excluded from the quantification, since their R2 values were lower than 0.99 and they did not pass the t-test for linearity.
18
concentration of each volatile compound, in µg Kg-1, is shown in Figure 2. Regarding the scores plot, basmati bread crust and wheat bread crust were located in the negative PC1 while wheat starch, rice and teff bread crusts were found in the positive PC1. In the negative PC1 of the loadings plot there were only 4 volatile compounds, which meant that both breads presented a less complex volatile profile in the crust. Basmatic crust was characterised by the highest content in 2-(E)-nonenal and limonene while wheat crust was characterised by the highest content in 4-hydroxy-2,5-dimethyl-3(2H)-furanone (similar to the content in wheat starch). The content of 2-(E)-nonenal in wheat crust was the second highest, almost 3 times higher than the third one (teff crust). Thus, the main difference between wheat crust and rice, teff and wheat starch crusts should be found in the content of 2-(E)-nonenal. There are some controversies about the impact of 2-(E)-nonenal on the final aroma of bread, since it has been reported as correlating positively with green notes (Hansen & Hansen, 1996; Salim-ur-Rehman, Paterson, & Piggott, 2006), but also negatively with fatty notes (Quílez, Ruiz, & Romero, 2006). In fact, it has been reported as one of the volatile compounds responsible for the staling of bread (Zehentbauer & Grosch, 1998). Regarding the negative notes generated during the staling of bread, the lower concentration of 2-(E)-nonenal in wheat starch, teff and rice crusts could be considered a positive attribute for gluten-free breads. Finally, although it contributed minimally to the correlation matrix (Table S3), 4-hydroxy-2,5-dimethyl-3(2H)-furanone from Maillard reactions (Moskowitz et al., 2012) has been reported as an important contributor to crust aroma (Zehentbauer & Grosch, 1998), with a caramel-like smell (Moskowitz et al., 2012).
19
20
Within the positive PC1, teff crust (negative component of the PC2) was separated from rice and wheat starch crust (positive component of the PC2). Higher contents of heptanal, 2,4-decadienal, 1-methylpyrrol and 2,5-dimethylpyrazine found in rice and wheat starch crusts compared to teff crust could explain this separation; meanwhile, teff was characterised by the highest content in fermentation volatile compounds like acetoin, phenylacetaldehyde and 3-methylbutanoic acid. However, these three fermentation volatile compounds did not show high values of correlation (Table S3), probably because their presence depended on the migration from the crumb to the crust and not on their homogeneous generation in the crust. The same occurred with the highest content of 3-methyl-1-butanol in wheat starch crust, which had a content similar to that of wheat flour crust. Heptanal and 2,4-decadienal, with correlation values higher than 0.70, are lipid oxidation volatile compounds (Birch et al., 2014) with the highest concentration in rice, probably due to the same reasons explained for octen-3-ol. 1-Methylpyrrol as well as 2,5-dimethylpyrazine, both volatile compounds from the Maillard reaction (Poinot et al., 2008b), had high values of correlation, although they have not been reported as important contributors to the crust aroma.
Therefore, the gluten-free bread crusts were mainly distinguished by their contents of volatile compounds from lipid oxidation and Maillard reactions, which have been reported as the main compounds in the crust of wheat bread (Moskowitz et al., 2012), as it was explained in sub-section 3.4. For wheat bread crust, the control sample, the most abundant volatile compound was 4-hydroxy-2,5-dimethyl-3(2H)-furanone (26.8 µg Kg -1
21
similar (0.0459 µg Kg-1, 0.0398 µg Kg-1 and 0.0321 µg Kg-1, respectively), explaining the likeness of teff and wheat starch crusts regarding wheat flour crust. In the case of teff crust, 2-ACPY was the most abundant compound followed by 2-ethyl-3-methylpyrazine (32.1 µg Kg-1), while in the case of wheat starch crust 2,3,5-trimethylpyrazine was the most abundant (48.1 µg Kg-1) and 2-ACPY was second in abundance. Therefore, a suitable mixture between wheat starch and teff flour was suggested in order to improve the final aroma of gluten-free bread.
By contrast, Pacyński et al. (2015) reported that their gluten-free breads were characterised by a lack of pyrazines and 2-acetyl-1-pyrroline compared to the control wheat bread. However, we found contents of pyrazines that varied between 0.440 and 48.1 µg Kg-1 among the four gluten-free breads and contents of 2-ACPY that varied between 0.210 and 39.8 µg Kg-1. The differences are surprising since Pacyński et al. (2015) added, besides corn and wheat starches, sources of amino acids and sugars that encourage the Maillard reaction, like glucose, milk powder and egg. Therefore, it would be expected that pyrazines and other compounds from Maillard reaction were found in the gluten-free breads studied by Pacyński et al. (2015).
4. Conclusions
22
commercial wheat bread crust. Furfural, which comes from Maillard reactions and caramelisation processes, was the most abundant compound in the commercial wheat flour bread crust, corresponding with the literature. Four selected gluten-free bread crusts (rice, basmati, teff and wheat starch) were also quantified and compared with a wheat bread crust control sample. It was concluded that wheat starch crust as well as teff crust were the closest to the control wheat crust due to their similar contents in 2-acetyl-1-pyrroline (2-ACPY), 4-hydroxy-2,5-dimethyl-3(2H)-furanone and pyrazines, which have been reported as main compounds in wheat bread crust.
Acknowledgements
Joana Pico and Laura Román would like to thank the University of Valladolid for her PhD fellowships. The authors acknowledge the financial support of the Spanish Ministry of Economy and Competitiveness (Project AGL2014-52928-C2-2-R) and the European Regional Development Fund (FEDER). The authors would like to thank Anna Hayes for the revision of the English scientific language. Finally, the authors want also to thank Eptes (Vevey, Switzerland) for their kindness when we purchased the 2-acetyl-1-pyrroline standard.
References
AOAC guideline (2002). Last access 5th December 2017
https://www.aoac.org/aoac_prod_imis/AOAC_Docs/StandardsDevelopment/SLV_Guid elines_Dietary_Supplements.pdf
23
Bezerra, M. A., Santelli, R. E., Oliveira, E. P., Villar, L. S., & Escaleira, L. A. (2008). Response surface methodology (RSM) as a tool for optimization in analytical chemistry. Talanta, 76(5), 965–977.
Birch, A. N., Petersen, M. A., & Hansen, Å. S. (2014). Aroma of Wheat Bread Crumb.
Cereal Chemistry, 91 (2), 105–114.
Cho, I. H., & Peterson, D. G. (2010). Chemistry of bread aroma: A review. Food Science and Biotechnology, 19(3), 575–582.
Hansen, Å. S, & Hansen, B. (1996). Flavour of sourdough wheat bread crumb.
Zeitschrift Für Lebensmittel-Untersuchung Und -Forschung, 202, 244–249. Inglett, G. E., Chen, D., & Liu, S. X. (2015). Antioxidant Activities of Selective Gluten
Free Ancient Grains. Food and Nutrition Science, 6, 612–621.
Jensen, S., Oestdal, H., Skibsted, L. H., Larsen, E., & Thybo, A. K. (2011). Chemical changes in wheat pan bread during storage and how it affects the sensory perception of aroma, flavour, and taste. Journal of Cereal Science, 53(2), 259–268. Martins, S. I. F. S., Jongen, W. M. F., & Van Boekel, M. A. J. S. (2000). A review of
Maillard reaction in food and implications to kinetic modelling. Trends in Food Science and Technology, 11, 364–373.
Moskowitz, M. R., Bin, Q., Elias, R. J., & Peterson, D. G. (2012). Influence of endogenous ferulic acid in whole wheat flour on bread crust aroma. Journal of Agricultural and Food Chemistry, 60, 11245–11252.
Pacyński, M., Wojtasiak, R. Z., & Mildner-Szkudlarz, S. (2015). Improving the aroma of gluten-free bread. LWT - Food Science and Technology, 63(1), 706–713.
24
Pico, J., Bernal, J., & Gómez, M. (2015). Wheat bread aroma compounds in crumb and crust: A review. Food Research International, 75, 200–215.
Pico, J., del Nozal, M.J., Bernal, J., & Gómez, M. (2017). Inhibition of fermentation evolution in bread doughs for aroma analyses. Flavour and Fragance Journal, DOI: 10.1002/ffj.3405.
Pico, J., Tapia, J., Bernal, J., & Gómez, M. (2017). Comparison of different extraction methodologies for the analysis of volatile compounds in gluten-free flours and corn
starch by GC/QTOF. Food Chemistry,
http://dx.doi.org/10.1016/j.foodchem.2017.06.157.
Plessas, S., Alexopoulos, A., Bekatorou, A., Mantzourani, I., Koutinas, A. A., & Bezirtzoglou, E. (2011). Examination of freshness degradation of sourdough bread made with kefir through monitoring the aroma volatile composition during storage.
Food Chemistry, 124(2), 627–633.
Plessas, S., Fisher, A., Koureta, K., Psarianos, C., Nigam, P., & Koutinas, A. A. (2008). Application of Kluyveromyces marxianus, Lactobacillus delbrueckii ssp. bulgaricus and L. helveticus for sourdough bread making. Food Chemistry, 106, 985–990.
Poinot, P., Arvisenet, G., Grua-Priol, J., Colas, D., Fillonneau, C., Le Bail, A., & Prost, C. (2008). Influence of formulation and process on the aromatic profile and physical characteristics of bread. Journal of Cereal Science, 48(3), 686–697. Poinot, P., Arvisenet, G., Grua-Priol, J., Fillonneau, C., Le-Bail, A., & Prost, C. (2010).
25
Poinot, P., Grua-Priol, J., Arvisenet, G., Rannou, C., Semenou, M., Bail, A. Le, & Prost, C. (2007). Optimisation of HS-SPME to study representativeness of partially baked bread odorant extracts. Food Research International, 40, 1170–1184.
Quílez, J., Ruiz, J. A., & Romero, M. P. (2006). Relationships between sensory flavor evaluation and volatile and nonvolatile compounds in commercial wheat bread type baguette. Journal of Food Science, 71.
Raffo, A., Carcea, M., Castagna, C., & Magrì, A. (2015). Improvement of a headspace solid phase microextraction-gas chromatography/mass spectrometry method for the analysis of wheat bread volatile compounds. Journal of Chromatography A, 1406, 266–278.
Ribeiro, J. S., Teófilo, R. F., Augusto, F., & Ferreira, M. M. C. (2010). Simultaneous optimization of the microextraction of coffee volatiles using response surface methodology and principal component analysis. Chemometrics and Intelligent Laboratory Systems, 102(1), 45–52.
Salim-ur-Rehman, Paterson, A., & Piggott, J. R. (2006). Flavour in sourdough breads: a review. Trends in Food Science and Technology, 17, 557–566.
Schieberle, P., & Grosch, W. (1985). Identification of the volatile flavour compounds of wheat bread crust - comparison with rye bread crust. Zeitschrift Für Lebensmittel-Untersuchung Und -Forschung, 180, 474–478.
Schieberle, P., & Grosch, W. (1991). Potent odorants of the wheat bread crumb Differences to the crust and effect of a longer dough fermentation. Zeitschrift Für Lebensmittel-Untersuchung Und -Forschung, 192, 130–135.
26
Wongdechsarekul, S., & Kongkiattikajorn, J. (2010). Storage time affects storage proteins and volatile compounds , and pasting behavior of milled rice. KKU Research Journal, 15(9), 852–862.
27
Table 1. LODs and LOQs (in µg Kg-1), repeatability (%RSD) and accuracy (%Re) of the 44 studied volatile compounds with proposed quantitative method. The LODs of the qualitative method are also given.The numeration given in parentheses of each volatile compound corresponds to the number assigned in the
corresponding PCA (Figures 1 and 2).
Volatile compound LOD split 1:100 LOQ split 1:100 LOD splitless % RSD Intraday % RSD Interday % Re
2,3-Butanedione (1) 131 438 0.801 2.24 4.60 3.33
Hexanal (2) 62.8 209 2.53 2.39 4.40 1.82
2-Methyl-1-propanol 57.6 192 1.38 0.480 4.60 3.59
1-Methylpyrrol (3) 28.6 95.2 1.49 0.400 0.800 3.15
Heptanal (4) 101 338 1.27 1.65 1.50 3.18
R-Limonene (5) 5.70 19.0 2.54 0.780 6.50 4.14
Pyrazine (6) 54.2 181 3.42 0.750 5.60 1.47
2-Methyl-1-butanol 128 427 0.77 5.75 4.80 2.12
3-Methyl-1-butanol (7) 140 467 0.78 3.96 5.10 0.977
1-Pentanol 402 1340 1.00 6.23 9.00 1.57
2-Methylpyrazine (8) 53.6 179 0.15 0.530 1.30 0.324
Acetoin (9) 476 1586 1.49 2.73 2.90 0.821
2-Octanone (10) 40.2 134 0.34 4.52 4.70 10.9
2,5-Dimethylpyrazine (11) 22.7 75.5 0.18 4.95 3.70 3.27
2,6-Dimethylpirazine (12) 35.0 117 1.39 3.73 4.90 1.93
2-Ethylpyrazine 28.6 95.5 0.24 0.670 2.30 0.847
2-Acetyl-1-pyrroline (13) 12.1 39.9 0.19 1.25 3.21 0.981
2,3-Dimethylpyrazine 25.6 85.3 2.53 0.500 4.10 2.57
1-Hexanol 105 349 0.81 0.760 2.10 1.55
Nonanal (14) 102 341 2.47 2.57 3.70 0.235
2,3,5-trimethylpyrazine (15) 4.70 15.6 1.76 0.570 4.50 1.31
2-Ethyl-3-methylpirazine (16) 8.00 26.6 1.90 0.930 4.30 2.34
Ethyl octanoate (17) 3.60 12.0 0.65 5.39 8.60 2.55
1-Octen-3-ol (18) 8.40 27.9 3.67 3.58 3.50 0.281
28
Table 1. (continued)
Volatile compound LOD split 1:100 LOQ split 1:100 LOD splitless % RSD Intraday % RSD Interday % Relative error
Furfural 50.3 168 3.61 2.38 2.70 7.02
2-Ethyl-1-hexanol (19) 22.6 75.4 2.01 5.17 4.80 0.648
Benzaldehyde (20) 19.7 65.7 1.84 0.830 4.10 0.085
2-(E)-Nonenal (21) 43.6 146 1.91 1.13 3.10 12.2
5-Methyl-2-furaldehyde 87.7 292 0.21 0.130 2.40 3.94
Butyrolactone 743 2477 1.38 4.42 7.40 5.14
2-Acetilpyrazine (22) 15.3 51.0 0.95 1.27 4.90 2.56
Butyric acid (23) 392 1307 0.81 1.31 2.50 1.58
Phenylacetaldehyde(24) 28.50 94.8 0.68 1.32 2.20 0.683
Furfuryl alcohol (30) 66.6 222 1.93 1.84 4.10 nq
2-Methylbutyric acid 225 751 4.46 5.51 1.20 2.58
3-Methylbutyric acid (25) 667 2224 3.17 7.89 1.50 0.229
2,4-(E,E)-Decadienal (26) 25.9 86.3 1.73 5.20 4.30 3.05
Hexanoic acid 1540 5132 0.85 0.120 2.40 0.374
Benzyl alcohol 67.8 226 0.77 0.560 7.20 1.66
Phenylethyl alcohol 48.8 163 2.76 3.91 8.60 0.425
2-Acetylpyrrol 290 966 1.34 3.86 4.90 1.68
4-Hydroxy-2,5-dimethyl-3(2H)-furanone (27) 1755 5851 3.61 3.74 2.70 0.945
4-Vinylguaiacol (28) 985 3284 3.15 3.73 5.20 1.83
29
Table 2. Concentration, in µg Kg-1, of the 44 studied volatile compounds in the crusts of wheat, basmati rice, japonica rice, wheat starch and teff breads as well as in the commercial bread. Values are means of three determinations ± SD. Different letters in the same rowshow the significant differences,excluding the
commercial crust.
Volatile compound
µg Kg-1 wheat flour
crust
µg Kg-1 basmati rice
crust
µg Kg-1 japonica rice
crust
µg Kg-1 wheat starch
crust
µg Kg-1 teff crust
µg Kg-1 commercial
crust
2,3-Butanedione 4.98 a ± 0.112 5.21 a ± 0.117 44.3 d ± 0.992 13.0 b ± 0.291 19.1 c ± 0.427 0.824 ± 0.427
Hexanal 4.36 b ± 0.104 7.06 c ± 0.169 16.7 d ± 0.400 1.69 a ± 0.0404 17.1 d ± 0.409 0.907 ± 0.409
2-Methyl-1-propanol 8.93 b ± 0.0429 14.3 c ± 0.0686 71.4 e ± 0.343 1.09 a ± 0.00523 17.8 d ± 0.0852 1.04 ± 0.0852
1-Methylpyrrol 1.40 b ± 0.00560 0.0700 a ± 0.000280 2.10 d ± 0.00840 2.13 d ± 0.00852 1.62 c ± 0.00648 0.386 ± 0.00648
Heptanal 14.2 c ± 0.235 0.500 a ± 0.00825 20.6 e ± 0.340 16.9 d ± 0.279 6.06 b ± 0.100 0.903 ± 0.100
R-Limonene
0.0100 a
±0.0000780 11.5 e ± 0.0895 0.220 b ± 0.00172 1.49 c ± 0.0116 1.90 d ± 0.0148 0.118 ± 0.0148
Pyrazine 4.21 b ± 0.0316 0.920 a ± 0.00690 7.70 d ± 0.0578 6.75 c ± 0.0506 9.77 e ± 0.0733 1.11 ± 0.0733
2-Methyl-1-butanol 7.49 c ± 0.431 3.32 a ± 0.191 5.29 b ± 0.304 4.81 ab ± 0.277 12.4 d ± 0.714 0.676 ± 0.714
3-Methyl-1-butanol 10.5 c ± 0.417 8.63 b ± 0.342 10.7 c ± 0.424 11.1 c ± 0.438 6.94 a ± 0.275 1.56 ± 0.275
1-Pentanol 1.88 a ± 0.117 6.77 c ± 0.422 4.90 b ± 0.305 4.64 b ± 0.289 6.64 c ± 0.414 0.609 ± 0.414
2-Methylpyrazine 14.0 d ± 0.0741 1.57 a ± 0.00832 19.8 e ± 0.105 11.5 b ± 0.0612 12.4 c ± 0.0657 0.871 ± 0.0657
Acetoin 9.36 c ± 0.256 4.30 a ± 0.117 7.71 b ± 0.210 9.38 c ± 0.256 27.8 d ± 0.758 4.34 ± 0.758
2-Octanone 21.8 d ± 0.983 0.640 a ± 0.0289 14.0 c ± 0.633 10.8 b ± 0.488 10.2 b ± 0.461
0.000100 ± 0.461
2,5-Dimethylpyrazine 10.7 b ± 0.532 0.820 a ± 0.0406 38.1 d ± 1.89 23.2 c ± 1.15 0.790 a ± 0.0391 0.143 ± 0.0391
30
Table 2. (continued)
Volatile compound
µg Kg-1 wheat flour
crust
µg Kg-1 basmati rice
crust
µg Kg-1 japonica rice
crust
µg Kg-1 wheat starch
crust
µg Kg-1 teff crust
µg Kg-1 commercial
crust
2-Ethylpyrazine 6.52 d ± 0.0437 0.860 c ± 0.00576 0.330 a ± 0.00221 8.09 e ± 0.0542 0.640 b ± 0.00429 0.358 ± 0.00429
2-Acetyl-1-pyrroline
0.0459 e ± 0.000574
0.000210 a ±
0.00000263 0.00743 b ± 0.0000928
0.0321 c ± 0.000402
0.0398 d ± 0.000498
0.0146 ±0.00022 1
2,3-Dimethylpyrazine 14.9 e ± 0.0744 0.820 a ± 0.00410 5.75 b ± 0.0288 11.3 d ± 0.0564 8.47 c ± 0.04235 0.255 ± 0.04235
1-Hexanol 15.4 c ± 0.117 0.320 a ± 0.00243 0.770 b ± 0.00585 0.700 b ± 0.00532 21.4 d ± 0.163 1.11 ± 0.163
Nonanal 2.95 b ± 0.0758 0.640 a ± 0.0164 4.13 c ± 0.106 2.75 b ± 0.0707 4.21 c ± 0.108 0.0598 ± 0.108
2,3,5-trimethylpyrazine 0.730 a ± 0.00416 0.440 a ± 0.00251 37.1 c ± 0.212 48.1 d ± 0.274 28.9 b ±0.165 0.0661 ± 0.165
2-Ethyl-3-methylpirazine 0.420 a ± 0.00391 0.600 a ± 0.00558 26.8 b ± 0.249 0.460 a ± 0.00428 32.1 c ± 0.298 0.127 ± 0.298
Ethyl octanoate 0.240 a ± 0.0129 0.0900 a ± 0.00485 3.83 c ± 0.206 0.690 b ± 0.0372 0.150 a ± 0.00809 0.360 ± 0.00809
1-Octen-3-ol 4.48 b ± 0.160 0.600 a ± 0.0215 24.1 d ± 0.862 16.5 c ± 0.591 18.5 c ± 0.663 0.338 ± 0.663
Acetic acid nq* nq* nq* nq* nq* nq*
Furfural 7.35 c ± 0.175 4.49 b ± 0.107 0.760 a ± 0.0181 26.1 d ± 0.622 1.10 a ± 0.0262 7.68 ± 0.0262
2-Ethyl-1-hexanol 0.290 a ± 0.0150 0.440 a ± 0.0227 0.250 a ± 0.0129 17.7 b ± 0.913 0.740 a ± 0.0383 0.139 ± 0.0383
Benzaldehyde 0.210 a ± 0.00174 0.340 a ± 0.00282 15.8 b ± 0.131 0.380 a ± 0.00315 0.320 a ± 0.00266 0.116 ± 0.00266
2-(E)-Nonenal 0.970 d ± 0.0110 4.43 e ± 0.0501 0.210 b ± 0.00237
0.0400 a ±
0.000452 0.370 c ± 0.00418
0.0329 ± 0.00418
5-Methyl-2-furaldehyde 0.450 d ± 0.000585 0.0900 a ± 0.000117 0.150 b ± 0.000195 0.220 c ± 0.000286
0.500 e ± 0.000650
31
Table 2. (continued)
Butyrolactone 9.39 c ± 0.415 17.2 d ± 0.762 6.71 ab ± 0.297 8.08 bc ± 0.357 6.15 a ± 0.272 6.48 ± 0.272
2-Acetilpyrazine 12.0 c ± 0.152 0.0600 a ± 0.000762 4.97 b ± 0.0631 0.110 a ± 0.00140
0.130 a ± 0.00165
0.0799 ± 0.00165
Butyric acid 5.28 c ± 0.0692 0.170 a ± 0.00223 8.08 e ± 0.106 2.17 b ± 0.0284 6.55 d ± 0.0858 0.283 ± 0.0858
Phenylacetaldehyde 4.70 c ± 0.0620 2.50 b ± 0.0330 0.610 a ± 0.00805 1.08 a ± 0.0143 22.1 d ± 0.292 1.83 ± 0.292
Furfuryl alcohol nq* nq* nq* nq* nq* nq*
2-Methylbutyric
acid 3.45 b ± 0.190 1.64 a ± 0.0904 9.21 d ± 0.507 3.97 b ± 0.219 6.35 c ± 0.350 0.176 ± 0.350
3-Methylbutyric
acid 4.74 b ± 0.374 2.41 a ± 0.190 5.49 b ± 0.433 9.32 c ± 0.735 12.6 d ± 0.996 0.397 ± 0.996
2,4-(E,E)-Decadienal 0.110 a ± 0.00572 0.350 b ± 0.0182 1.13 d ± 0.0588 0.630 c ± 0.0328 0.450 b ± 0.0234 0.0247 ± 0.0234
Hexanoic acid 13.0 c ± 0.0156 18.3 e ± 0.0219 15.0 d ± 0.0180 2.54 a ± 0.00305 10.8 b ± 0.0130 0.0246 ± 0.0130
Benzyl alcohol 0.290 a ± 0.00162 0.160 a ± 0.000896 34.4 b ± 0.193 0.220 a ± 0.00123
0.110 a ± 0.000616
0.104 ± 0.000616
Phenylethyl alcohol 13.0 b ± 0.510 5.54 a ± 0.217 56.5 d ± 2.21 2.02 a ± 0.0790 18.6 c ± 0.726 3.59 ± 0.726
2-Acetylpyrrol 4.38 b ± 0.169 0.450 a ± 0.0174 0.300 a ± 0.0116 27.6 c ± 1.06 5.97 b ± 0.230 1.02 ± 0.230
4-Hydroxy-2,5-
dimethyl-3(2H)-furanone 26.8 e ± 1.00 7.69 b ± 0.288 3.96 a ± 0.148 22.6 d ± 0.845 20.0 c ± 0.746 0.572 ± 0.746
4-Vinylguaiacol 1.93 a ± 0.0720 13.0 c ± 0.486 4.16 b ± 0.155 2.39 a ± 0.0891 22.8 d ± 0.851 0.758 ± 0.851
32
Table 3. Peak areas, divided by 106, of the 44 studied volatile compounds in the crusts of corn starch, wheat starch, basmati, rice, oat, teff, quinoa and wheat breads as well as in the commercial bread. Values are means of three determinations ± SD. Different letters in the same rowshow the significant differences.
Volatile compound Corn starch crust Wheat starch crust Basmati rice crust Japonica rice crust Oat crust Teff Crust Quinoa crust Wheat flour crust
2,3-Butanedione 0.876 ab ± 0.0449
0.826 ab ±
0.0991 1.11 b ± 0.0983
0.991 b ± 0.0987
0.605 a ± 0.0710
0.919 ab ± 0.231
0.960 b ±
0.251 1.05 b ± 0.138
Hexanal 3.78 a ± 0.112 6.31 e ± 0.535 4.76 b ± 0.362 7.46 f ± 0.408 5.84 de ±
0.294
5.37 bcd ± 0.200
5.66 cde ± 0.140
5.11 bc ± 0.0208
2-Methyl-1-propanol
0.100 ab ± 0.0115
0.190 d ± 0.00213
0.183 cd ± 0.0209
0.252 e ± 0.0346
0.0613 a ± 0.00648
0.252 e ± 0.0375
0.0611 a ± 0.00857
0.141 bc ± 0.00215
1-Methylpyrrol 0.0374 a ± 0.00513
0.116 c ± 0.0123
0.102 c ± 0.00139
0.0658 b ± 0.00300
0.0476 ab ± 0.00512
0.160 d ± 0.0208
0.124 c ± 0.0139
0.116 c ± 0.00460
Heptanal 0.949 a ± 0.0531 1.41 bc ±
0.0771 1.08 ab ± 0.0489
2.22 d ± 0.0214
1.23 ab ±
0.0316 3.17 f ± 0.178
2.65 e ±
0.124 1.74 c ± 0.355
R-Limonene 0.416 a ± 0.0570 2.82c ± 0.214 1.88 b ± 0.311 2.32 c ± 0.314 0.773 a ±
0.216 1.88 b ± 0.232
2.54 c ±
0.334 2.36 c ± 0.291
Pyrazine 2.62 bc ± 0.0211 3.60 d ± 0.132 3.59 d ± 0.296 3.02 c ± 0.115 2.26 b ±
0.216 2.38 b ± 0.284
0.636 a ± 0.0489
3.01 c ± 0.0482
2-Methyl-1-butanol 1.38 a ± 0.218 3.30 e ± 0.186 2.53 cd ± 0.191 2.84 d ± 0.295
1.01 a ±
0.0368 2.06 b ± 0.224
1.04 a ± 0.0546
33
Table 3. (continued)
Volatile compound Corn starch crust Wheat starch crust Basmati rice crust Japonica rice crust Oat crust Teff Crust Quinoa crust Wheat flour crust
3-Methyl-1-butanol 2.63 b ± 0.254 3.89 d ± 0.342 3.81 cd ± 0.0323
3.75 cd ± 0.0501
2.28 ab ± 0.113
3.50 c ± 0.0440
2.16 a ± 0.000333
3.65 cd ± 0.132
1-Pentanol 0.216 a ± 0.0319 0.793 bc ±
0.258
0.799 bc ±
0.0745 1.80 d ± 0.305
1.07 c ± 0.0309
0.731 b ± 0.0450
1.07 c ± 0.0225
0.817 bc ± 0.00182
2-Methylpyrazine 0.856 c ± 0.00643
2.14 f ±
0.00514 1.26 e ± 0.0352
1.09 d ± 0.00524
1.22 e ± 0.00658
1.15 d ± 0.0351
0.158 a ± 0.00877
0.773 b ± 0.0589
Acetoin 4.43 ab ± 0.0937 4.18 a ± 0.172 5.19 c ± 0.0738 4.64 b ±
0.0573 5.74 d ± 0.231
4.61 b ± 0.0342
6.32 e ± 0.176
5.97 de ± 0.291
2-Octanone 0.542 ab ±
0.0680
1.42 e ±
0.0662 0.629 c ± 0.0212
0.894 d ± 0.0256
0.366 a ± 0.00951
1.05 d ± 0.150
1.33 e ± 0.137
1.02 d ± 0.140
2,5-Dimethylpyrazine
0.185 b ± 0.0118
0.715 f ± 0.0414
0.338 d ± 0.00568
0.289 c ± 0.0211
0.667 e ± 0.00713
0.358 d ± 0.0166
0.0432 a ± 0.00512
0.179 b ± 0.0199
2,6-Dimethylpirazine
0.190 b ± 0.0154
0.299 d ± 0.00149
0.186 b ± 0.00286
0.184 b ± 0.00158
0.416 e ± 0.0129
0.199 bc ± 0.00468
0.0622 a ± 0.00162
0.221 c ± 0.138
2-Ethylpyrazine 0.0941 b ± 0.00348
0.258 f ± 0.00484
0.157 d ± 0.00361
0.152 d ± 0.00768
0.157 d ± 0.00767
0.210 e ± 0.00940
0.0442 a ± 0.00424
34
Table 3. (continued)
Volatile compound Corn starch crust Wheat starch crust Basmati rice crust Japonica rice crust Oat crust Teff Crust Quinoa crust Wheat flour crust 2-Acetyl-1-pyrroline
0.772 c ±
0.0411 1.07 d± 0.0759 0.690 bc ± 0.105
0.318 a ± 0.00103
1.37 e ± 0.0309
0.366 a ± 0.0878
0.498 ab ± 0.0838
0.317 a ± 0.0518
2,3-Dimethylpyrazine
3.55 b ± 0.00348
5.81 e ±
0.0737 3.65 b ± 0.262 3.48 b ± 0.0415
5.13 d ± 0.0641
3.53 b ± 0.215
0.817 a ± 0.0294
4.18 c ± 0.00460
1-Hexanol 0.591 a ±
0.0934 1.46 c ± 0.212 1.29 c ± 0.129 2.81 d ± 0.106
0.918 b ± 0.0738
3.66 e ± 0.203
3.95 e ± 0.0109
1.53 c ± 0.355
Nonanal 1.64 a ± 0.296 1.57 a ± 0.691 1.31 a ± 0.281 1.83 a ± 0.401 1.80 a ±
0.239
1.72 a ± 0.497
1.93 a ± 0.401
1.75 a ± 0.291
2,3,5-trimethylpyrazine
0.111 b ± 0.00363
0.567 f ±
0.0370 0.162 c ± 0.0150
0.144 bc ± 0.00613
0.333 e ± 0.00146
0.200 d ± 0.000373
0.0445 a ± 0.00381
0.127 b ± 0.0482
2-Ethyl-3-methylpirazine 1.84 b ± 0.0624
4.90 g ±
0.0361 2.20 c ± 0.102 2.44 cd ± 0.187
3.48 e ± 0.242
3.80 f ± 0.128
0.777 a ± 0.0109
2.61 d ± 0.218
Ethyl octanoate 2.88 ab ± 0.458 4.40 cd ±
0.485 3.34 bc ± 0.517 3.12 ab ± 0.482
1.97 a ± 0.235
4.75 d ± 0.317
4.05 bcd ± 0.840
3.32 bc ± 0.132
1-Octen-3-ol 0.0523 c
±0.0000341
0.0293 ab ± 0.00329
0.0319 b ± 0.00522
0.0323 b ± 0.00702
0.0214 a ± 0.00223
0.0500 c ± 0.00724
0.028 ab±0.00446
35
Table 3. (continued)
Volatile compound Corn starch crust Wheat starch crust Basmati rice crust Japonica rice crust Oat crust Teff Crust Quinoa crust Wheat flour crust
Acetic acid 0.961 a ± 0.114 1.62 bc ±
0.0788 1.55 bc ± 0.130 1.49 b ± 0.126
1.49 b ± 0.0580
2.06 d ± 0.178
2.98 e ± 0.286
1.88 cd ± 0.131
Furfural 0.436 b ±
0.0367
0.437 b ± 0.0255
0.482 bc ±
0.0248 0.541 c ± 0.0185
0.232 a ± 0.00130
2.27 e ± 0.0704
4.58 f ± 0.0714
2.17 d ± 0.0272
2-Ethyl-1-hexanol 0.598 b ± 0.0629
0.602 b ± 0.113
0.536 ab ± 0.0442
0.562 b ± 0.0388
0.515 ab ± 0.00605
0.421 a ± 0.00181
0.425 a ± 0.00735
0.535 ab ± 0.00725
Benzaldehyde 0.0514 a ±
0.00504
0.083 ab ± 0.00903
0.138 bc ± 0.0216
0.141 bc ± 0.00224
0.101 abc ± 0.0123
0.122 abc ± 0.00890
0.166 c ± 0.0710
0.147 bc ± 0.0536
2-(E)-Nonenal 0.0519 bc ±
0.00477
0.023 a ± 0.00167
0.0473 b ± 0.00677
0.0630 c ± 0.00108
0.0463 b ± 0.00374
0.0796 d ± 0.00711
0.0853d ± 0.00922
0.0619 c ± 0.00744
5-Methyl-2-furaldehyde
0.0719 a ± 0.00133
0.088 a ± 0.000283
0.0860 a ± 0.00667
0.0896 a ± 0.00323
0.0760 a ± 0.00461
0.735 c ± 0.0229
1.89 d ± 0.0363
0.414 b ± 0.00920
Butyrolactone 2.59 b ± 0.308 2.08 ab ±
0.409 2.08 ab ± 0.117 1.79 a ± 0.249
2.59 b ± 0.221
4.40 d ± 0.381
4.01 cd ± 0.175
3.54 c ± 0.151
2-Acetilpyrazine 0.0986 a ± 0.00782
0.131 ab ± 0.0320
0.233 cd ± 0.0284
0.140 ab ± 0.0339
0.268 d ± 0.0189
0.198 bc ± 0.0334
0.0953a ±0.000390
0.246 cd ± 0.0487
Butyric acid 0.0507 a ±
0.00442
0.527 b ± 0.0572
0.0515 a ± 0.00144
0.0586 a ± 0.00337
0.0329 a ± 0.00164
0.0550 a ± 0.00586
0.0500±0.0 00718
0.0460 a ± 0.00252
Phenylacetaldehyde 1.58 e ± 0.174 1.55 e ± 0.0777
0.739 cd ± 0.00331
0.917 d ± 0.0896
0.321 a ± 0.0467
0.662 bc ± 0.0554
0.507 ab ± 0.0534
0.430 a ± 0.0339
Furfuryl alcohol 0.906 c ± 0.0472 1.08 d ± 0.0303
0.845 bc ± 0.00720
0.922 c ± 0.00571
0.538 a ± 0.0101
0.753 b ± 0.0505
2.15 e ± 0.0782
3.24 f ± 0.0649 2-Methylbutyric
acid 2.08 a ± 0.323 3.25 b ± 0.677 2.99 ab ± 0.485 3.22 b ± 0.663
2.01 a ± 0.283
3.31 b ± 0.439
2.42 ab ± 0.217
36
Table 3. (continued)
Volatile compound Corn starch crust Wheat starch crust Basmati rice crust Japonica rice crust Oat crust Teff Crust Quinoa crust Wheat flour crust 3-Methylbutyric
acid 2.29 ab ± 0.374 2.94 bc ± 0.518 2.90 bc ± 0.545 3.16 c ± 0.421
1.73 a ± 0.153
3.35 c ± 0.229
2.67 bc ± 0.171
3.36 c ± 0.270
2,4-(E,E)-Decadienal 0.0381a± 0.00138 0.147b± 0.0198
0.0395a±
0.00303 0.152b± 0.0195
0.0432a± 0.00147 0.0521a±0.0 0427 0.525c± 0.0568
0.0602 a ± 0.00822
Hexanoic acid 0.0312ab±
0.000241 0.147c± 0.00238
0.0543ab± 0.00689 0.0831b± 0.00375 0.0249a± 0.00144 0.445e± 0.0637 0.271d± 0.0201
0.0480 ab ± 0.000601
Benzyl alcohol 0.853 a ± 0.250 1.20 a ± 0.338 1.44 a ± 0.284 8.01 c ± 0.664 4.66 b ± 0.431
1.070 a ± 0.261
4.91 b ± 0.356
0.827 a ± 0.104
Phenylethyl
alcohol 0.772 a ± 0.0742 1.79 c ± 0.108 1.62 c ± 0.0223 1.20 b ± 0.115
0.653 a ± 0.0478
1.10 b ± 0.0265
0.806 a ± 0.0570
2.02 c ± 0.183
2-Acetylpyrrol 2.28 b ± 0.165 1.68 a ± 0.237 2.44 b ± 0.0961 2.57 bc ± 0.260 2.55 bc ± 0.160
3.44 d ± 0.209
4.31 e ± 0.267
2.94 c ± 0.00399
4-Hydroxy-2,5- dimethyl-3(2H)-furanone
0.0484 a ± 0.0127 0.0238 a ± 0.00371
0.0853ab ± 0.00224
0.0719ab ± 0.00324
0.116 bc ± 0.0102 0.160c± 0.000359 0.495 e± 0.0652 0.289 d± 0.0424
4-Vinylguaiacol 0.108 cd± 0.0154 0.0200a ± 0.000557 0.102 bcd± 0.00686 0.0688 abc± 0.00524 0.0487ab ± 0.00266
0.155 d ± 0.00776
0.765 e ± 0.0661
37
Table S1. Peak areas, divided into 106, of the 44 studied volatile compounds found with the four fibres tested. The Kovats index (KI) calculated for each volatile compound as well as the KI found in the literature are also given. Different letters in the same rowshow the significant differences.
Volatile compounds KI
calculated
KI
literature DVB/CAR/PDMS CAR/PDMS PDMS/DVB Polyacrylate
2,3-Butanedione 978 984 1.59 d 1.42 c 0.270 b nd* a
Hexanal 1060 1080 3.84 c 4.84 d 0.853 b 0.115 a
2-Methyl-1-propanol 1073 1052 0.657 b 1.18 c 0.0659 a 0.0456 a
1-Methylpyrrol 1013 1140 0.0664 c 0.115 c 0.0179 b nd* a
Heptanal 1141 1168 0.117 b 0.122 b 0.186 c nd* a
R-Limonene 1154 1202 0.803 c 0.442 b 0.917 d 0.0139 a
Pyrazine 1207 1216 2.80 c 4.61 d 0.685 b 0.103 a
2-Methyl-1-butanol 1207 1218 1.32 b 1.32 b 0.116 a 0.0315 a
3-Methyl-1-butanol 1207 1218 2.94 b 3.31 c 0.288 a 0.0766 a
1-Pentanol 1251 1257 0.449 c 0.697 d 0.141 b 0.0261 a
2-Methylpyrazine 1259 1268 2.66 c 5.83 d 1.83 b 0.175 a
Acetoin 1279 1286 9.29 c 17.9 d 3.74 b 1.96 a
2-Octanone 1279 1283 0.0364 b 0.0945 c nd* a nd* a
2,5-Dimethylpyrazine 1315 1316 0.152 b 0.143 b 0.214 c 0.0123 a
2,6-Dimethylpirazine 1321 1319 0.192 b 0.190 b 0.304 c 0.0181 a
2-Ethylpyrazine 1326 1323 0.402 b 0.300 c 0.381 c 0.0261 a
2-Acetyl-1-pyrroline 1326 1325 0.468 c 0.306 b 0.773 d 0.0495 a
2,3-Dimethylpyrazine 1331 1330 0.277 b 0.327 c 0.311 c nd* a
1-Hexanol 1353 1359 0.182 b 0.416 c 0.198 b 0.0316 a
Nonanal 1388 1396 0.185 c 0.0606 b 0.508 d 0.0315 a
2,3,5-trimethylpyrazine 1395 1396 0.240 c 0.100 b 0.224 c 0.0171 a
2-Ethyl-3-methylpirazine 1395 1400 0.110 c 0.0720 b 0.114 c 0.00862 a
Ethyl octanoate 1432 1437 0.120 b 0.0360 a 0.285 c 0.0277 a
38
Table S1. (continued)
Volatile compounds KI
calculated
KI
literature DVB/CAR/PDMS CAR/PDMS PDMS/DVB Polyacrylate
Acetic acid 1445 1465 15.4 b 22.0 c 3.95 a 4.80 a
Furfural 1461 1467 6.03 c 7.44 d 2.58 b 0.753 a
2-Ethyl-1-hexanol 1490 1489 0.544 c 0.579 c 0.307 b 0.0396 a
Benzaldehyde 1511 1521 0.722 b 0.829 c 1.29 d 0.106 a
2-(E)-Nonenal 1526 1546 1.01 b 0.271 a 2.13 c 0.185 a
5-Methyl-2-furaldehyde 1566 1574 0.251 b 0.304 c 0.348 d 0.0414 a
Butyrolactone 1610 1622 2.09 c 2.45 d 0.697 b 0.432 a
2-Acetilpyrazine 1613 1614 0.120 d 0.0433 b 0.0834 c 0.0263 a
Butyric acid 1623 1636 2.59 c 3.49 d 0.606 b 0.356 a
Phenylacetaldehyde 1630 1642 2.66 b 0.956 a 4.51 c 0.774 a
Furfuryl alcohol 1657 1666 5.75 c 6.92 d 4.21 b 3.15 a
2-Methylbutyric acid 1663 1674 0.943 c 1.19 d 0.351 b 0.150 a
3-Methylbutyric acid 1663 1679 0.768 c 0.900 d 0.210 b 0.104 a
2,4-(E,E)-Decadienal 1797 1797 0.614 c 0.0539 a 1.68 d 0.332 b
Hexanoic acid 1904 1880 4.51 c 3.75 b 4.14 bc 2.10 a
Benzyl alcohol 1962 1893 0.393 c 0.314 b 0.705 d 0.255 a
Phenylethyl alcohol 2041 1942 4.90 c 2.86 a 6.05 d 3.42 b
2-Acetylpyrrol 2168 1950 0.884 b 0.673 a 1.40 c 0.647 a
4-Hydroxy-2,5-dimethyl-3(2H)-furanone 2205 2020 0.500 c 0.0542 a 0.788 d 0.308 b
4-Vinylguaiacol 2253 2230 0.544 b 0.126 a 0.786 c 0.601 b
39
Table S2. Optimisation parameters of the proposed SPME method. The matrix of experimentation as well as the principal components (PC1, PC2) and the desirability of the
multiple RSM for each experience are given.
Set Weight (g) Time (min) Temperature (T) PC1 PC2 Desirability
1 0.500 51.0 50.0 -1.95 1.51 0.542
2 0.750 51.0 50.0 0.21 3.08 0.709
3 0.250 51.0 50.0 -5.44 -1.23 0.259
4 0.500 51.0 70.0 7.36 -4.58 0.000
5 0.500 51.0 40.0 -7.92 -1.08 0.000
6 0.500 75.0 50.0 -0.76 0.42 0.538
7 0.500 30.0 50.0 -4.39 -0.29 0.350
8 0.500 51.0 60.0 4.64 -0.58 0.637
40
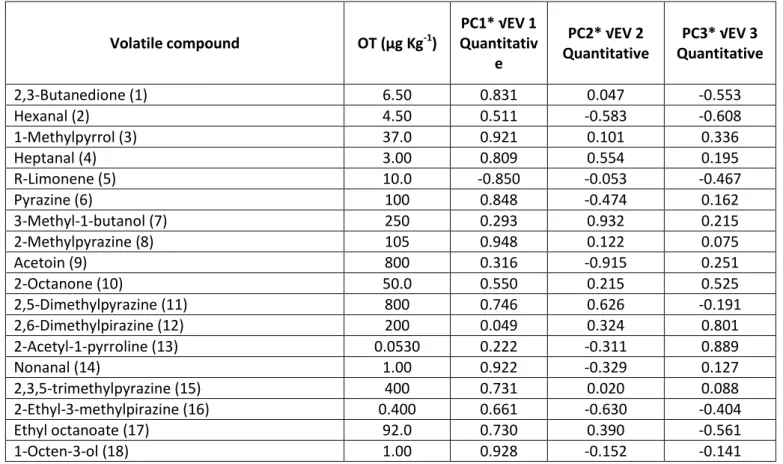
Table S3. Correlation parameters found for the volatile compounds that presented odour thresholds (OT) lower than 1 mg Kg-1 in the quantitative methodology. The OT lower than 1 mg Kg-1 are also given.
Volatile compound OT (µg Kg-1)
PC1* √EV 1 Quantitativ
e
PC2* √EV 2 Quantitative
PC3* √EV 3 Quantitative
2,3-Butanedione (1) 6.50 0.831 0.047 -0.553
Hexanal (2) 4.50 0.511 -0.583 -0.608
1-Methylpyrrol (3) 37.0 0.921 0.101 0.336
Heptanal (4) 3.00 0.809 0.554 0.195
R-Limonene (5) 10.0 -0.850 -0.053 -0.467
Pyrazine (6) 100 0.848 -0.474 0.162
3-Methyl-1-butanol (7) 250 0.293 0.932 0.215
2-Methylpyrazine (8) 105 0.948 0.122 0.075
Acetoin (9) 800 0.316 -0.915 0.251
2-Octanone (10) 50.0 0.550 0.215 0.525
2,5-Dimethylpyrazine (11) 800 0.746 0.626 -0.191
2,6-Dimethylpirazine (12) 200 0.049 0.324 0.801
2-Acetyl-1-pyrroline (13) 0.0530 0.222 -0.311 0.889
Nonanal (14) 1.00 0.922 -0.329 0.127
2,3,5-trimethylpyrazine (15) 400 0.731 0.020 0.088
2-Ethyl-3-methylpirazine (16) 0.400 0.661 -0.630 -0.404
Ethyl octanoate (17) 92.0 0.730 0.390 -0.561
41
Table S3. (continued)
Volatile compound OT (µg K-1) PC1* √EV 1
Quantitative
PC2* √EV 2 Quantitative
PC3* √EV 3 Quantitative
2-Ethyl-1-hexanol (19) 138 0.106 0.333 0.535
Benzaldehyde (20) 350 0.682 0.321 -0.646
2-(E)-Nonenal (21) 0.0800 -0.894 0.053 -0.441
2-Acetylpyrazine (22) 62.0 0.164 0.378 0.280
Butyric acid (23) 240 0.851 -0.243 -0.105
Phenylacetaldehyde (24) 4.00 0.091 -0.979 0.162
3-Methylbutyric acid (25) 120 0.490 -0.661 0.420
2,4-(E,E)-Decadienal (26) 0.100 0.714 0.228 -0.554
4-Hydroxy-2,5-dimethyl-3(2H)-furanone (27) 30 -0.046 -0.151 0.979
4-Vinylguaiacol (28) 3.00 -0.202 -0.939 -0.252
Acetic acid (29) 30 nq* nq* nq*
Furfuryl alcohol (30) 1000 nq* nq* nq*
42
43