BIBLIOTECA
Document downloaded from the institutional repository of the University
of Alcala:
http://dspace.uah.es/dspace/
This is a postprint version of the following published document:
Martin-Lopez, S., Alcon-Camas, M., Rodriguez, F., Corredera, P.,
Ania-Castañon, J.D., Thévenaz, L., Gonzalez-Herraez, M., 2010, "Brillouin optical
time-domain analysis assisted by second-order Raman amplification, Optics
Express, 18 , n. 18, pp. 18769-18778.
Available at
http://dx.doi.org/10.1364/OE.18.018769
© 2010 Optical Society of America. One print or electronic copy may be
made for personal use only. Systematic reproduction and distribution,
duplication of any material in this paper for a fee or for commercial
purposes, or modifications of the content of this paper are prohibited
(Article begins on next page)
This work is licensed under a
Brillouin optical time-domain analysis assisted
by second-order Raman amplification
Sonia Martin-Lopez1,2, Mercedes Alcon-Camas3, Felix Rodriguez1, Pedro Corredera1, Juan Diego Ania-Castañon2, Luc Thévenaz4 and Miguel Gonzalez-Herraez5
1Instituto de Física Aplicada, CSIC. C/ Serrano 144, Madrid 28006, Spain. 2 Instituto de Óptica, CSIC, C/ Serrano 121, Madrid 28006, Spain.
3 Photonics Research Group, Aston University, Aston Triangle, Birmingham B4 7ET, UK 4 STI-GR-SCI Station 11, CH-1015, Lausanne, Switzerland.
5 Departamento de Electrónica, Universidad de Alcalá. 28871, Alcalá de Henares, Spain
E-mail: soniaml@cetef.csic.es
Abstract: We propose and experimentally demonstrate a new method to extend the range of Brillouin optical time domain analysis (BOTDA) systems. It exploits the virtual transparency created by second-order Raman pumping in optical fibers. The idea is theoretically analyzed and experimentally demonstrated in a 50 km fiber. By working close to transparency, we also show that the measurement length of the BOTDA can be increased up to 100 km with 2 meter resolution. We envisage extensions of this technique to measurement lengths well beyond this value, as long as the issue of relative intensity noise (RIN) of the primary Raman pump can be avoided.
2010 Optical Society of America
OCIS codes: (060.4370) Nonlinear optics, fibers; (290.5900) Scattering, stimulated Brillouin; (350.5500) Propagation
References and links
1. T. Horiguchi, T. Kurashima and M. Tateda, “A technique to measure distributed strain in optical fibers”. IEEE Photon. Technol. Lett. 2, 352-354 (1990).
2. X. Bao, D. J. Webb, and D. A. Jackson, "32-km distributed temperature sensor based on Brillouin loss in an optical fiber," Opt. Lett. 18, 1561-1563 (1993)
http://www.opticsinfobase.org/ol/abstract.cfm?URI=ol-18-18-1561
3. M. Niklès, L. Thévenaz, and P. A. Robert, "Simple distributed fiber sensor based on Brillouin gain spectrum analysis," Opt. Lett. 21, 758-760 (1996)
http://www.opticsinfobase.org/abstract.cfm?URI=ol-21-10-758
4. M. DeMerchant, A. Brown, X.Bao, and T. Bremner, "Structural Monitoring by Use of a Brillouin Distributed Sensor," Appl. Opt. 38, 2755-2759 (1999)
http://www.opticsinfobase.org/ao/abstract.cfm?URI=ao-38-13-2755
5. H. Naruse, M. Tateda, H. Ohno and A. Shimada, “Dependence of the Brillouin gain spectrum on linear strain distribution for optical time-domain reflectometer-type strain sensors”. Appl. Opt. 41 7212-7217 (2002).
http://www.opticsinfobase.org/ao/abstract.cfm?URI=ao-41-34-7212
6. T. Horiguchi and M. Tateda, "Optical-fiber-attenuation investigation using stimulated Brillouin scattering between a pulse and a continuous wave," Opt. Lett. 14, 408-410 (1989)
http://www.opticsinfobase.org/abstract.cfm?URI=ol-14-8-408
7. K.-Y. Song, M. González Herráez, and L. Thévenaz, "Mapping of Chromatic-Dispersion Distribution Along Optical Fibers With 20-m Spatial Resolution," J. Lightwave Technol. 23, 4140- (2005)
http://www.opticsinfobase.org/JLT/abstract.cfm?URI=JLT-23-12-4140
8. A. Vedadi, D. Alasia, E. Lantz, H. Maillotte, L. Thévenaz, M. González-Herráez, and T. Sylvestre “Brillouin Optical Time-Domain Analysis of Fiber-Optic Parametric Amplifiers” IEEE Photon. Technol. Lett. 19, 179-181 (2007)
9. M. Niklès, “Fibre optic distributed scattering sensing system: Perspectives and challenges for high performance applications”. Third European Workshop on Optical Fiber Sensors, 66190D, Italy, 2007.
http://www.opticsinfobase.org/JLT/abstract.cfm?URI=JLT-17-7-1179
11. M. A. Soto, G. Bolognini, and F. Di Pasquale, "Analysis of optical pulse coding in spontaneous Brillouin-based distributed temperature sensors," Opt. Express 16, 19097-19111 (2008)
http://www.opticsinfobase.org/abstract.cfm?URI=oe-16-23-19097
12. M. N. Alahbabi, Y. T. Cho, and T. P. Newson, "150-km-range distributed temperature sensor based on coherent detection of spontaneous Brillouin backscatter and in-line Raman amplification," J. Opt. Soc. Am. B 22, 1321-1324 (2005)
http://www.opticsinfobase.org/josab/abstract.cfm?URI=josab-22-6-1321
13. F. Rodriguez-Barrios, S. Martín-López, A. Carrasco-Sanz, P. Corredera, J. D. Ania-Castañón, L. Thévenaz and M. González-Herráez “Distributed Brillouin fiber sensor assisted by first-order Raman amplification” J. Lightwave Technol. 15, 2162-2172 (2010)
http://dx.doi.org/10.1109/JLT.2010.2051141
14. G. Bolognini and M. A. Soto, "Optical pulse coding in hybrid distributed sensing based on Raman and Brillouin scattering employing Fabry–Perot lasers," Opt. Express 18, 8459-8465 (2010)
http://www.opticsinfobase.org/oe/abstract.cfm?URI=oe-18-8-8459
15. J. D. Ania-Castañón, "Quasi-lossless transmission using second-order Raman amplification and fibre Bragg gratings," Opt. Express 12, 4372-4377 (2004)
http://www.opticsinfobase.org/abstract.cfm?URI=oe-12-19-4372
16. M. Alcón-Camas, J. D. Ania-Castañón, "Relative Intensity Noise transfer in high-order distributed amplification through ultra-long fibre cavities", in Proc. of SPIE Photonics North 2010, Session 14, Niagara Falls, Canada. 17. B. Bristiel; Shifeng Jiang; P. Gallion; E. Pincemin, “New model of noise figure and RIN transfer in fiber Raman
amplifiers”, ” IEEE Photon. Technol. Lett. 8, 980-982 (2006)
18. S. Foaleng Mafang, F. Rodriguez, S. Martin-Lopez, M. González-Herráez and L. Thévenaz “Impact of self phase modulation on the performance of Brillouin distributed fibre sensors” accepted for presentation at the Fourth European Workshop on Optical Fiber Sensors (EWOFS 2010), Porto, Portugal.
19. V. Lecoeuche, DJ. Webb, CN. Pannell, DA. Jackson, “25 km Brillouin based single-ended distributed fibre sensor for threshold detection of temperature or strain”, Opt. Communications 1-4, 95-102 (1999)
20. G. P. Agrawal, :onlinear Fiber Optics, 4th ed. Academic Press, San Diego, 2007. Chap. 9.
1. Introduction
The use of higher-order Raman amplification has been proposed to achieve virtual transparency in optical fibers [15]. Virtual transparency can be achieved in higher-order structures because the gain can be distributed very evenly along the fiber. A perfectly even distribution of the gain along the propagation distance can potentially lead to ideally lossless transmission if the gain value is set to match the losses. Lossless transmission is desirable since it is the working point that allows the minimization of the amplified spontaneous emission (ASE) noise build-up. In this paper we propose to use second-order Raman pumping to assist a BOTDA. A theoretical and experimental investigation of this possibility is carried out. Our experimental results show that the measurement range can be extended up to 100 km, and even beyond if care is taken to avoid RIN issues [16,17]. The main advantage of this technique over first-order Raman enhancement [13] is the possibility of generating a very even compensation of the losses along the fiber, leading to a sustained contrast of the Brillouin gain all along the fiber length, This technique can be useful in the development of ultra-long range Brillouin distributed sensors and chromatic dispersion distribution measurements.
This paper is organized as follows. In Section 2, the idea of higher-order Raman pumping is explored in the context of assisting a BOTDA scheme. In Section 3, we will show experimentally that virtual transparency is feasible. These results show that it is possible to obtain a significant performance improvement over conventional BOTDA when using the virtual transparency concept. Finally, we will expound the basic conclusions of our work.
2. Theoretical analysis
In this section we develop a theoretical analysis of BOTDA under second-order Raman pumping. The basic scheme considered in our analysis is depicted in Figure 1.
Fig. 1. Scheme analyzed. A 1365 nm Raman pump creates an ultra-long laser at 1455 nm. The power distribution of the mode at 1455 nm is such that creates very even gain distribution along the fiber at 1550 nm. If the adequate power levels are selected, this scheme allows virtually transparent propagation of the signals at 1550 nm. WDM: wavelength-division multiplexer, allowing efficient coupling of the 1365 nm and 1550 nm signals; FBGs: fiber-Bragg gratings at 1455 nm.
The system of equations describing the behaviour of the setup is given by the following:
µ µ
µ 2 1 2 2 1 2 1
1 12 1 1 1 / ) ( 2 2 1 1 1 1
4 h KT R
R R R R R R P e h P P P g P dz dP b ε ν ν α νν ν ν ± − + ∆ + + = ± ± + − − ± (1)
(
)
µ(
)
µµ 2 2
2 2 1 1 2 1 2 12 2 2 2 / ) ( 2 2 2 1 1 1
2 h KT R R R R B S R
R R R R P P P P g P P e h P g P dz dP S S b ε ν ν α νν ν ν + + ± − + ∆ + ± = + − ± + − − ± ± ± (2)
(
+ −)
− + − − − − + −= S S R S R R B S B
S P g P P P g P P
dz dP
S
S 2 2
2 2 ν ν α (3)
(
+ −)
− + − + + − + + −= S B R S R R B S B
B P g P P P g P P
dz dP
S
S 2 2
2 2 ν
ν
α (4)
In the above equations, the + and - superscripts represent forward and backward propagation respectively, the R1 and R2 subscripts identify, respectively, the first- and
second-order Raman pumps, and the B and S subscripts identify the Brillouin pump and probe waves.
νi and ∆νi denote, respectively, the corresponding frequencies and bandwidths of the first- and
second-order Raman pumps (in the case of the secondary pump this is limited by the bandwidth of the fiber Bragg gratings), αi are the fiber attenuations at each respective
frequency and εiare the double Rayleigh scattering coefficients of the fiber at each particular
frequency. gRx are the corresponding Raman gain coefficients for each of the Raman
transitions (x=12 denotes the first to second-order Raman transition, x=2s is the transition from the second-order pump to the BOTDA signals). Finally, h is the Planck’s constant, kB is
Boltzmann’s constant and T is the absolute temperature of the fiber. The fiber parameters used in the simulation are summarized in Table 1, and correspond to those of a conventional SMF.
Table 1. Fiber parameters used in the simulations
Wavelength (nm) gR α ε
1365 0.51 W-1 km-1 0.31 dB/km 1.0 x 10⁻⁵ km-1 1455 0.38 W-1 km-1 0.25 dB/km 6.0 x 10⁻⁵ km-1
1550 - 0.2 dB/km 4.2 x 10⁻⁵ km-1
conditions. The integration is done considering room temperature (25 °C) and typical values for the various SMF parameters (detailed in Table 1). The pumps are assumed to be depolarized, so the gain coefficients that appear on the table correspond to this case (i.e., have been multiplied by a factor 1/2). The full-width half-maximum (FWHM) reflection bandwidth of the fiber gratings is assumed to be 0.5 nm. These values match those that we will use in the experiment. The results are reported in the next section, together with the experimental results.
3. Experimental setup and results
We show now experimental results of BOTDA assisted by second-order Raman amplification. The experimental scheme used is depicted in Fig. 2.
In the experiment, the Brillouin pump and probe waves are obtained from the same laser diode (LD) through the modulation technique [3]. This method ensures a constant pump-probe frequency difference regardless of the absolute frequency changes of the laser. The LD emits at 1553.59 nm and has a narrow line-width (below 1 MHz). The output power of the LD is ∼4 mW. We adjust the wavelength of the laser through current and temperature control. To obtain the pump and probe waves we split the laser light through a 50/50 optical coupler. The probe wave is obtained by amplitude modulation of the laser light (Modulator 2 in Figure 2) which is driven by a frequency-agile microwave generator. The amplitude modulation creates two sidebands, separated from the pump by approximately the Brillouin frequency shift νB
(∼10.5-10.8 GHz) of the fiber under test. The carrier frequency is suppressed by properly setting the DC bias on the modulator. Although only the lower frequency sideband is used as probe wave, it must be mentioned that both sidebands propagate in the fiber. The higher-frequency sideband can only be beneficial for the experiment because its only effect is to amplify the pump pulse (it counter-propagates with respect to the pulse at the pump frequency plus the Brillouin shift). Nevertheless, its value is always in the range of microwatts or below, and therefore the gain on the pump pulse cannot be expected to exceed 0.1 dB. A suitable optical filter rejects the higher-frequency sideband before the detection. The probe wave power is adjusted using an optical attenuator. This adjustment is necessary to avoid any Brillouin pump depletion.
To shape the pump pulse we use Modulator 1 as shown in Fig. 2. The pulse duration is chosen so that the pulse launched in the fiber has the target resolution. In the measurements of this paper this is 4 meters or 2 meters (40 ns or 20 ns). The maximum repetition rate is defined by the maximum length of the test fiber. In our case we fix this repetition rate to 800 Hz. The pulse train obtained at the output of Modulator 1 is amplified using an Erbium Doped Fiber Amplifier (EDFA) and a tunable attenuator to control the output power. To minimize the Amplified Spontaneous Emission (ASE) added by the EDFA, we insert a tunable fiber Bragg grating working in reflection. The spectral profile is approximately Gaussian and its spectral width is 0.8 nm. A Nonlinear Optical Loop Mirror (NOLM) is inserted to increase as much as possible the extinction ratio of the pulse. This is essential to avoid SBS rise-up due to the low-level part of the pulse. The NOLM comprises a 50/50 coupler, a 4.4 km long DSF and an attenuator. This ensures more than 50 dB extinction ratio in the pulse, which is essential to achieve clean measurements.
We monitor the pump power at the output of the NOLM using a calibrated coupler and a power-meter. A polarization scrambler (PS) is used to eliminate the dependence of the Brillouin gain on polarization. The fiber is connected to the common ports of two suitable WDMs. The primary Raman pump is a Raman Fiber Laser (RFL) emitting at at 1365 nm. The power of this laser can be tuned up to 5 W and the RIN specified by the manufacturer is ≤105 dBc/Hz. The RFL beam is divided by a calibrated 50/50 coupler in two beams, and inserted through both sides of the fiber by the corresponding ports of the WDM. The cavity for the first-order Raman is created by inserting two FBGs at both ends of the fiber. The peak reflection of the FBGs appears at 1455 nm, and they show a FWHM of 0.5 nm with 80% reflectivity.
In the detection part, the probe wave is filtered by a Bragg grating working in reflection and with a 0.16 nm bandwidth. This second grating has to reject the higher-frequency sideband, and thus it has to be very selective in frequency. By working close to the edge of the grating, we can maximize the rejection of the higher-frequency sideband in detection, together with the Rayleigh backscattering from the pump, and improve the contrast of the whole trace. A tunable attenuator controls the power before detection, to avoid saturation of the fast InGaAs detector.
0,0 0,4 0,8 1,2 1,6 2,0 2,4 2,8
G
a
in
(
%
)
Distance (10 km/div)
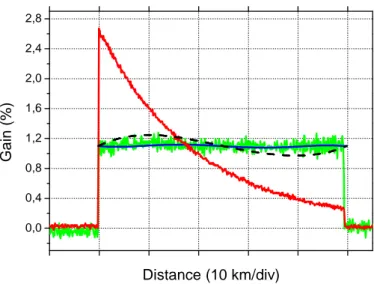
Fig. 3. Experimental gain traces acquired for the ∼50 km fiber with 40 ns pulses. Red curve shows the conventional BOTDA trace obtained for the maximum gain of the fiber (PB+=13.5 mW, pulses
have 40 ns width, PS-=0.5 µW). In green, the trace obtained with the same pulse width and probe
power (PB+ is reduced to 7.5 mW to avoid Brillouin pump depletion, PS- is raised to 0.7 µW). The
blue curve shows the simulated gain evolution (equations 1-4) considering the experimental settings and the dashed curve shows the simulated gain evolution for the first-order amplification configuration (see ref. [13] for details) considering the same experimental settings and trying to work as close as possible to transparency. Pump power at 1365 nm is approximately 470 mW from each side.
Fig. 4. Experimental gain traces acquired for the 50 km fiber with 20 ns pulses. Red curve shows the conventional BOTDA trace obtained for the maximum gain of the fiber (PB+=14 mW, pulses
have 20 ns width, PS-=0.6 µW). In green, the trace obtained with the same pulse width and probe
power (PB+ is reduced to 7.5 mW to avoid Brillouin pump depletion). The blue curve shows the
simulated gain evolution (equations 1-4) considering the experimental settings and the measured Brillouin gain broadening. Pump power at 1365 nm is approximately 470 mW from each side.
Since SPM implies a broadening of the Brillouin gain spectrum, the final consequence in terms of measurements is a certain growth in the uncertainty in the Brillouin shift determination along the fiber. This is somewhat similar (although less limiting) to conventional BOTDA setups in which the signal loss combined with SPM broadening causes a growth of the measurement uncertainty with the distance [18,19]. To overcome this problem, we can over-amplify (by simply raising the pump power) asymmetrically towards the end of the fiber, as shown in the frequency scan in Figure 5(a). We can see that the gain measured towards the end of the fiber appears broader (which would conventionally mean that there is more uncertainty in the determination of the Brillouin shift). As can be seen in Figure 5(b), the results are in excellent agreement with the numerical simulation, in which the variation of the gain bandwidth and its impact on the Brillouin gain coefficient have been taken into account. The measured gain bandwidth can be distinguished in Fig 6(a). The broadening caused by SPM would, in transparency conditions, reduce contrast with distance. However, as we have also increased the gain contrast towards the end of the fiber by overamplifying and unbalancing the Raman pumps, the measurements are performed with a relatively constant quality over the whole fiber length, as shown in the difference between consecutive measurements shown in Fig. 6(b). The fact that the uncertainty is maintained along the whole fiber length is extremely valuable for measurement systems, since the specifications can be maintained regardless of system length.
0,0 0,2 0,4 0,6 0,8 1,0
G
a
in
(
%
)
Fig. 5. (a) Experimental gain frequency scan acquired for the 50 km fiber with 20 ns pulses, over-amplifying towards the end of the fiber to compensate the contrast loss due to SPM. The gain broadening is visible at the end of the fiber. (b) Measured BOTDA gain trace (green line) vs. numerical simulation. Power settings are as follows: PB+=9 mW, PS-=0.3 µW. Raman power is
approximately 780 mW and 270 mW in counter- and co-propagating direction respectively.
Fig 6. Experimental gain frequency scan acquired for the 50 km fiber with 20 ns pulses. (a) Measured gain bandwidth showing the growth towards the end of the fiber. (b) Difference between consecutive measurements of Brillouin shift in the fiber. The results indicate that the uncertainty in the measured Brillouin shift remains basically constant along the whole fiber length, not being compromised by fiber attenuation or SPM broadening. Power settings are as follows: PB+=9 mW,
PS-=0.3 µW, Raman power is approximately 780 mW and 270 mW in counter- and co-propagating
direction (with respect to the Brillouin pump pulse) respectively. .
To explore the limits of this technique in terms of measurable length, we then insert a 100 km fiber in the measurement setup. The Raman power is set to roughly 940 and 540 mW per each side, and the Brillouin power settings are PB+=10 mW and PS-=2
µW. The result of the frequency scan done is shown in Fig. 7(a). The Raman power delivered in the fiber is not yet enough to be in transparency and therefore the gain varies very significantly along the whole fiber length. In our measurement setup, higher pump powers also lead to higher RIN values in the Raman pumps, turning the measurement impossible due to the large RIN transfer. Nevertheless, even though not
-5 0
5 (b)
B
D
if
fe
re
n
c
e
(
M
H
z
)
Distance (10 km/div)
50 100 150
G
a
in
b
a
n
d
w
id
th
(
M
H
z
)
in transparency, the gain contrast in this non-ideal situation is still enough to perform Brillouin shift measurements along the complete fiber span. Fig 7(b) shows the comparison of the measured gain trace and the theoretical trace expected. Again, the results are in good agreement with the model.
Fig. 7. (a) Experimental gain frequency scan acquired for the 100 km fiber span with 20 ns pulses. Significant gain broadening and Rayleigh scattering is visible in the trace. (b) Measured BOTDA gain trace (green line) vs. numerical simulation. Power settings are as follows: PB+=10 mW, PS-=2
µW. Raman power is approximately 943 mW and 585 mW in counter- and co-propagating direction (with respect to the Brillouin pump pulse) respectively.
Fig. 8. Comparison of the retrieved Brillouin shift of the fiber using the second-order Raman-assisted configuration (red line) and the conventional BOTDA configuration (results show up to 75 km).
Fig. 8 shows the retrieved Brillouin shift (red curve) with the second-order Raman-assisted configuration and the results obtained with the plain BOTDA configuration (blue curve, results shown up to 75 km). Although the results at the beginning of the fiber accumulate more noise (due to RIN transfer), it is evident that the second-order Raman-assisted configuration can deliver better results beyond 45 km and up to 100 km with a noise in the Brillouin shift not exceeding ±3 MHz. More progress in Raman pumps should enable lower RIN values in the pumps and therefore significantly improved results. Preliminary simulations indicate that using Raman pumps with sufficiently low RIN, the system could be tailored to have a measurement range of 150 km.
10,63 10,64 10,65 10,66 10,67
B
ri
llo
u
in
s
h
if
t
(G
H
z
)
4. Conclusion
In conclusion, we have shown a new method to extend the range of Brillouin optical time domain analysis (BOTDA) setups. The proposed method relies on second-order Raman pumping in optical fibers. The clear advantage of the technique is that it requires no active remotely powered element along the sensing fiber to amplify and reshape the pump, by achieving a perfectly distributed gain. This makes possible to experimentally closely realize the ideal condition of a flat gain distribution along the sensing fiber, resulting in a position-independent and uniform response with identical accuracy, if SPM effects can be made negligible using pulses with step edges. We have theoretically and experimentally demonstrated the concept in 50 km and 100 km fiber spans, showing obvious improvements over conventional BOTDA in very long-range setups. Compared to plain first-order amplification, this technique has the advantage of minimizing the signal variations, potentially leading to perfectly even measurements along the fiber length. By working close to transparency, we have shown that the measurement length of the BOTDA can be increased up to 100 km with 2 meter resolution, the main limitation being the RIN transfer from the Raman pumps to the BOTDA signals. We believe that improved Raman pumps with lower RIN values may allow extending this technique to measurement lengths well beyond 100 km.
Acknowledgments