Bounds on spectrum graph coloring
Texto completo
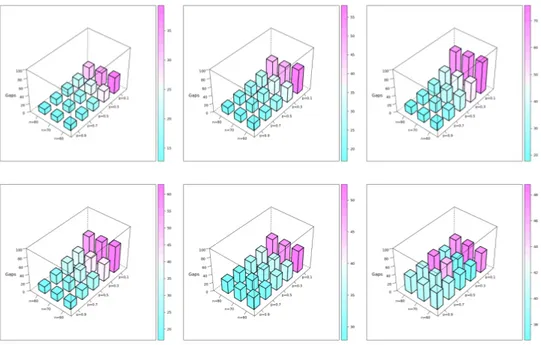
Figure

Documento similar
Government policy varies between nations and this guidance sets out the need for balanced decision-making about ways of working, and the ongoing safety considerations
No obstante, como esta enfermedad afecta a cada persona de manera diferente, no todas las opciones de cuidado y tratamiento pueden ser apropiadas para cada individuo.. La forma
The emitted spectrum of Hii galaxies is reproduced by means of the photoionization code, using as ionizing spectrum the spectral energy distribution of the modelled Hii
To check for possible rotational variation of the asteroid spectrum due to surface inhomogeneities, each spectrum is di- vided by the average of all the spectra obtained each night
Here we investigate the output photon statistics of optical nonlinearities for the regime where the anharmonicity of their frequency spectrum becomes comparable to the frequency
For a given metallicity, the changes in the emission-line spectrum and in the ionization parameter are due to the changes in the cluster mass, which determines the number of
The simulated invariant mass spectrum was normalized to the data using the number of events in the mass interval 60–120 GeV.. The shape of this spectrum can be modified by
teriza por dos factores, que vienen a determinar la especial responsabilidad que incumbe al Tribunal de Justicia en esta materia: de un lado, la inexistencia, en el
