Fertilization regime interacts with fall temperature in the nursery to determine the frost and drought tolerance and nutrient status of the Mediterranean oak Quercus ilex L
36
0
0
Texto completo
(2) 1. Fertilization regime interacts with fall temperature in the nursery to determine the frost. 2. and drought tolerance of the Mediterranean oak Quercus ilex subsp. ballota.. 3 4. Norberto Heredia-Guerrero1,2, Juan A. Oliet3, Pedro Villar-Salvador1 , Luis F. Benito4, Juan L.. 5. Peñuelas4. 6 7. 1. Forest Ecology and Restoration Group, Departamento de Ciencias de la Vida, U.D.. 8. Ecología, Universidad de Alcalá, P.O. Box 20, Alcalá de Henares, 28805 Madrid, Spain. 9. 2. Corresponding author ([email protected]), Tel +34 91 885 4913.. 10. 3. Departamento de Silvopascicultura, Universidad Politécnica de Madrid, 28040 Madrid,. 11. Spain.. 12. 4. Centro Nacional de Recursos Genéticos Forestales “El Serranillo", Ministerio de. 13. Agricultura, Alimentación y Medio Ambiente, P.O. Box 249, 19080 Guadalajara, Spain.. 14 15 16 17 18 19 20 21 22 23 24 25. 0.
(3) 26 27 28. Abstract. 29. Nitrogen fertilization in the nursery usually improves the transplanting performance of. 30. Mediterranean oaks. However, high N fertilization can reduce seedling stress tolerance,. 31. probably depending on the environmental conditions under which plants grow. We. 32. hypothesize that high N fertilization under mild fall conditions reduces cold and drought. 33. acclimation. To assess this hypothesis, we studied if fall temperature differences among. 34. cultivation locations influence the effect of N fertilization regime on cold and drought. 35. tolerance, N status and growth in the evergreen Mediterranean oak Quercus ilex subsp.. 36. ballota (Desf.) Samp. Plants were cultivated in two nurseries of distinct fall temperature. 37. conditions (mild and cold fall nurseries) under four fertilization regimes: Low and high N at. 38. constant rate (total N, 33 and 175 mg seedling-1), high N at exponential rate (175 mg N. 39. seedling-1) and fall N loading (89 mg N seedling-1). Seedling water relations, survival to a -12. 40. ºC frost and leaf soluble carbohydrates concentration were assessed three times in the fall, and. 41. shoot elongation was measured weekly through the fall. Moreover, seedling mass and N. 42. concentration were measured at the end of the fall. Fall loaded seedlings had the highest tissue. 43. N concentration, while seedling mass was highest in the high N constant and exponential. 44. fertilization regimes. Seedlings at the cold fall nursery concentrated more N but were smaller. 45. than seedlings at the mild fall nursery. Cessation of shoot elongation in the mild fall nursery. 46. occurred 1 month later than in the cold location and high N exponentially-fertilized plants. 47. ceased shoot elongation later than the rest of fertilization treatments. Seedlings at the mild fall. 48. location had lower drought and cold tolerance than plants at the cold fall site. At mid fall,. 49. exponential fertilization at the mild nursery reduced seedling frost and drought tolerance, but. 50. treatment differences vanished at the end of the fall. In contrast, fertilization regime did not. 1.
(4) 51. affect either cold or drought tolerance of seedlings at the cold fall nursery. Across dates and. 52. nurseries, frost survival was positively related to leaf soluble carbohydrates concentration and. 53. dry weight fraction. Beside, degree of cold acclimation decreased with shoot elongation. 54. cessation date and increased with leaf soluble carbohydrates concentration, suggesting a link. 55. between shoot growth activity, soluble carbohydrates, and frost tolerance. We conclude that. 56. Q. ilex subsp. ballota hardening is reduced by high N exponential fertilization mainly under. 57. mild fall conditions, while fall loading and constant low fertilization did not affect hardening.. 58 59. Keywords: Cold acclimation, Frost, Growth, Hardening, Nitrogen, Nutrient loading, Osmotic. 60. potential, Soluble carbohydrate, Water relations.. 61 62. 1. Introduction. 63. Seedlings planted in Mediterranean woodlands frequently show poor performance due to. 64. water and cold stress (Cuesta et al., 2010; Villar-Salvador et al., 2004a), and low soil fertility. 65. (Valdecantos et al., 2006). Outplanting performance of seedlings depends on their functional. 66. attributes, which can be determined by cultivation practices in the nursery. Nutrient status of. 67. seedlings, mainly of N, determines outplanting performance as indicated by the frequent. 68. positive relation of seedling transplanting survival and growth with tissue nutrient content. 69. (Oliet et al., 2009a, 2009b; Villar-Salvador et al., 2004a; Villar-Salvador et al., 2013b).. 70. Fertilization rate and fertilizer supply regime strongly influences seedling nutrient. 71. status and quality in forest nurseries (Dumroese et al. 2005; Islam et al. 2009; Oliet et al.. 72. 2009a). Most nurseries supply the fertilizer at a constant rate over the cultivation period.. 73. However, this regime of fertilization reduces nutrient uptake efficiency (Dumroese et al.. 74. 2005). The exponential (Timmer and Aidelbaum, 1996; Salifu and Timmer, 2003a) and fall. 75. fertilization (Andivia et al. 2011) regimes are alternatives to the constant fertilization regime. 2.
(5) 76. that improve fertilization efficiency while enhancing seedling nutrient loading (Dumroese et. 77. al., 2005).. 78. Planting window in the Mediterranean basin starts in early fall, a wet season that. 79. allows seedling establishment (Mollá et al., 2006; Andivia et al., 2011). Frosts are quite. 80. common in Mediterranean highlands by mid fall so plants must be hardened in the nursery to. 81. resist planting check and frost. Nitrogen nutrition affects the frost and drought tolerance of. 82. plants but there is no clear consensus whether N supply reduces or increase stress resistance in. 83. plants. High to moderate N supply has been shown to increase (Fernández et al., 2007;. 84. Andivia et al. 2012 Taulavuori et al., 2014), reduce (Harvey and van den Driessche, 1997;. 85. Villar-Salvador et al., 2013a) or have no effect on frost resistance (Calme et al., 1993;. 86. Thomas and Ahlers, 1999). Previous studies in holm oak show higher frost tolerance in. 87. response to moderate fall N fertilization (Andivia et al., 2011, 2012). Similarly, high nutrient. 88. supply has also shown variable effects on drought tolerance (Harvey and van den Driessche,. 89. 1997; Premachandra et al., 1992; Saneoka et al., 2004; Tan and Hogan, 1995). High N. 90. fertilization may cause shoot to root imbalances which may impair seedling outplanting. 91. performance (Grossnickle, 2012). However, high N content plants have higher N. 92. remobilization capacity, which promotes growth and seedling establishment (Cuesta et al.. 93. 2010; Salifu and Timmer, 2003b). To our knowledge, very few studies have addressed the. 94. effect of nitrogen nutrition on the drought and cold tolerance of oaks (see Andivia et al. 2012;. 95. Kleiner et al. 1992; Thomas and Ahlers 1999; Villar-Salvador et al. 2013b).. 96. The variety of effects of nutrition on plant cold and drought tolerance might be due to. 97. species-specific differences, or to differences in the experimental conditions of the studies. 98. (Hawkins et al., 1995; Oliet et al., 2013; Taulavuori et al., 2014 and references therein).. 99. Specifically, temperature, daylength or drought influence the tolerance of plants to subsequent. 100. drought and cold stress (Arnott et al., 1993; Bigras et al., 2001) and these environmental. 3.
(6) 101. factors can interact with fertilization regime to determine seedling cold and drought hardening. 102. (Puértolas et al., 2005). Specifically, we suggest that mild temperature in the fall could result. 103. in negative effects of nutrition on seedling cold and drought tolerance due to acclimation. 104. delay. Additionally, nutrient uptake is also influenced by temperature (Warren, 2009) with. 105. potential effects on nutrient status that might interact with stress tolerance. A very limited. 106. number of studies have addressed the interaction between plant nutrition and temperature. 107. conditions during the fall on the stress acclimation or hardening of forest trees (but see. 108. Puértolas et al., 2005). Temperature reduction in the fall widely varies across locations. In a. 109. comprehensive study of the cold acclimation of Quercus ilex subsp. ballota (Desf.) Samp.. 110. (holm oak), Mollá et al. (2006) observed deep differences in the intensity and duration of. 111. seedling cold and drought hardening between nurseries located in sites with contrasting winter. 112. temperatures.. 113. The objective of this study was to assess if fertilization regime interacts with fall. 114. temperature conditions to determine the cold and drought tolerance, nutrient status and growth. 115. of Q. ilex subsp. ballota (hereafter Q. ilex) seedlings. This oak is an evergreen tree that. 116. dominates many forest communities in Mediterranean basin. It is widely used for. 117. afforestation, but seedlings have high mortality and slow growth compared with other. 118. Mediterranean species (Siles et al., 2010). Previous studies with this species have analyzed. 119. the effect of exponential and fall fertilization on growth, nutrient dynamics and frost tolerance. 120. of seedlings (Oliet et al., 2009b; 2011; Andivia et al., 2011).. 121. compared the effect of fall, conventional and exponential fertilization regime simultaneously. 122. applied in nurseries with distinct fall temperature conditions. We tested two hypotheses: 1). 123. high N supply increases nutrient reserves in seedlings but reduces frost and drought hardening. 124. in the fall, and 2) reduction in cold and drought tolerance by high fertilization will be greater. 125. in a mild fall location than in a cold fall one due to delay in hardening. To address our. However, no study has. 4.
(7) 126. hypotheses we cultivated Q. ilex seedlings using a constant (conventional) and exponential. 127. fertilizer supply schedule and a fall loading fertilization regime in two nurseries located in. 128. sites with distinct fall temperature. Growth and nutrient concentration were measured at the. 129. end of the cultivation and water relations, frost tolerance and soluble carbohydrates were. 130. measured three times through the fall.. 131 132. 2. Material and Methods. 133. 2.1 Experimental design. 134. On February 26, 2008, pregerminated acorns of the Región Leonesa provenance were seeded. 135. into 24 Forest Pot 300® trays (Nuevos sistemas de Cultivo S.L., Girona, Spain) (one acorn per. 136. cavity). Each tray has 50 cavities of 300 ml and cultivation density was 387 plants m -2.. 137. Growing medium was unfertilized Sphagnum peat (Kekkilä B0, Finland). Plants were initially. 138. grown in a greenhouse of the Centro Nacional de Recursos Genéticos Forestales “El. 139. Serranillo” (Guadalajara, Spain) to avoid frost damage. Temperature during this period ranged. 140. from 4 to 25 ºC and radiation was approximately 50% of that outside. In early April 2008,. 141. half of the trays were moved to the nursery of the University of Córdoba (mild fall nursery,. 142. Mf) (Córdoba, southern Spain, 37º 51´N, 4º 48´W) at 120 m a.s.l., while the other half. 143. remained at the Centro Nacional de Recursos Genéticos Forestales “El Serranillo” (cold fall. 144. nursery, Cf) (Guadalajara, centre of Spain, 40º 39´ N, 3º 19´ W), which is at 650 m a.s.l.. 145. Cultural practices in both nurseries were kept as similar as possible to avoid any confounding. 146. effect of nursery climate and cultural practices on the performance of plants. Thus, from early. 147. April 2008 seedlings were kept outdoors, well watered and exposed to the seasonal changes in. 148. temperature and day length in both nurseries. Irrigation water properties (mean values from. 149. samples taken on May and November 2008) for Mf nursery were: pH = 7.8, electrical. 150. conductivity (EC) = 265 S cm-1, [NO3-] = 2.3 mg l-1; and for Cf nursery: pH = 8.4, EC = 584. 151. S cm-1, [NO3-] = 2.1 mg l-1. The Cf location has a continental Mediterranean climate with 5.
(8) 152. cold winters and hot and dry summers. The Mf location also has a Mediterranean climate, but. 153. winter is milder and summer is hotter than in the Cf location, with maximum temperatures. 154. above 40 ºC many days in summer. Historical weather records indicate that the Cf location. 155. has 73 days of frost per year and a mean minimum air temperature in January (Tmin) of -1.4. 156. ºC. The Mf location typically has 5 to 10 days of frost and Tmin in January is 3.7 ºC. During. 157. the study period (2008-2009), winter season was colder than the mean historical record but. 158. differences between locations still remained, with mean minimum temperature being on. 159. average 5 ºC lower in the Cf nursery than in the Mf nursery. Chilling hours, i.e, the number of. 160. hours at which air temperature remained below 8.0 ºC (Fernández et al., 2008), started to. 161. accumulate in early September at the Cf nursery and in early November in the Mf nursery. 162. (Figure 1). At the end of the fall, the Cf nursery had accumulated twice the chilling hours than. 163. the Mf nursery. It should be noted that an abnormal and prolonged cold period occurred from. 164. late December 2008 to mid January 2009, where the average minimum temperature in the Cf. 165. and Mf nursery were -7.4 and -1.3 ºC, respectively, while mean daily temperature was -1.3. 166. and 5.6 ºC at Cf and Mf, respectively.. 167. From mid-June to mid-September 2008 plants were shaded in both nurseries with a. 168. neutral shade cloth that reduced radiation to 60%. Shading is recommended to avoid heat. 169. damage during summer in broadleaf seedlings cultivated in southern Spain (Villar-Salvador et. 170. al., 2004a). From mid September to the end of the cultivation in mid December, shade cloth. 171. was removed in both locations and seedlings were cultivated under full sun to promote. 172. seedling hardening (Pardos et al., 2005).. 173. Four fertilization levels were differentiated in both locations: (1) conventional low (C-. 174. ) and (2) conventional high (C+) fertilization, where the fertilizer was applied weekly at a. 175. constant rate of 1.57 and 8.3 mg N per seedling respectively, for 21 weeks from May 20. 176. (Julian day 140) to mid October (Julian day 289) (33 and 175 mg N in total for C- and C+,. 6.
(9) 177. respectively); (3) fall loading (FL): each seedling received 1.57 mg N week-1 for 21 weeks. 178. from May 20 to mid October as per C- treatment, followed by a second period of fertilization. 179. of 8 weeks delivering 8 mg N week-1 at a constant rate from mid October to mid December. 180. (Julian day 338) (89 mg N in total); (4) exponential fertilization (Exp): each seedling received. 181. 175 mg N in total (as per C+), but nutrients were delivered weekly for 21 weeks from mid. 182. May to mid October at an exponentially increasing addition rate following methodology in. 183. Timmer and Aidelbaum (1996).. 184. Fertilization rate for constant and exponential regimes were chosen to create a gradient. 185. of N from deficiency (33 mg N) to luxury consumption (175 mg N) (Jacobs et al., 2009).. 186. Each fertilization treatment was applied to three trays in the two cultivation locations,. 187. resulting in 24 trays (4 fertilization treatments × 3 trays × 2 locations). Trays were completely. 188. randomized, and their position was rotated every week to minimize edge effects. In every. 189. fertilization event, each seedling was dispensed with 50 ml of the fertilization solution once. 190. per week. Supplementary irrigation was also applied every 2-3 days to keep growing medium. 191. close to its field capacity. Fertilization solution was made with a 20–20–20 (20 N, 8.7 P, 16.7. 192. K) commercial water-soluble fertilizer (Scotts Co., Marysville, OH, USA), which N sources. 193. were ammonium nitrate (10%) and urea (10 %).. 194 195. 2.2 Frost tolerance and shoot water relations measurement. 196. Frost tolerance tests were carried out on treatments C-, FL and Exp (175 mg N) but not in C+. 197. plants. The reason is that several trays were stolen from the experiment in the mild fall. 198. nursery in mid summer 2008. As most of the stolen plants belonged to the C+ treatment we. 199. discarded this treatment for physiological measurements and reserved the remaining plants for. 200. growth and nutrient measurements. Frost tolerance was measured as seedling survival after a -. 201. 12 ºC frost and it was determined on three dates: mid September 2008, at the end of. 7.
(10) 202. November 2008 and in mid January 2009. Single frost cycles to -12ºC has successfully been. 203. used for determining the cold hardiness for holm oak (Mollá et al., 2006; Fernández et al.,. 204. 2008; Andivia et al., 2012). On each date we randomly selected eight seedlings per treatment.. 205. In mid September, frost tolerance was only conducted in the C- and Exp treatments because. 206. fall fertilization had not started yet. For the rest of the dates, treatments C-, Exp and FL were. 207. tested. Seedlings were transplanted into styrofoam containers to isolate root systems from. 208. frost and placed in a freezer. Temperature was reduced at a rate of 3 ºC h -1 from 10 ºC to –12. 209. ºC where it remained for 3 h and then it was raised to 10 ºC at a rate of 4 ºC h-1. After the. 210. frost, plants were left in a glasshouse to recover for 2 months under optimal temperature and. 211. irrigation conditions and the number of plants with dead shoots was recorded to assess frost. 212. tolerance. A plant was considered to have a dead shoot when foliage was completely brown. 213. and no resprouting occurred from the stem. Temperature inside the glasshouse varied between. 214. 5 and 25 ºC.. 215. In February 2009 we detected some dead plants in the Cf nursery, which was attributed. 216. to an abnormal long very cold period from late December 2008 to mid January 2009 (see. 217. section 2.1). We randomly sampled 38 to 47 individual in each fertilization treatment and. 218. counted the number of damaged seedlings. A plant was considered damaged when more than. 219. 50% of its foliage was completely necrotic.. 220. Pressure-volume (P-V) curves were made on similar dates of freezing tests following. 221. the free-transpiration method described in (Koide et al., 1989). We used the upper half of. 222. shoots of six to eight plants per treatment. The osmotic potential at saturation (Ψ100), the. 223. osmotic potential at the turgor loss point (Ψtlp), the water saturation deficit at the turgor loss. 224. point (WSDtlp), volume dry weight fraction (DWF), symplasm volume faction (Vs/VT) and the. 225. modulus of elasticity (ε) were calculated from each curve following methodology in Villar-. 226. Salvador et al. (2004b). The shoot weight at full saturation was calculated following the. 8.
(11) 227. method describe in Kubiske and Abrams (1990) when plateaus were detected in the curves.. 228. The residual transpiration (TR) was measured in the same plants used for P-V curves. 229. after they reached Ψtlp. This measurement was only done at the beginning of December. 230. following methodology described in Villar-Salvador et al. (2004b).. 231 232 233. We calculated the Acclimation Index, a relative measure of the frost tolerance of seedlings in September relative to frost tolerance in November, as:. Acclimatio n Index = 1 −. (Frost survival. ) - (Frost survival. Nov. (Frost survival. Sep. ). ). (3). Nov. 234. where Frost survivalNov and Frost survivalSep are seedling survival after a -12ºC frost in. 235. November and September, respectively.. 236 237. 2.3 Growth and nutrients and soluble carbohydrates concentration. 238. Seedling height was measured weekly on 18 randomly selected seedlings per fertilization. 239. treatment in each location (six seedlings per tray,) from July 3 to December 18. We measured. 240. the same plants through the study period. Shoot height was measured from the cotyledon. 241. insertion point to the apex. Finally, we calculated the average Julian day of shoot elongation. 242. cessation of the different treatments as a proxy of the cessation of terminal bud activity. 243. (Floistad and Granhus, 2010). We considered shoot elongation of each seedling to definitively. 244. cease in the fall when shoot height plateaued and consecutive elongation measurements varied. 245. less than 0.6 cm.. 246. At the end of the measurement period, the same seedlings were harvested and frozen. 247. to -30 ºC until processed. Once defrosted, shoot were cut at the cotyledon insertion point and. 248. separated into leaves and stems while roots plugs were washed from the growing medium. All. 249. material was washed in tap water and rinsed in distilled water. Then leaves, stems and roots. 250. were dried at 60 ºC for 48 h and weighed to assess their mass.. 251. To determine tissue N concentration, seedlings were randomly assigned to six groups 9.
(12) 252. of three seedlings each group. Leaves, stems and roots were ground in a mini-hammer mill. 253. (Culatti DFH 48, Culatti AG, Zurich, Switzerland) with a 0.8 mm sieve. Nutrient. 254. concentration was estimated by Near Infrared Spectroscopy (NIRS) with a Foss-NIRSystems. 255. 6500 System II spectrophotometer (Foss-NIRSystems Inc., Silver Spring, MD, USA). Spectra. 256. were collected and reflectance data at different wavelengths derived from them were. 257. introduced in a prediction model previously fitted following methodology in Shenk and. 258. Westerhaus (1994). The reflectance (log1/R) spectra were collected in duplicate and the mean. 259. spectrum of each sample was used.. 260. On the same dates that freezing tests and P-V curves were carried out, we measured. 261. the concentration of leaf soluble carbohydrates (SC). We used the same plants used for frost. 262. survival. Two leaves per plant from the upper third of the stem were randomly harvested.. 263. Leaves were randomly assigned to four groups and immediately frost to -30ºC until. 264. processed. Once defrost, leaves were rinsed twice in deionized water, dried at 50 ºC for 48 h. 265. and ground in a ball mill (PM 100, Retsch, Haan, Germany). To determine SC concentration,. 266. fifty mg of ground leaves were incubated for 90 min in 100 % ethanol at 80 ºC to extract SC.. 267. Samples were centrifuged at 13000 g for 5 min to separate the pellet from the supernatant,. 268. which contained SC. The supernatant was dried 48 h at 60 ºC, dissolved in distilled water and. 269. boiled for 5 min. Supernatant solutions were filtered through a 0.45 μm nylon-syringe and 20. 270. μl was injected for analysis with a high-performance liquid chromatograph (HPLC) using an. 271. Agilent 1100 Series (Agilent Technologies, Paulo Alto, CA) equipped with a refractive index. 272. detector. A carbohydrate column (SupelcogelTM Ca, 30 × 0.78 cm, Supelco, Bellefonte, PA). 273. was used for the analysis. Peaks were detected by refractive index and were identified and. 274. quantified by comparison with retention times of fructose, glucose and sucrose standards.. 275. Total leaf SC concentration was calculated as the sum of fructose, glucose and sucrose. 276. concentration.. 10.
(13) 277 278. 2.4 Data analyses. 279. Shoot water relations and leaf SC concentration were analyzed with a nested ANOVA using a. 280. general linear model. Factors were fertilization treatment (two or three treatments depending. 281. on date), date (September and November) and location (two sites). Fertilization was nested. 282. within date because the FL treatment was not present in September. Moreover, because. 283. seedlings in the Cf nursery were damaged by natural frosts (see section 3.1) in an abnormal. 284. prolonged cold period from the end of December 2008 to mid January 2009 (see section 2.1),. 285. we did not include January data of the Cf nursery in statistical analyses. Rather, we performed. 286. one-way ANOVAs to compare fertilization treatments at the Mf location in January. Survival. 287. after a –12 ºC frost was analyzed using a generalized linear model with a binomial. 288. distribution and a logit link function. For frosts conducted in September and November,. 289. factors were fertilization (two-three treatments depending on date), date (September and. 290. November) and location (two sites), with fertilization nested within date. Data from the tests. 291. conducted in January were analyzed only with three fertilization treatments (Exp, C- and FL). 292. of the Mf nursery. Finally, damage differences among fertilization treatments (Exp, C- and. 293. FL) after the natural frosts in January in the Cf nursery were assessed using a generalized. 294. linear model with a binomial distribution and a logit link function.. 295. Tissue N concentration and content, root to shoot ratio, and the Julian of day shoot. 296. elongation cessation were analyzed by a two-ways ANOVA where the main factors were. 297. fertilization (four treatments) and location (two sites). Most dependent variables were log-. 298. transformed prior to analyses to ensure homocedasticity. Relationship between variables was. 299. analyzed by regression analysis except the relation between survival and Julian day of. 300. elongation cessation, which was analyzed with the Spearman correlation coefficient because. 301. we were not able to fit a regression model. We considered results significant when P-values. 11.
(14) 302. were < 0.05. Statistical analyses were performed with STATISTICA 7.0 (StatSoft, Tulsa,. 303. OK).. 304 305. 3. Results. 306. 3.1 Frost tolerance and water relations. 307. Overall, seedling frost survival increased through time in both nurseries with Mf nursery. 308. plants having lower frost survival than Cf nursery seedlings (Figure 2). However, this. 309. difference mainly was attributed to the Exp treatment at the Mf nursery, which had the lowest. 310. survival of all treatments both in September and November (Location × Fertilization (Date). 311. interaction, Table 1). Survival of the remaining treatments at both nurseries was high and did. 312. not significantly differ. In January, all fertilization treatments at the Mf location showed high. 313. frost survival with no significant differences among them.. 314. Fertilization regime affected the percentage of damaged seedlings after natural frosts. 315. at the Cf nursery (2= 27, P < 0.001). Damaged seedlings was highest in the Exp treatment. 316. (74 ± 6.9 %), intermediate in FL plants (49 ± 7.4 %), and lowest among C- plants (18 ± 6.2. 317. %).. 318. Ψπ100 and Ψπtlp were affected by the Location × Fertilization (Date) interaction (Table. 319. 1). Ψπ100 and Ψπtlp were more negative at the Cf nursery than at the Mf location in November. 320. but not in September. Mf seedlings did not show any variation in Ψπ100 and Ψπtlp across dates,. 321. except the Exp seedlings, which Ψπ100 and Ψtlp increased (less negative values) between. 322. September and November and then decreased (more negative values) between November and. 323. January (Figure 2). In contrast to the Mf nursery, Ψπ100 and Ψtlp in all fertilization treatments. 324. at the Cf nursery decreased through time, with no significant differences among fertilization. 325. treatments.. 12.
(15) 326. Dry weight fraction was higher at the Cf location than in the Mf location, but this only. 327. occurred in November (Location × Date interaction, Table 1). Exp seedlings had lower DWF. 328. than FL and C- plants but the differences was greater at the Mf nursery than at the Cf nursery. 329. (Figure 2). Cf plants showed significantly lower Vs/VT than Mf plants, while fertilization did. 330. not affect Vs/VT. Seedlings cultivated at the Cf location had lower TR than seedlings grown at. 331. the Mf nursery (0.67 ± 0.03 and 0.99 ± 0.08 mmol kg-1 s-1 for the Cf and Mf nurseries,. 332. respectively, F1,31=7.6, P = 0.009). Fertilization regime did not significantly affect TR. 333. (F2,31=0.84, P=0.44). Neither the modulus of elasticity nor WSDtlp were affected by any factor. 334. (Table 1).. 335 336. 3.2 Date of shoot elongation cessation. 337. Fertilization significantly affected the date of shoot elongation cessation (Table 2). The latest. 338. shoot elongation cessation was observed in the Exp plants and then in C+ plants, while FL. 339. plants ceased elongation the earliest. On average, 41 and 33% of Exp and C+ seedlings ceased. 340. elongation in October and November, while this percentage was 11.5 and 17.8% in FL and C-. 341. seedlings, respectively. Seedlings at the Mf nursery ceased shoot elongation approximately. 342. one month later than seedlings at the Cf nursery. 63% of Cf seedlings ceased shoot elongation. 343. prior to September while only 4% of the seedlings still elongated in October. In contrast, only. 344. 26.4% of Mf seedlings ceased elongation before September while 38.6 and 7% of plants still. 345. grew in October and November, respectively. Mean shoot elongation cessation date in all. 346. treatments occurred prior to fall fertilization application (Julian day 289).. 347 348. 3.3 Plant mass and nitrogen and soluble carbohydrates status. 349. Plant fractions were overall greater in the Mf nursery than in the Cf nursery, except for FL. 350. plants. Leaf and stem mass was greater in Exp and C+ seedlings than in FL and C- seedlings,. 13.
(16) 351. although differences were only significant in the Mf nursery (Fertilization. 352. interaction, Figure 3). Fertilization regime did not significantly affect root mass but it. 353. significantly affected the root/shoot ratio, with Exp and C+ plants having lower root/shoot. 354. values than FL and C- seedlings, which had similar root/shoot values.. ×. Location. 355. Cf plants had higher N concentration in all organs than Mf plants. Independent of the. 356. nursery, FL seedlings had the highest N concentration in all organs, whereas C- plants had the. 357. lowest. Overall, Exp and C+ plants had slightly lower N concentration than FL seedlings but. 358. much higher concentration than C- seedlings (Table 2). Nitrogen content was higher in Exp. 359. and C+ seedlings than in C- and FL plants (Table 2) and among these latter fertilization. 360. treatments, FL seedlings contained 12% more N than the C- seedlings. Plant N content was. 361. not affected by nursery location.. 362. Total leaf soluble carbohydrates concentration increased through time but it increased. 363. faster at the Cf location than at the Mf nursery (Date × Location interaction; Table 1 and. 364. Figure 4). Fertilization did not affect soluble carbohydrates concentration.. 365 366. 3.4 Relationship between variables. 367. Frost survival was positively related to DWF and leaf SC across treatments and dates (Figures. 368. 5a and b). Ψtlp was positively related to Ψ100 (r2=0.94 P<0.001) while Ψ100 was negatively. 369. related to DWF and SC concentration (r2=0.72, P<0.001 for DWF and r2=0.43, P<0.01 for SC. 370. concentration). DWF was positively related to soluble sugar concentration (r2=0.59; P=0.002). 371. and negatively related to Vs/VT (r2=0.38, P=0.02). Neither frost survival nor Ψ100 were. 372. significantly related to leaf N concentration (data not shown). Cold acclimation index was. 373. negatively related to the Julian day of shoot elongation cessation (Figure 5c) and positively. 374. related to the concentration of leaf soluble carbohydrates in November (Figure 5d). Similarly,. 375. frost survival in September was negatively related to the Julian day of elongation cessation. 14.
(17) 376. (Spearman correlation coefficient r=-1, P<0.001). However, no relationship was observed. 377. between frost survival in November and the Julian day of shoot elongation cessation (r2=0.33,. 378. P=0.23).. 379 380. 4. Discussion. 381. 4.1 Interaction between N nutrition and nursery fall temperature on drought and frost. 382. tolerance. 383. This study evidences that the exponential fertilization regime, which delivered two and five. 384. times more N than the FL and C- fertilization regimes, respectively, reduced cold and drought. 385. hardening of Q. ilex seedlings during the first part of the fall, as indicated by lower frost. 386. survival and tlp in September and November relative to the plants cultivated under a C- or. 387. FL fertilization regime. This supports our first hypothesis that high N supply would hinder. 388. frost and potential drought tolerance. In our study, higher drought tolerance was exclusively. 389. explained by reductions in 100 with the modulus of elasticity of cell walls having any. 390. contribution, which is consistent with previous studies in Q. ilex (Mollá et al., 2006; Villar-. 391. Salvador et al., 2004b). Unfortunately, as we could not include C+ plants in our stress. 392. hardening study, it was not possible to assess the importance of how high N delivery (constant. 393. vs. exponential) affects stress acclimation. High supply of N through the fall (FL plants) did. 394. not affect stress tolerance when compared to low conventionally fertilized seedlings (C-),. 395. which were not fertilized throughout the fall. This contrasts with results reported by Andivia. 396. et al. (2011) in Q. ilex and Islam et al., (2009) in Pinus resinosa Ait., which reported that fall. 397. fertilized seedlings had greater frost tolerance than conventionally fertilized plants.. 398. The effect of N fertilization on stress tolerance was context dependent: the lower. 399. drought (higher tlp) and frost tolerance in the exponentially fertilized plants relative to the. 400. rest of fertilization treatments occurred at the mild fall nursery but not at the cold fall location.. 15.
(18) 401. This supports our second hypothesis and provides insights into the role of N on cold and. 402. drought hardening of plants as it suggests a possible mechanism for understanding the. 403. discrepancies on the effect of N nutrition on cold and drought tolerance of woody plants.. 404. Thus, part of these discrepancies could be related to the environmental conditions, mainly. 405. temperature, at which experiments were done and the phenological stage of the plants when. 406. the cold and drought hardening measurements were carried out.. 407. Irrespective of fertilization, nursery location per se had a strong influence on the frost. 408. and potential drought tolerance of Q. ilex seedlings. Compared to Mf seedlings, Cf plants had. 409. higher frost survival and lower tlp and residual transpiration, which are traits that can. 410. potentially increase performance under dry conditions (Baltzer et al., 2008; Chaves et al.,. 411. 2003). Cold hardening differences related to nursery location have been also reported in. 412. conifers (Schuch et al., 1989) and in Q. ilex (Mollá et al., 2006). We suggest that plant. 413. functional differences between both nurseries were mainly due to distinct fall temperatures. 414. between locations. Several facts support this idea. First cumulative chilling hours strongly. 415. differed between locations (Figure 1). Second, photoperiod is less effective than the. 416. temperature in triggering cold acclimation in Q. ilex (Fernández et al., 2008), and winter. 417. solstice daylength is only 16 min longer in the Mf location than in Cf site. Finally, although. 418. cultivation variables affect plant functional attributes (Arnott et al., 1993; Villar-Salvador et. 419. al. 2004a, 2004a) practices were kept similar in both sites to avoid any confounding effects.. 420. Growth cessation is considered a prerequisite for cold and drought acclimation in. 421. woody plants (Sakai and Larcher, 1987). We observed that frost tolerance differences across. 422. treatments in September and the progress of cold hardening through the fall was linked to. 423. shoot elongation cessation day (Figure 5). Daylength, temperature or a combination of both. 424. are main environmental cues triggering shoot growth cessation in the fall (Saxe et al., 2002).. 425. Plants at the Mf nursery ceased shoot elongation later and had lower frost tolerance than. 16.
(19) 426. seedlings at the Cf nursery, suggesting that temperature played an important role in fall shoot. 427. phenology. Our results also point out that high N also controls plant phenology as indicated. 428. by delay in shoot elongation cessation in Exp plants relative to remainder treatments. Similar. 429. to our findings, high N fertilization also prolongs shoot elongation in the fall in several. 430. conifers (Hawkins et al., 1995; Rikala and Repo, 1997). This might be explained because the. 431. highest N addition rates in the Exp treatment occurred before shoot elongation cessation,. 432. while FL seedlings were loaded after shoot growth cessation in both locations, with no effect. 433. on growth resumption.. 434. Variation in frost tolerance and osmotic potential was related to treatment differences. 435. in DWF (Figure 4), which is a proxy of the symplasm solute concentration (Palacio et al.,. 436. 2008) and symplasm volume (Grossnickle, 1992). Part of the increase in DWF can be. 437. explained by changes in the fraction of symplasm volume, which decreased through time and. 438. was smaller at the Cf nursery than at the Mf nursery (Figure 4). A second source responsible. 439. for the increase in DWF was the concentration of soluble carbohydrates. Enhancement of. 440. frost and desiccation tolerance in plants has been frequently related to an increase in the. 441. concentration of soluble carbohydrates (Morin et al., 2007; Villar-Salvador et al., 2013a),. 442. which stabilize cell membranes during cell dehydration (Chaves et al., 2003; Uemura and. 443. Steponkus, 2003) caused by frosts and drought. Actively growing plants have low hardening. 444. capacity because they have less soluble carbohydrates, which probably are diverted to growth. 445. at the expense of cold and drought hardening (Greer et al., 2000). Several evidences support. 446. these arguments. First, increase in frost survival and decrease in osmotic potential across. 447. treatments increased with concentration of leaf SC (Figure 4). Second, cold acclimation index,. 448. a measure of cold hardening progress, was positively related to leaf SC concentration. Finally,. 449. plants cultivated in the Mf ceased shoot growth later and had lower SC than Cf plants.. 450. Although dry weight fraction and soluble carbohydrates explained part of the variations in. 17.
(20) 451. cold and drought tolerance across treatments, they seem not to explain the lower cold and. 452. drought tolerance of the Exp treatment in September, as we found no difference among. 453. fertilization treatments in former traits in September. This suggests that other factors not. 454. measured in this study such as K or proline tissue concentration might explain this. 455. discrepancy (Chaves et al. 2003; Sakai and Larcher 1987). 456. A very interesting and unexpected result of our study was that N fertilization. 457. treatments in the Cf nursery, which did not differ in frost tolerance to a single -12 ºC frost. 458. cycle either in September or November, showed clear damage differences after an abnormal. 459. long and intense period of cold weather from the end of December to mid January.. 460. Exponentially fertilized plants were the most damaged, C- plants showed the lowest degree of. 461. damage, and FL plants had intermediate values. Single frost tests have been extensively used. 462. in cold hardening studies (Andivia et al., 2011; Bigras 1997; Mollá et al., 2006; Morin et al.,. 463. 2007). Our results suggest that the methodology used to freeze the plants may determine the. 464. capacity to discriminate frost tolerance of fertilization treatments (Taulavuori et al., 2014).. 465. Two factors might explain this result. First, plants that remained in the nursery suffered. 466. multiple heavy frosts. Lund and Livingston (1998) concluded that multiple consecutive. 467. freezing cycles in Picea rubens Sarg. enhanced freezing injury relative to a single freezing. 468. cycle. Second, as roots usually are less cold tolerant than shoots (Bigras et al., 2001), it is. 469. possible that the multiple and heavy frost could have damaged the roots, but not the shoots.. 470. Root damage probably did not occur in the controlled frost tests because roots were isolated in. 471. styrofoam containers.. 472 473. 4.2 Growth and nutrient status as affected by nursery location and fertilization. 474. As per cold and drought tolerance, the effect of fertilization on Q. ilex seedling growth. 475. depended on the nursery. High N fertilization (C+ and Exp treatments) promoted shoot. 18.
(21) 476. development but the effect was stronger at the mild fall nursery than at the cold fall location.. 477. This can be partly explained by later shoot growth cessation of these treatments (Table 2) and. 478. to higher temperature at the Mf location. Late season fertilization did not stimulate shoot. 479. growth in the fall relative to C- fertilization. However, fall fertilized seedlings grew more than. 480. C- plants in the Cf nursery. This suggests that a deficient fertilization has a greater impact. 481. under cold conditions than under mild fall conditions. Additionally, this study shows that. 482. fertilization regime (constant vs. exponential) per se does not affect Q. ilex growth, as no. 483. significant differences in mass were found between both treatments. This confirms previous. 484. results in this species (Oliet et al., 2009b) that could be explained by the polycyclic growth. 485. pattern of Q. ilex, which results in a highly fluctuating nutrient demand (Oliet et al., 2013). 486. that does not match with an exponential supply of nutrients. In contrast to leaf and stem. 487. growth, root mass at the end of the culture was only affected by location, with root mass. 488. being greater at the Mf than at the Cf nursery, likely due to faster growth and longer growth. 489. period linked to higher temperatures. Lack of fertilization effects on root growth has been. 490. observed in previous studies with Q. ilex (Oliet et al., 2009b; Villar-Salvador et al., 2004a). 491. but also in other Quercus species (Berger and Glatzel, 2001; Sanz-Pérez et al., 2007),. 492. suggesting that oak seedlings have a conservative pattern of root mass allocation in response. 493. to nutrient availability. As a result, the higher root:shoot ratio in C- and FL plants relative to. 494. Exp or C+ seedlings was due to lower shoot development rather than increase in root growth.. 495. As per mass, the exponential fertilization regime did not increase N loading relative to. 496. the constant, indicating that the exponential fertilization is as effective in matching nutrient. 497. uptake with nutrient supply as the constant fertilization regime. As suggested by other. 498. authors, the effectiveness of exponential delivery on nutrient loading may be species-specific. 499. (Everett et al., 2007; Schott et al., 2013). Notably, fall loading was more effective in. 500. increasing seedling N concentration than Exp and C+ fertilization (Table 2) in spite of. 19.
(22) 501. delivering half of the nutrients than in the Exp and C+ treatments. Previous fall loading. 502. studies in Q. ilex and in other Mediterranean species have demonstrated that seedlings can. 503. uptake nutrients during the fall in mild fall nurseries (Andivia et al., 2011; Oliet et al., 2011;. 504. Trubat et al., 2008). The present study demonstrates that Q. ilex seedlings also can do it in. 505. cold fall locations. This can be achieved because high nutrient availability in the fall fosters. 506. nutrient uptake even if seedling nutrient demand is low, such as in hardening seedlings (Nacry. 507. et al., 2013) and because low fall temperature reduces but does not preclude nitrogen uptake. 508. (Warren, 2009).. 509. Seedlings raised at the Mf nursery had overall lower N concentrations than Cf. 510. seedlings, which confirms previous findings in this species (Mollá et al. 2006). This suggests. 511. that seedling N demand was greater than uptake capacity (Sanz-Pérez et al., 2007) in the Mf. 512. nurseries, probably driven by higher growth at the Mf location.. 513 514. 4.3 Conclusions and implication for nursery cultivation and forest plantation. 515. An exponential fertilization regime under mild fall conditions strongly hindered frost. 516. and drought tolerance in Q. ilex. This effect was not detected in exponentially fertilized plants. 517. cultivated under low fall temperature conditions as well as in conventionally low fertilized or. 518. in fall loaded seedlings. Independently of fertilization regime, seedlings grown at the mild fall. 519. site were bigger but less cold and drought tolerant and less enriched in N than the plants. 520. cultivated at the cold fall nursery. Lower stress tolerance at the mild fall nursery and. 521. differences among fertilization treatments were linked to a delay in shoot elongation cessation. 522. at the end of the summer and to a lower soluble carbohydrate accumulation. Conventionally. 523. and exponentially high N fertilized plants had the same size and contained similar amounts of. 524. nutrients. Fall loading significantly increased seedling N concentration but produced smaller. 525. seedlings than conventionally and exponentially high fertilized plants.. 20.
(23) 526. As far as we know, our study is the first to demonstrate that the effect of fertilization. 527. on seedling functional traits of Q. ilex differs between nurseries with distinct fall temperature. 528. conditions. This potentially can affect seedling outplanting performance (Mollá et al. 2006).. 529. Our results provide insights to how nursery cultivation must be modified according to the. 530. nursery temperature conditions in the fall. Specifically, exponential fertilization regime is not. 531. recommended when cultivating Q. ilex seedlings in mild fall nurseries, as it reduces frost and. 532. drought tolerance. Exponential fertilization does not improve Q. ilex seedling growth and N. 533. loading with regard to constant fertilization and showed higher susceptibility to natural frosts. 534. in cold fall nurseries. In contrast, fall fertilization, promotes nutrient loading in both mild and. 535. cold nurseries without compromising stress tolerance. As higher N status improves. 536. outplanting performance of Mediterranean oaks in dry and subhumid locations (Villar-. 537. Salvador et al., 2013b, 2004a), we recommend applying late season fertilization, especially. 538. for planting in frost-prone sites. To increase nutrient load of Q. ilex seedlings, future studies. 539. must be conducted to assess the effect of fall loading after higher pre-hardening N fertilization. 540. rates than the rates tested in this study. This presumably will increase not only nutrient status. 541. but also competitive abilities of larger outplanted seedlings (Cuesta et al., 2010).. 542 543. Acknowledgements. 544. We are grateful to the Centro “El Serranillo” (Ministerio de Agricultura, Alimentación y. 545. Medio Ambiente), which provided their facilities for plant cultivation in Guadalajara.. 546. Comments of two reviewers which contributed to improvement of the MS. Jorge Torres. 547. helped with the cultivation and measurements of the plants in Córdoba. NH was supported by. 548. a research contract of the Government of Madrid. The study was funded by projects. 549. AGL2006-12609-C02-01/FOR ENCINUT, AGL2011-24296 ECOLPIN (MICIIN), and the. 550. network REMEDINAL-2 (S2009/AMB/1783) of the Community of Madrid.. 21.
(24) 551 552. References. 553 554 555. Andivia, E., Fernández, M., Vázquez-Piqué, J., 2011. Autumn fertilization of Quercus ilex ssp. ballota (Desf.) Samp. nursery seedlings: effects on morpho-physiology and field performance. Ann. For. Sci. 68, 543–553.. 556 557 558 559. Andivia, E., Márquez-García, B., Vázquez-Piqué, J., Córdoba, F., Fernández, M., 2012. Autumn fertilization with nitrogen improves nutritional status, cold hardiness and the oxidative stress response of Holm oak (Quercus ilex ssp. ballota [Desf.] Samp) nursery seedlings. Trees 26, 311–320.. 560 561 562. Arnott, J.T., Grossnickle, S.C., Puttonen, P., Mitchel, A.K., Folk, R.S., 1993. Influence of nursery culture on growth, cold hardiness, and drought resistance of yellow cypress. Can. J. For. Res. 23, 2537–2547.. 563 564 565. Baltzer, J.L., Davies, S.J., Bunyavejchewin, S., Noor, N.S.M., 2008. The role of desiccation tolerance in determining tree species distributions along the Malay–Thai Peninsula. Funct. Ecol. 22, 221–231.. 566 567. Berger, T.W., Glatzel, G., 2001. Response of Quercus petraea seedlings to nitrogen fertilization. For. Ecol. Manege. 149, 1–14.. 568 569. Bigras, F.J., 1997. Root cold tolerance of black spruce seedlings: viability tests in relation to survival and regrowth. Tree Physiol. 17, 311–318.. 570 571 572 573. Bigras, F.J., Ryyppo, A., Lindström, A., Stattin, E., 2001. Cold Acclimation and deacclimation of shoots and Roots of conifer seedlings, In: Bigras, F.J., Colombo, S.J. (Eds.), Conifer cold hardiness. Kluwer Academic Publishers, Dordrecht - Boston, pp. 57–88.. 574 575 576. Calme, S., Margolis, H.A., Bigras, F.J., 1993. Influence of cultural-practices on the relationship between frost tolerance and water-content of containerized Black Spruce, White Spruce, and Jack Pine seedlings. Can. J. For. Res. 23, 503–511.. 577 578. Chaves, M.M., Maroco, J.P., Pereira, J.S., 2003. Understanding plant responses to droughtfrom genes to the whole plant. Funct. Plant Biol. 30, 239–264.. 579 580 581 582. Cuesta, B., Villar-Salvador, P., Puértolas, J., Jacobs, D., Rey-Benayas, J.M., 2010. Why do large, nitrogen rich seedlings better resist stressful transplanting conditions? A physiological analysis in two functionally contrasting Mediterranean forest species. For. Ecol. Manage. 260, 71–78.. 583 584 585. Dumroese, R.K., Page-Dumroese, D.S., Salifu, K.F., Jacobs, D.F., 2005. Exponential fertilization of Pinus monticola seedlings: nutrient uptake efficiency, leaching fractions, and early outplanting performance. Can. J. For. Res. 35, 2961–2967.. 586 587. Floistad, I.S.; Granhus, A. 2010. Bud break and spring frost hardiness in Picea abies seedlings in response to photoperiod and temperatura treatments Can. J. For. Res. 40: 968-976. 22.
(25) 588 589 590. Everett, K.T., Hawkins, B.J., Kiiskila, S., 2007. Growth and nutrient dynamics of Douglas-fir seedlings raised with exponential or conventional fertilization and planted with or without fertilizer. Can. J. For. Res. 7, 2552–2562.. 591 592 593. Fernández, M., Alejano, R., Domínguez, L., Tapias, R., 2008. Temperature controls cold hardening more effectively than photoperiod in four Mediterranean broadleaf evergreen species. Tree For. Sci. Biotechnol. 2, 43–49.. 594 595 596. Fernández, M., Marcos, C., Tapias, R., Ruiz, F., López, G., 2007. Nursery fertilisation affects the frost-tolerance and plant quality of Eucalyptus globulus Labill. cuttings. Ann. For. Sci. 64, 865–873.. 597 598 599. Greer, D.H., Robinson, L.A., Hall, A.J., Klages, K., Donninson, H., 2000. Frost hardening of Pinus radiata seedlings: effects of temperature on relative growth rate, carbon balance and carbohydrate concentration. Tree Physiol. 20, 107–114.. 600 601. Grossnickle, S.C., 1992. Relationship between freezing tolerance and shoot water relations of western red cedar. Tree Physiol. 11, 229–240.. 602 603. Grossnickle, S.C., 2012. Why seedlings survive: influence of plant attributes. New For. 43, 711–738.. 604 605. Harvey, H.P., van den Driessche, R., 1997. Nutrition, xylem cavitation and drought resistance in hybrid poplar. Tree Physiol. 17, 647–654.. 606 607 608. Hawkins, B.J., Davradou, M., Pier, D., Shortt, R., 1995. Frost hardiness and winter photosynthesis of Thuja plicata and Pseudotsuga menziesii seedlings grown at three rates of nitrogen and phosphorus supply. Can. J. For. Res. 25, 18–28.. 609 610 611. Islam, M.A., Apostol, K.G., Jacobs, D.F., Dumroese, R.K., 2009. Fall fertilization of Pinus resinosa seedlings: nutrient uptake, cold hardiness, and morphological development Ann. For. Sci. 66, 704–712.. 612 613 614 615. Jacobs, D.F.; Salifu, K.F.; Oliet Palá, J. 2009 Sobrecarga exponencial de nutrientes para la optimización de la fertilización en vivero de plantas de Quercus ilex L. Proceedings of the V Congreso Forestal Español. Communication Ref. 5CFE01-270 ISBN 978-84936854-6-.. 616 617 618. Kleiner, K.W., Abrams, M.D., Schultz, J.C. 1992. The impact of water and nutrient deficiencies on the growth, gas exchange and water relations of red oak and chestnut oak. Tree Physiol. 11, 271–287.. 619 620 621 622. Kreyling, J., Wiesenberg, G.L.B., Thiel, D., Wohlfart, C., Huber, G., Walter, J., Jentsch, A., Konnert, M., Beierkuhnlein, C., 2012. Cold hardiness of Pinus nigra Arnold as influenced by geographic origin, warming, and extreme summer drought. Env. Exp. Bot. 78, 99–108.. 623 624. Kubiske, M.E., Abrams, M.D., 1990. Pressure-volume relationships in non-rehydrated tissue at various water deficits. Plant, Cell Env. 13, 995–1000.. 23.
(26) 625 626. Lund, A.E., Livingston, W.H., 1998. Freezing cycles enhance winter injury in Picea rubens. Tree Physiol. 19, 65–69.. 627 628 629. Mollá, S., Villar-Salvador, P., García-Fayos, P., Peñuelas Rubira, J.L., 2006. Physiological and transplanting performance of Quercus ilex L. (holm oak) seedlings grown in nurseries with different winter conditions. For. Ecol. Manage. 237, 218–226.. 630 631 632 633. Morin, X., Améglio, T., Ahas, R., Kurz-Besson, C., Lanta, V., Lebourgeois, F., Miglietta, F., Chuine, I., 2007. Variation in cold hardiness and carbohydrate concentration from dormancy induction to bud burst among provenances of three European oak species. Tree Physiol. 27, 817–25.. 634 635 636. Nacry, P., Bouguyon, E., Gojon, A., 2013. Nitrogen acquisition by roots: physiological and developmental mechanisms ensuring plant adaptation to a fluctuating resource. Plant Soil 370, 1–29.. 637 638 639. Oliet, J., Planelles, R., Artero, F., Valverde, R., Jacobs, D., Segura, M., 2009a. Field performance of Pinus halepensis planted in Mediterranean arid conditions: relative influence of seedling morphology and mineral nutrition. New For. 37, 313–331.. 640 641 642. Oliet, J., Tejada, M., Salifu, K., Collazos, A., Jacobs, D., 2009b. Performance and nutrient dynamics of holm oak (Quercus ilex L.) seedlings in relation to nursery nutrient loading and post-transplant fertility. Eur. J. For. Res. 128, 253–263.. 643 644 645. Oliet, J.A., Puértolas, J., Planelles, R., Jacobs, D.F., 2013. Nutrient loading of forest tree seedlings to promote stress resistance and field performance: a Mediterranean perspective New Forests 44(5): 649-669. New For. 44, 649–669.. 646 647 648. Oliet, J.A., Salazar, J.M., Villar, R., Robredo, E., Valladares, F., 2011. Fall fertilization of Holm oak affects N and P dynamics, root growth potential, and post-planting phenology and growth. Ann. For. Sci. 68, 647–656.. 649 650 651. Palacio, S., Milla, R., Albuixech, J., Pérez-Rontomé, C., Camarero, J.J., Maestro, M., Gabriel Montserrat, 2008. Seasonal variability of dry matter content and its relationship with shoot growth and nonstructural carbohydrates. New Phytol. 180, 133–142.. 652 653 654. Pardos M, Jiménez MD, Aranda I, Puértolas J, Pardos JA (2005) Water relations of cork oak (Quercus suber L.) seedlings in response to shading and moderate stress. Ann For Sci 62:377–384. 655 656 657. Premachandra, G.S., Saneoka, H., Fujita, K., Ogata, S., 1992. Leaf water relations, osmotic adjustement, cell membrane stability, epicuticular wax load and growth as affected by water deficits in Sorghum. J. Exp. Bot. 43, 1569–1576.. 658 659 660. Puertolas, J., Gil, L., Pardos, J.A., 2005. Effects of nitrogen fertilization and temperature on frost hardiness of Aleppo pine (Pinus halepensis Mill.) seedlings assessed by chlorophyll fluorescence. Forestry 78, 501–511.. 24.
(27) 661 662 663. Repo, T., Zhang, G., Ryyppö, A., Rikala, R., Vuorinen, M., 2000. The relation between growth cessation and frost hardening in Scots pines of different origins. Trees 14, 456– 464.. 664 665. Rikala, R., Repo, T., 1997. The effect of late summer fertilization on the frost hardening of second-year Scots pine seedlings. New For. 14, 33–44.. 666 667. Sakai, A., Larcher, W., 1987. Frost survival of plants. Responses and adaptation to freezing stress., Ecological Studies, 62. Springer, Berlin.. 668 669. Salifu, K.F., Timmer, V.R., 2003a. Optimizing nitrogen loading of Picea mariana seedlings during nursery culture. Can. J. For. Res. 33, 1287–1294.. 670 671. Salifu, K.F., Timmer, V.R., 2003b. Nitrogen retranslocation response of young Picea mariana to nitrogen-15 supply. Soil Sci. Soc. Am. J. 67, 309–317.. 672 673 674. Saneoka, H., Moghaieb, R.E.A., Premachandra, G.S., Fujita, K., 2004. Nitrogen nutrition and water stress effects on cell membrane stability and leaf water relations in Agrostis palustris Huds. Env. Exp. Bot. 52, 131–138.. 675 676 677. Sanz-Pérez, V., Castro-Díez, P., Valladares, F., 2007. Growth versus storage: responses of Mediterranean oak seedlings to changes in nutrient and water availabilities. Ann. For. Sci. 64, 201–210.. 678 679. Saxe, H., Cannell, M.G.R., Johnsen, Ø., Ryan, M.G., Vourlitis, G., 2002. Tree and forest functioning in response to global warming. New Phytol. 149, 369–399.. 680 681 682. Schott, K.M., Pinno, B.D., Landhäusser, S.M., 2013. Premature shoot growth termination allows nutrient loading of seedlings with an indeterminate growth strategy. New For. 44, 635–647.. 683 684. Schuch, U.K., Duryea, M.L., Fuchigami, L.H., 1989. Frost hardiness as acquired by Douglasfir seedlings in three Pacific Northwest nurseries. Can. J. For. Res. 19, 192–197.. 685 686 687 688. Shenk, J.S., Westerhaus, M.O., 1994. The application of near infra-red reflectance spectroscopy (NIRS) to forage analysis., in: Fahey, G.C.J. (Ed.), Forage Quality Evaluation and Utilization. American Society of Agronomy, Crop Science Society of America, Soil Science Society of America, Madison, Wisconsin, USA, pp. 406–449.. 689 690 691. Siles, G., Rey, P.J., Alcántara, J.M., Bastida, J.M., Herreros, J.L., 2010. Effects of soil enrichment, watering and seedling age on establishment of Mediterranean woody species. Acta Oecol. 36, 357–364.. 692 693. Tan, W., Hogan, G.D., 1995. Effects of nitrogen limitation on water relations of jack pine (Pinus banksiana Lamb.) seedlings. Plant Cell Env. 18, 757–764.. 694 695 696. Taulavuori, K., Taulavuori, E., Sheppard, L.J., 2014. Truths or myths, fact or fiction, setting the record straight concerning nitrogen effects on levels of frost hardiness. Env. Exp. Bot. in press.. 25.
(28) 697 698 699. Thomas, F.M., Ahlers, U., 1999. Effects of excess nitrogen on frost hardiness and freezing injury of above-ground tissue in young oaks (Quercus petraea and Q . robur). New Phytol. 144, 73–83.. 700 701 702. Timmer, V.R., Aidelbaum, A.S., 1996. Manual for exponential nutrient loading of seedlings to improve outplanting performance on competitive forest sites. NODA/NFP, Ministry of Natural Resources of Ontario, Ontario.. 703 704 705. Trubat, R., Cortina, J., Vilagrosa, A., 2008. Short-term nitrogen deprivation increases field performance in nursery seedlings of Mediterranean woody species. J. Arid Env. 72, 879– 890.. 706 707 708. Uemura, M., Steponkus, P.L., 2003. Modification of the intracellular sugar content alters the incidence of freeze-induced membrane lesions of protoplasts isolated from Arabidopsis thalianaleaves. Plant Cell Env. 26, 1083–1096.. 709 710. Valdecantos, A., Cortina, J., Vallejo, R., 2006. Nutrient status and field performance of tree seedlings planted in Mediterranean degraded areas. Ann. For. Sci. 63, 249–256.. 711 712 713. Villar-Salvador, P., Peñuelas, J., Jacobs, D., 2013a. Nitrogen nutrition and drought hardening exert opposite effects on the stress tolerance of Pinus pinea L. seedlings. Tree Physiol. 33, 221–232.. 714 715 716. Villar-Salvador, P., Peñuelas, J.L., Nicolás-Peragón, J.L., Benito, L.F., Domínguez-Lerena, S., 2013b. Is nitrogen fertilization in the nursery a suitable tool for enhancing the performance of Mediterranean oak plantations? New For. 44, 733–751.. 717 718 719. Villar-Salvador, P., Planelles, R., Enríquez, E., Peñuelas Rubira, J.L., 2004a. Nursery cultivation regimes, plant functional attributes, and field performance relationships in the Mediterranean oak Quercus ilex L. For. Ecol. Manage. 196, 257–266.. 720 721 722. Villar-Salvador, P., Planelles, R., Oliet, J., Peñuelas-Rubira, J.L., Jacobs, D.F., González, M., 2004b. Drought tolerance and transplanting performance of holm oak (Quercus ilex) seedlings after drought hardening in the nursery. Tree Physiol. 24, 1147–1155.. 723 724. Warren, C.R., 2009. Why does temperature affect relative uptake rates of nitrate, ammonium and glycine: A test with Eucalyptus pauciflora. Soil Biol. Biochem. 41, 778–784.. 725 726 727 728 729 730 731 26.
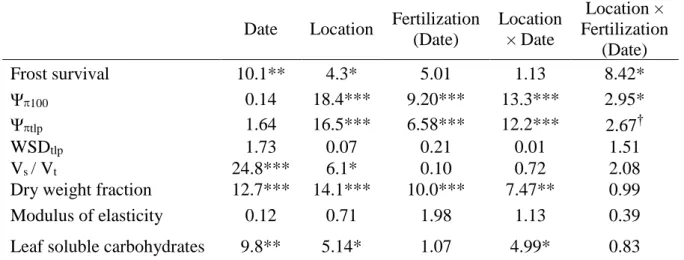
(29) 732 733 734 735 736 737 738. Table 1. Chi-square (for survival) and F- (remainder traits) values and statistical significance. 739. obtained from statistical analyses on the effect of date, nursery location and fertilization. 740. regime on the survival after a -12 ºC frost, water relations and soluble sugar concentration in. Frost survival Ψ100 Ψtlp WSDtlp Vs / Vt Dry weight fraction Modulus of elasticity Leaf soluble carbohydrates. Date. Location. Fertilization (Date). Location × Date. 10.1** 0.14 1.64 1.73 24.8*** 12.7*** 0.12. 4.3* 18.4*** 16.5*** 0.07 6.1* 14.1*** 0.71. 5.01 9.20*** 6.58*** 0.21 0.10 10.0*** 1.98. 1.13 13.3*** 12.2*** 0.01 0.72 7.47** 1.13. Location × Fertilization (Date) 8.42* 2.95* 2.67† 1.51 2.08 0.99 0.39. 9.8**. 5.14*. 1.07. 4.99*. 0.83. 741. Quercus ilex seedlings. Ψ100 and Ψtlp: Osmotic potential at at full turgor and at the turgor. 742. loss point, respectively, WSDtlp: water saturation deficit at the turgor loss point, Vs / VT:. 743. Volume symplast / Total volume. *** P < 0.001, ** P < 0.01, * P < 0.05, † P < 0.06.. 744. 27.
(30) Table 2. Julian day of shoot elongation cessation, root to shoot ratio, and tissue nutrient status in Quercus ilex seedlings that were cultivated under four fertilization regimes (C-: Conventional low; FL: Fall loading; Exp: Exponential; C+: conventional high) and at two nurseries with contrasting fall conditions. Data are means ± 1 SE, n= 18 for the first two variables and n= 6 for nutrient traits. The last three columns are F data from two-way ANOVA. *** P < 0.001, ** P < 0.01, * P < 0.05. Fertilization. ANOVA results. C-. FL. Exp. C+. Mild fall. Cold fall. Fertilization. Location. F×L. 247 ±5.8. 237 ± 5.9. 264 ± 4.9. 255 ± 6.3. 264 ± 3.5. 236 ± 3.7. 4.91 **. 28.3 ***. 1.66. 1.18 ± 0.05. 1.14 ± 0.08. 0.79 ± 0.03. 0.82 ± 0.05. 0.96 ± 0.05 1.01 ± 0.04. 14.0 ***. 1.50. 2.32. Julian day of shoot elongation cessation Root/Shoot. Nursery location. N concentration (mg g-1) Leaf. 13.5 ± 0.3. 17.6 ± 0.3. 16.8 ± 0.3. 16.3 ± 0.3. 15.3 ± 0.3. 16.9 ± 0.3. 31.8 ***. 22.9 ***. 0.02. Stem. 6.1 ± 0.4. 10.5 ± 0.3. 9.6 ± 0.4. 8.9 ± 0.4. 7.7 ± 0.3. 9.8 ± 0.4. 29.6 ***. 34.9 ***. 2.19. Root. 5.8 ± 0.3. 9.4 ± 0.3. 8.2 ± 0.2. 8.5 ± 0.5. 7.7 ± 0.3. 8.3 ± 0.3. 23.0 ***. 6.3 *. 1.51. 38 ± 3. 43 ± 3. 54 ± 5. 52 ± 3. 49 ± 3. 45 ± 3. 3.65 *. 0.61. 0.88. Plant N content (mg). 28.
(31) Figure legends Figure 1. Cumulative chilling (air temperature <8 ºC) hours from Julian day 214 (August 1, 2008) to day 365 (December 31, 2008) in the mild fall and cold fall nurseries. The arrow indicates the Julian day when the Exponential and constant fertilization finished and started the fall loading treatment.. Figure 2. Seasonal variation of survival after a -12 ºC frost (a), leaf soluble carbohydrates concentration (b), the osmotic potential at full saturation (c) and at the turgor lost point (d), dry weight fraction (e) and the symplast volume fraction (f) in Quercus ilex seedlings cultivated at two nurseries with a mild and cold fall temperature conditions with three fertilization regimes (C-: constant low N rate, Exp: exponential, FL: fall loading). In January, we only show data for the mild fall nursery because the plants in the cold fall nursery were damaged by heavy frosts that occurred in late December and early January (see Material and Methods). Data are means ± one standard error.. Figure 3. Leaf (a), stem (b), and root (c) mass in Quercus ilex seedlings cultivated at two nurseries with contrasting fall temperature conditions and under four fertilization regimes (C-: constant regime at low N rate; FL: fall loading after a C- fertilization regime; C+: constant regime at high N rate; Exp: exponential regime). Data are means ± one standard error. ANOVA results are given in each figure. ***: P < 0.001, **: P < 0.01, *: P < 0.05, †: P < 0.06.. Figure 4. Relation of frost survival with (a) dry weight fraction and (b) total leaf soluble carbohydrates concentration in Quercus ilex seedlings. Subfigure (c) shows the relation between cold acclimation index and the Julian day of shoot elongation cessation and. 29.
(32) subfigure (d) presents the relation between total leaf soluble carbohydrates and cold acclimation index. Points are means ± one SE. Subfigures (a) and (b) have been made with treatment means of September, November and January.. 30.
(33) Figure 1. 31.
(34) Figure 2. 32.
(35) Figure 3. 33.
(36) Figure 4. 34.
(37)
Figure

Documento similar