Two new feature selection algorithms with Rough Sets Theory
Yailé Caballero(1), Rafael Bello(2), Delia Alvarez(1), Maria M. Garcia(2) (1)Department of Computer Science, University of Camagüey, Cuba.
{yaile, dalvarez}@inf.reduc.edu.cu
(2)Department of Computer Science, Universidad Central de Las Villas, Cuba. {rbellop, mmgarcia}@uclv.edu.cu
Abstract: Rough Sets Theory has opened new trends for the development of the Incomplete Information Theory. Inside this one, the notion of reduct is a very significant one, but to obtain a reduct in a decision system is an expensive computing process although very important in data analysis and knowledge discovery. Because of this, it has been necessary the development of different variants to calculate reducts. The present work look into the utility that offers Rough Sets Model and Information Theory in feature selection and a new method is presented with the purpose of calculate a good reduct. This new method consists of a greedy algorithm that uses heuristics to work out a good reduct in acceptable times. In this paper we propose other method to find good reducts, this method combines elements of Genetic Algorithm with Estimation of Distribution Algorithms. The new methods are compared with others which are implemented inside Pattern Recognition and Ant Colony Optimization Algorithms and the results of the statistical tests are shown.
1. Introduction
Feature selection is an important task inside Machine Learning. It consists of focusing on the most relevant features for use in representing data in order to delete those features considered as irrelevant and that make more difficult a knowledge discovery process inside a database. Feature subset selection represents the problem of finding an optimal subset of features (attributes) of a database according to some criterion, so that a classifier with the highest possible accuracy can be generated by an inductive learning algorithm that is run on data containing only the subset of features [Zho01].
Rough Sets Theory was proposed by Z. Pawlak in 1982 [Paw82] and had received many extensions from his author that can be reviewed in [Paw91], [Paw94] and [Paw95]. The Rough Set philosophy is founded on the assumption that some information is associated with every object of the universe of discourse [Kom99a] and [Pol02]. Rough Set Model has several advantages to data analysis. It is based only on the original data and does not need any external information; no assumptions about data are necessary; it is suitable for analyzing both quantitative and qualitative features, and results of Rough Set Model are easy to understand [Tay02]. Several toolkits based on rough sets to data analysis have been implemented, such as Rosetta [Ohr97], and ROSE [Pre98]. An important issue in the RST is about feature selection.
An important issue in the RST is about feature reduction based on reduct concept. A reduct is a minimal set of attributes B⊆A such that IND(B)=IND(A), where IND(X) is called the X-indiscernibility relation. In other words, a reduct is a minimal set of attributes from A that preserves the partitioning of universe (and hence the ability to perform classifications) [Kom99b].
The employment of reducts in the selection and reduction of attributes has been studied by various authors, among them are [Koh94], [Car98], [Pal99], [Kom99b], [Ahn00] and [Zho01].
cost [Wro95], [Wro96], and [Wro98]; and others based on heuristic methods [Deo95], [Cho96], [Bel98], and [Deo98].
In this paper, two new methods for feature selection and its experimental results are presented: one of them using an evolutionary approach (epigraph 2) and the other by a greedy algorithm with heuristic functions (epigraph 3), which uses Rough Sets Theory.
2. Feature selection by using an evolutionary approach
The evolutionary approach had been used to develop methods for calculating reducts. Genetic Algorithms (GA) are search methods based on populations: Firstly, a population of random individuals is generated, the best individuals are selected, and lastly, the new individuals that make up the population will be generated using the mutation and crossover operators. In [Wro95], three methods for finding short reducts are presented. These use genetic algorithms and a greedy method and have defined the adaptability functions f1, f2 and f3.
An adaptation of the Genetic Algorithm plan is the Estimation of Distribution Algorithms (EDA) [Muh99] but most of them don’t use crossover or mutation because the new population is generated from the distribution of the probability estimated from the selected set. The principal problem of the EDA is the estimation of ps(x, t) and the generation of new points according to this distribution in a way that the computational effort is reasonable. For this reason, different approaches have been introduced to obtain the estimation of ps(x, t).
One of the members of this family is the Univariate Marginal Distribution Algorithm (UMDA) for discrete domain [Muh98], which shows taking into account only univariate probabilities. This algorithm is capable of optimizing non-lineal functions, always and when the additive variance (lineal) of the problem has a reasonable weight in the total variance. The UMDA for continuous domain was introduced in 1999. In every generation and for every variable, the UMDA carries out statistic tests to find the density function that best adjusts to the variable. UMDA for continuous domain is an algorithm of structure identification in the sense that the density components are identified through hypothesis tests.
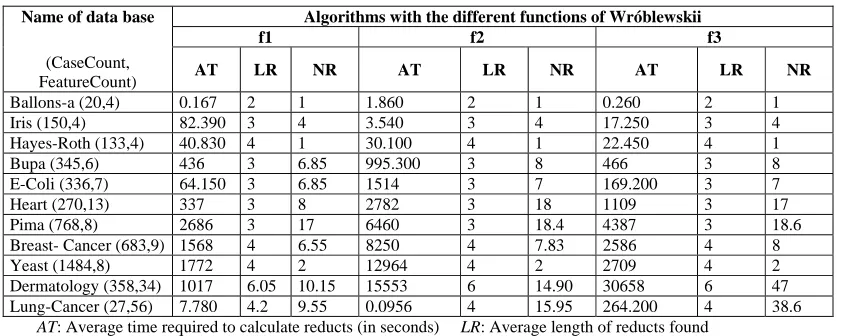
[image:2.612.92.513.476.644.2]We have defined a method for calculating reducts starting from the integration of the adaptability functions (f1, f2, y f3) of the methods reported by Wróblewski in [Wro95] and the UMDA method, obtaining satisfactory results which are shown in Table 1. The values of the parameters that were used were: N = 100; g = 3000; e = 50; T = 0.5; where N is the number of individuals, g is the maximum number of evaluations that will be done, e is elitism, which means that the best 50 pass directly to the next generation; T is the percentage of the best that were selected to do all the calculations.
Table 1. Results obtained with the proposed Estimation Distribution Algorithms (EDA)
Algorithms with the different functions of Wróblewskii
f1 f2 f3
Name of data base (CaseCount,
FeatureCount) AT LR NR AT LR NR AT LR NR
Ballons-a (20,4) 0.167 2 1 1.860 2 1 0.260 2 1
Iris (150,4) 82.390 3 4 3.540 3 4 17.250 3 4
Hayes-Roth (133,4) 40.830 4 1 30.100 4 1 22.450 4 1
Bupa (345,6) 436 3 6.85 995.300 3 8 466 3 8
E-Coli (336,7) 64.150 3 6.85 1514 3 7 169.200 3 7
Heart (270,13) 337 3 8 2782 3 18 1109 3 17
Pima (768,8) 2686 3 17 6460 3 18.4 4387 3 18.6 Breast- Cancer (683,9) 1568 4 6.55 8250 4 7.83 2586 4 8 Yeast (1484,8) 1772 4 2 12964 4 2 2709 4 2 Dermatology (358,34) 1017 6.05 10.15 15553 6 14.90 30658 6 47 Lung-Cancer (27,56) 7.780 4.2 9.55 0.0956 4 15.95 264.200 4 38.6
AT: Average time required to calculate reducts (in seconds) LR: Average length of reducts found
NR: Average number of reducts found
3 Feature selection using Rough Sets Theory
Rough Sets Theory is a mathematical tool that had been used successfully to discover data dependencies and reduce the number of attributes contained in a dataset by purely structural methods [Jen03].
Reducts that are obtained by using Rough Sets are very informative and all the other attributes can be removed with a minimal information loss due to the use of the degree of dependency measure suggested by Ziarko in [Zia01] and very used by many others authors [Mod93], [Zho01], [Jen03].
Algorithms that calculate reducts are usually designed by using heuristics or random search strategies in order to reduce complexity. Heuristic search is very fast because this is not necessary to wait until the search ends but it doesn’t’ guarantee the best solution although a better one is known when it is founded in the process.
Now we are able to present RSReduct, a new method for finding reducts with Rough Sets. This is a greedy algorithm that starts with an empty set of attributes and builds good reducts in acceptable times by means of heuristic searches and it works adding the best measurement features by the heuristic function.
The idea of this algorithm is based on criteria of the ID3 method with respect to the normalized entropy and the gain of the attributes [Mit97] and dependency between attributes by means of Rough Sets.
In this algorithm we use the terms R(A) and H(A) proposed in [Piñ03].
The expression for R(A) which is a relevant measure of the attributes (0≤R(A)≤ 1) is:
) 1 (
1
)
(
Cik
i
i
e
S
S
A
R
−=
∑
=
(1)
Where k is the number of different values of feature A. Ci is the number of different classes present in the objects that have the value i for the feature A. |Si| the amount of objects with the value i in the feature A, and |S| is the amount of objects of the training set. This measure maximizes the heterogeneity among objects of different classes and minimizes the homogeneity among objects of the same one.
H(A) is obtained by the following algorithm:
1. For all the attributes of the problem, calculate their R(A) and form a vector. Determine the n best attributes for the calculations of the previous step. The value of n can be selected by the user. As a result of this step the vector RM=(R(Ai), R(Aj),..) with n = |RM| is obtained. 2. Determine the combinations of n in p (the value selected by the user) from the selected
attributes in step II. The combination vector is obtained.
Comb=(
{
Ai,Aj,Ak} {
,...Ai,At,Ap}
. (2)3. Calculate the dependency grade of the classes with respect to each one of the combinations obtained in the previous step. As a result of this step, the dependency vectors are obtained.
( )
d
(
k
(
Comb
1
,
d
),
k
(
Comb
2
,
d
),...
k
(
Combr
,
d
))
DEP
=
(3)where U
D POS
k= B( )
(4) and
) (
*
)
( B X
B D POS =∪
(5)
4. For each attribute “A” the value of H(A) is calculated by the following formula :
∑
∀ ∈=
Combi A
i k Combi d
A H / ( , ) ) ( (6)
Another alternative measure that has been used successfully is the gain ratio [Mit97]:
S S S S A S mation
SplitInfor C i
i i
∑
=−
= 1 log2
) , (
(7)
where C are the values of attribute A. This measure is the entropy of S with respect to attribute A. The Gain Ratio measure (G(A)) is defined in terms of the earlier Gain measure [Mit97] and it means how much information gain produce attribute A or how important is this one to the database, as well a this SplitInformation, as follows:
) , ( ) , ( ) ( A S mation SplitInfor A S Gain A G = (8)
∑
∈ − = ) ( ) ( ) ( ) , ( A values v v v S Entropy S S S Entropy A S Gain (9)where,
values
(
A
)
is the set of possible values by attribute A andS
v is the subset ofS
forwhich A has the value
v
, that is,S
v=
{
s
∈
S
A
(
S
)
=
v
}
.
∑
= − = c i i i P P S Entropy 1 2 log ) ( (10)where,
P
i is the proportion ofS
belonging to classi
.Schlimmer and Tan in 1993 demonstrate that more efficient recognition strategies are learned, without sacrificing classification accuracy, by replacing the information gain attribute selection measure by the following measure [Mit97]:
)
(
)
,
(
)
(
2A
Cost
A
S
Gain
A
C
=
(11)where Cost(A) is a parameter entered by the user which represents the cost of attribute A, a value between 0 and 1.
Nuñez in 1988 describes other measure [Mit97]:
w A S Gain
A
Cost
A
C
)
1
)
(
(
1
2
)
(
) , (+
−
=
(12)where Cost(A) is a parameter entered by the user which represents the cost of attribute A, a value between 0 and 1 and W is a constant value between 0 and 1 that determines the relative importance of the cost versus information gain.
Considering the measures R(A), H(A), G(A) and C(A) the new algorithm RSReduct, was written as follows:
Step1. Form the distinction table with a binary matrix B (m2-m)/2 x (N+1). Each row corresponds to a pair of different objects. Each column of this matrix corresponds to an attribute; the last column corresponds to the decision (treated as an attribute).
Let b((k,n), i) an element of B corresponding to the pair (Ok,On) and the attribute i, for i that belongs to {1,....,N}
{
N
}
where
ℜ
is similarity relation depending on the type of attributea
i.Step2. For each attribute “A”, calculate the value of RG(A) for any of the following three heuristics and then form an ordered list of attributes starting from the most relevant attribute (which maximizes RG(A)).
Heuristic1: RG(A)=R(A)+H(A) (15)
Heuristic2: RG(A)=H(A)+G(A) (16)
Heuristic3: RG(A)=H(A)+C(A) (17)
Step3. With i=1, R = an empty set and (A1, A2,...An) an ordered list of attributes according to step 2, consider if i<=n then R=RUAi, i=i+1.
Step4. If R satisfies the Condition I then Reduct = minimal subset
R
'
⊆
R
does meet Condition I, stop (which means end).n
k
,
∀
∀
a
i∈
R
a
i(
o
k)
ℜ
a
i(
o
n)
⇒
d
(
o
k)
=
d
(
o
n)
(Condition I)
Step5. In other case, repeat from step 3.
The Condition I, in step P4, uses the following relation between the objects
x
andq
for the featurea
:ε
≥
⇔
ℜ
a(
a,
a)
a
x
sim
x
q
q
, where
0
≤
ε
≤
1
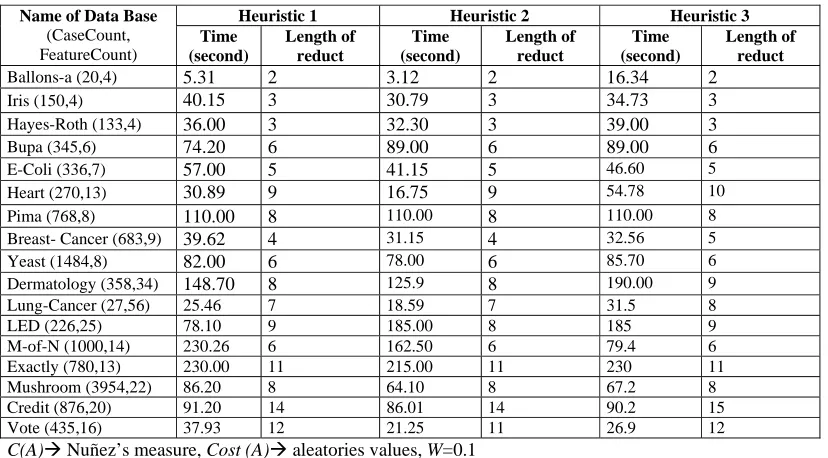
RSReduct algorithm was tested with several datasets from the UCI machine learning repository that is available in the ftp site of the University of California. Some of the databases belong to real world data such as Vote, Iris, Breast Cancer, Iris, Heart and Credit, the other ones represent results obtained in labs such as Balloons-a, Hayes-Roth, LED, M-of-N, Lung Cancer and Mushroom.
[image:5.612.107.521.410.639.2]The following results were obtained after using RSReduct with the three heuristic functions defined, also the execution time of the algorithm is compiled in each case:
Table 2. Results obtained with the proposed Algorithm according to the different heuristics.
Heuristic 1 Heuristic 2 Heuristic 3 Name of Data Base
(CaseCount, FeatureCount)
Time (second)
Length of reduct
Time (second)
Length of reduct
Time (second)
Length of reduct
Ballons-a (20,4) 5.31 2 3.12 2 16.34 2
Iris (150,4) 40.15 3 30.79 3 34.73 3
Hayes-Roth (133,4) 36.00 3 32.30 3 39.00 3
Bupa (345,6) 74.20 6 89.00 6 89.00 6
E-Coli (336,7) 57.00 5 41.15 5 46.60 5
Heart (270,13) 30.89 9 16.75 9 54.78 10
Pima (768,8) 110.00 8 110.00 8 110.00 8
Breast- Cancer (683,9) 39.62 4 31.15 4 32.56 5
Yeast (1484,8) 82.00 6 78.00 6 85.70 6
Dermatology (358,34) 148.70 8 125.9 8 190.00 9 Lung-Cancer (27,56) 25.46 7 18.59 7 31.5 8
LED (226,25) 78.10 9 185.00 8 185 9
M-of-N (1000,14) 230.26 6 162.50 6 79.4 6
Exactly (780,13) 230.00 11 215.00 11 230 11
Mushroom (3954,22) 86.20 8 64.10 8 67.2 8
Credit (876,20) 91.20 14 86.01 14 90.2 15
Vote (435,16) 37.93 12 21.25 11 26.9 12
C(A)Æ Nuñez’s measure, Cost (A)Æ aleatories values, W=0.1
Figure 1 Reduction of the dataset length by RSReduct
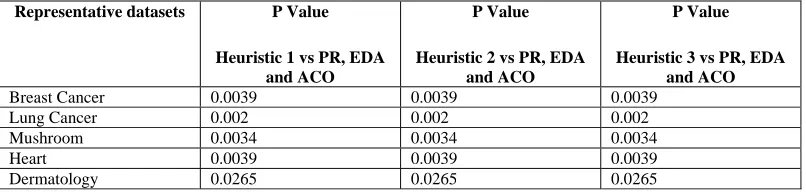
Attending to the size of the reduct obtained, we can conclude that the algorithm is very efficiently. To support this affirmation, experimental results obtained with RSReduct were compared statistically with other feature selection methods implemented with Pattern Recognition (PR) [Alv05], Estimation of Distribution Algorithms (EDA) (epigraph 2) and Ant Colony Optimization Algorithms (ACO) [Cab05]. The tables of the results of the comparison among these methods are omitted, only we will give the results of the statistical tests. In this chance, we used Kruskal-Wallis test, this is a non parametrical test based on rank sums that compares more than two related groups at time in order to discover differences among them. Table 2 shows the P Values obtained for Kruskal-Wallis test with respect to execution time of the algorithms, as can be seen; for all the cases the results were lower than 0.05 with a 95% of statistical significance, in other words, there are significant difference among those methods.
Table 3. P Values for Kruskal-Wallis test among the three heuristic functions of RSReduct and other feature selection methods.
Representative datasets P Value Heuristic 1 vs PR, EDA
and ACO
P Value Heuristic 2 vs PR, EDA
and ACO
P Value Heuristic 3 vs PR, EDA
and ACO
Breast Cancer 0.0039 0.0039 0.0039
Lung Cancer 0.002 0.002 0.002
Mushroom 0.0034 0.0034 0.0034
Heart 0.0039 0.0039 0.0039
Dermatology 0.0265 0.0265 0.0265
The conclusion for this analysis is that if a sufficiently good reduct related to length and class differentiation can be obtained in a lower time, then the new method RSReduct decreases the computational cost in classification problems.
3. Conclusions
In this paper, the problem of selecting features by using the reduct concept was studied by presenting two new methods for the selection of attributes one of them combines EDA algorithms with Wroblewski functions and experimental results show that they are very efficiently taking into account that they calculate exhaustively all the reduct for the dataset. The other method is based on heuristics that don’t guarantee to find better solution but an optimal one, a good reduct in this case. It was tested on several examples of training sets and experimental results show that this algorithm can build shorter reducts than others and also the computational time is decreased.
0 10 20 30 40 50 60
Ballon s-a Iris
Hay es-R
oth Bupa E-C
oli Hea
rt Pim
a
Breas t-C
ance r
Yea st
Der mat
olog y
Lung -Canc
er LED
M-o f-N
Exact ly
Mu shro
om Cred
it Vote
[image:6.612.106.509.448.545.2]References
[Alv05] Álvarez, D. Feature selection for data analysis using Rough Sets Theory. Thesis of Computer Science Engineering. Thesis Director: Yailé Caballero, M.Sc. University of Camagüey, Cuba. 2005.
[Ahn00] Ahn, B.S. et al.. The integrated methodology of rough set theory and artificial neural networks for business failure predictions. Expert Systems with Applications 18, 65-74. 2000.
[Bel98] Bell, D. and Guan, J. Computational methods for rough classification and discovery. Journal of ASIS 49, 5, pp. 403-414. 1998.
[Cab05] Caballero, Y. Using Rough Sets Theory to treatment of the data. Thesis of Master in Computer Science. Thesis Director: Rafael Bello, PhD. Universidad Central de Las Villas, Cuba. 2005.
[Car98] Carlin, U.S. et al.. Rough set analysis of medical datasets and A case of patient with suspected acute appendicitis. In ECAI 98 Workshop on Intelligent data analysis in medicine and pharmacology.
[Cho96] Choubey, S.K. et al. A comparison of feature selection algorithms in the context of rough classifiers. In Proceedings of Fifth IEEE International Conference on Fuzzy Systems, vol. 2, pp. 1122-1128. 1996.
[Cho99] Chouchoulas, A. and Shen, Q. A rough set-based approach to text classification. Lectures Notes in Artificial Intelligence no. 1711, pp. 118-127. 1999.
[Deo95] Deogun, J.S. et al. Exploiting upper approximations in the rough set methodology. In Proceedings of First International Conference on Knowledge Discovery and Data Mining, Fayyad, U. Y Uthurusamy, (Eds.), Canada, pp. 69-74. 1995.
[Deo98] Deogun, J.S. et al. Feature selection and effective classifiers. Journal of ASIS 49, 5, pp. 423-434. 1998.
[Dim66] Dimitriev, A. N.; Zhuravlev, J. I.; Krendeleiev, F. P. . About mathematical principles of objects and phenomenon classification. Diskretnyi Analiz No. 7, pp. 3-15, 1966.
[Gre01] Greco, S. Et al. Rough sets theory for multicriteria decision analysis. European Journal of Operational Research 129, pp. 1-47, 2001.
[Jen03] Jensen R. and Qiang, S. “Finding rough sets reducts with Ant colony optimization”. http://www.inf.ed.ac.uk/publications/online/0201.pdf 2003.
[Koc98] Koczkodaj, W.W. et al.. Myths about Rough Set Theory. Comm. of the ACM, vol. 41, no. 11, nov. 1998.
[Koh94] Kohavi, R. and Frasca, B. Useful feature subsets and Rough set Reducts. Proceedings of the Third International Workshop on Rough Sets and Soft Computing. 1994.
[Kom99a] Komorowski, J. Pawlak, Z. et al.. Rough Sets: A tutorial. In Pal, S.K. and Skowron, A. (Eds) Rough Fuzzy Hybridization: A new trend in decision-making. Springer, pp. 3-98. 1999.
[Kom99b] Komorowski, J. et al.. A Rough set perspective on Data and Knowledge. In The Handbook of Data mining and Knowledge discovery, Klosgen, W. and Zytkow, J. (Eds). Oxford University Press, 1999.
[Mau96] Maudal, O. Preprocessing data for neural network based classifiers: Rough sets vs Principal Component Analysis. Project report, Dept. of Artificial Intelligence, University of Edinburgh. 1996.
[Muh98] Mühlenbein H. The equation for the response to selection and its use for prediction. Evolutionary Computation 5(3), pp. 303-346, 1998.
[Muh99] Mühlenbein, H; Mahnig, T.; Ochoa, A. Schemata, distributions and graphical models on evolutionary optimization. Journal of Heuristics, 5(2), pp. 215-247. 1999.
[Ohr97] Ohrn, A. and Komorowski, J.. Rosetta: A rough set toolkit for analysis of data. In Proc. Third Int. Join Conference on Information Science, Durham, NC, USA, march 1-5, vol. 3, pp. 403-407. 1997.
[Pal99] Pal, S.K. and Skowron, A. (Eds).. Rough Fuzzy Hybridization: a new trend in decision-making. Springer-Verlag, 1999.
[Pal02] Pal, S.K. et al. Web mining in Soft Computing framework: Relevance, State of the art and Future Directions. IEEE Transactions on Neural Networks, 2002.
[Paw91] Pawlak, Z. Rough SetsTheoretical Aspects of Reasoning About Data. Kluwer Academic Publishing, Dordrecht, 1991. En: http://citeseer.ist.psu.edu/context/36378.html
[Paw94] Pawlak, Z. and Skowron, A. “Rough sets rudiments”. Bulletin of International Rough Set Society. Volume 3, Number 3. http://www.kuenstliche-intelligenz.de/archiv/2001_3/pawlak.pdf
[Paw95] Pawlak, Z. “Rough Sets, Rough Relations and Rough functions”. R. Yager, M.Fedrizzi, J. Keprzyk (eds.): Advances in the Dempster – Shafer Theory of Evidence, Wiley, New Cork, pp 251 – 271. 1995 http://citeseer.ist.psu.edu/105864.html
[Piñ03] Piñero, P; Arco, L; García, M. and Caballero, Y. Two New Metrics for Feature Selection in Pattern Recognition. Lectures Notes in computer Science (LNCS 2905), pp. 488-497. Springer, Verlag, Berlin Heidelberg. New York. ISSN 0302-9743. ISBN 3-540-20590-X.
[Pol02] Polkowski, L.. Rough sets: Mathematical foundations. Physica-Verlag, p. 574. Berlin, Germany. 2002.
[Pre98] Predki, B. et al.. ROSE- Software implementation of the Rough Set Theory. In Polkowski, L. and Skowron, A. (Eds) Rough Sets and Current Trends in Computing, Proceedings of the RSCTC98 Conference. Lectures Notes in Artificial Intelligence vol. 1424, Berlin pp. 605-608.
[Tay02] Tay, F.E. and Shen, L.. Economic and financial prediction using rough set model. European Journal of Operational Research 141, pp. 641-659. 2002.
[Wil98] Wilson, Randall. Martinez, Tony R. Reduction Techniques for Exemplar-Based Learning Algorithms. Machine Learning. Computer Science Department, Brigham Young University. USA 1998.
[Wro95] Wroblewski, J. Finding minimal reducts using genetic algorithms. In Wang, P.P. (Ed). Proceedings of the International Workshop on Rough Sets Soft Computing at Second Annual Joint Conference on Information Sciences, North Carolina, USA, p. 679, pp. 186-189. 1995.
[Wro96] Wroblewski, J. Theoretical foundations of order-based genetic algorithms. Fundamenta Informaticae, vol. 28 (3,4), pp. 423-430. IOS Press. 1996.
[Wro98] Wroblewski, J. Genetic algorithms in decomposition and classification problems. In Polkowski, L. and Skowron, A. (Eds.). Rough sets in Knowledge Discovery 1: Applications, Case Studies and Software Systems. Physica-Verlag, pp. 472-492. 1998.