1
In vivo Ca
2+imaging in the endoplasmic reticulum with an optimized
GFP-aequorin sensor
Abbreviated Title: Ca2+ imaging of endoplasmic reticulum in vivo
Paloma Navas-Navarroa,1, Jonathan Rojo-Ruiza,1, Macarena Rodriguez-Pradosa, María Dolores Ganforninaa, Loren L. Loogerb, María Teresa Alonsoa,2 and Javier García-Sanchoa,2
aInstituto de Biología y Genética Molecular (IBGM), University of Valladolid and
CSIC, Valladolid, Spain.
bHoward Hughes Medical Institute, Janelia Research Campus, Ashburn, Virginia,
USA.
1These authors contributed equally to this work.
2To whom correspondence may be addressed. Email: [email protected] or
Corresponding author: María Teresa Alonso ( [email protected]) or Javier
Garcia-Sancho ([email protected]). Instituto de Biología y Genética Molecular (IBGM).
Universidad de Valladolid y Consejo Superior de Investigaciones Científicas. c/ Sanz y
Forés 3. 47003 Valladolid, Spain.
Abbreviations: GAP, GFP-Aequorin Protein; ER, endoplasmic reticulum; SR,
sarcoplasmic reticulum; SERCA, sarco-endoplasmic reticulum Ca2+ ATPase; TBH, tert-butyl-hidroquinone; GECI, genetically encoded calcium indicator; GFP, green fluorescent
protein; [Ca2+]
C, [Ca2+]ER, [Ca2+]SR, [Ca2+]GO, Ca2+ concentrations in cytosol, ER, SR or
ABSTRACT
Proper functioning of organelles such as the endoplasmic reticulum (ER) or the Golgi
apparatus requires luminal accumulation of Ca2+ at high concentrations. Genetically encoded Ca2+ indicators are invaluable tools for monitoring intra-organellar Ca2+
signals in vitro, but the presently available sensors have proven to be of limited value
for in vivo use. Here we describe a low affinity Ca2+ sensor of the GFP-Aequorin
Protein (GAP) family optimized for measurements in high Ca2+ concentration
environments. This indicator is ratiometric, insensitive to Mg2+ and to pH, and easy to calibrate. It can be used in combination with other indicators for simultaneous
imaging of ER and cytosolic Ca2+. We generated transgenic animal models (flies and mice) for the improved GAPs targeted to the ER, where functional Ca2+ transients
could readily be detected. The utility of the ER sensor was demonstrated under three
experimental paradigms: i) ER Ca2+ oscillations in cultured astrocytes, ii) ex vivo
functional mapping of ER cholinergic receptors in acute hippocampal slices from
transgenic mice, and iii) in vivo sarcoplasmic reticulum Ca2+ dynamics in the muscle
of transgenic flies. Our results provide proof of concept for the suitability of the new
biosensors to monitor Ca2+ dynamics inside intracellular organelles under
physiological conditions and open an avenue to explore complex Ca2+ signalling in animal models of health and disease.
Keywords: biosensor, calcium, organelles, GFP, aequorin, GECI, endoplasmic reticulum,
Intracellular organelles such as the endoplasmic reticulum (ER) or the Golgi
apparatus require luminal accumulation of Ca2+ at high concentrations for proper functioning. Direct intra-organellar measurement of Ca2+ concentrations in intact preparations is essential to address complex physiological questions. Few genetically
encoded Ca2+ indicators have been developed for high-Ca2+ organelles, and none of these have been used in vivo in the context of transgenic expression. We describe a
new Ca2+ sensor of the GFP-Aequorin Protein (GAP) family designed to accurately
monitor Ca2+ concentration in high-Ca2+ environments. Expression of the sensor in the endoplasmic reticulum in neurons and muscle of transgenic animal models (flies
and mice) enabled to monitor fast physiological responses under minimally disturbing
conditions ex vivo and in vivo. This sensor provides a valuable tool to explore
subcellular complex Ca2+ signalling
INTRODUCTION
Maintenance of high [Ca2+] in the lumen of Ca2+ storage organelles, such as the
endoplasmic reticulum (ER) or the Golgi apparatus (Go), is crucial for their correct
functioning. Chronic decrease of [Ca2+]ER triggers ER stress and the “unfolded protein
response” (Gallego-Sandin, et al., 2011), whereas reduction of [Ca2+]
GO disturbs
segregation and cargo sorting (Kienzle and von Blume, 2014). Direct and calibrated
measurements of intraluminal Ca2+ levels are imperative to understand Ca2+
responses underlying different physiological and pathophysiological conditions. In the
past decade an increasing number of genetically encoded Ca2+ indicators (GECIs) have been developed. Most of them have been engineered to have high Ca2+ affinity
and only a few for use in high [Ca2+] environments (Henderson, et al., 2015; Palmer and Tsien, 2006; Suzuki, et al., 2014; Tang, et al., 2011; Wu, et al., 2014). Although
some indicators have been expressed in transgenic animals, its utility has proven
problematic, displaying small responses, probably due to the interaction of the sensor
with endogenous partners. Furthermore, to date there are no reports on the in vivo
use of transgenic low-Ca2+ affinity indicators.
We have recently described a new family of fluorescent Ca2+ sensors named GAP
(for GFP-Aequorin Protein) (Rodriguez-Garcia, et al., 2014). A unique feature of this
family is the use of aequorin instead of calmodulin or troponin-C to provide the Ca2+
binding sites. This makes much less likely the association of the indicator with
endogenous proteins (“bio-orthogonality”), thus avoiding possible interferences.
Other advantages of the GAP sensors include its ratiometric capability and its
Ca2+ subcompartment of the Golgi apparatus (Aulestia, et al., 2015), but still far
below the resting [Ca2+]GO in the high-Ca2+ subcomparment or the [Ca2+]ER, that are
in the range of 250 to 600 µM (Alonso, et al., 1998; Aulestia, et al., 2015).
Here we report the development of new low affinity Ca2+ sensors (GAP2 and GAP3) optimized for imaging Ca2+ dynamics in vivo in high Ca2+ organelles. We demonstrate their use for [Ca2+]
ER monitoring under various experimental settings, including
ER-Ca2+ oscillations in cultured astrocytes; ER-Ca2+ release by acetylcholine hippocampal slices ex vivo; and muscle of transgenic flies in vivo. .
RESULTS AND DISCUSSION
Optimization of GAP for measuring in high [Ca2+]environments
Because of its relatively high affinity for Ca2+, the previously described ER-targeted GAP1 (erGAP1) only poorly detected small changes of [Ca2+]ER, although it was
valuable for measurements of large variations in luminal Ca2+ (Fig. 1a). We therefore introduced new substitutions in the EF hands of aequorin to further decrease GAP
affinity for Ca2+. Of the 22 mutants tested (Table S1) the double mutant D24N/D119A
(named GAP2) displayed a Kd of 407 µM (Fig. 1b), well suited for measuring [Ca2+]ER.
As a consequence, the sensitivity of the improved ER-targeted GAP2 (erGAP2) to
detect submaximal ER calcium releases was greatly increased with respect to
erGAP1 (Fig. 1a).
Further optimization of the indicator included humanization of GAP2 codon usage to
moiety to increase its fluorescence intensity (Table S2). The brightest functional
variant (named GAP3) contained the substitutions S175G, D180Y, I167V and L15Q
and exhibited a Kd of 489 µM. Importantly, the dynamic range (~3-fold) was not
substantially altered with respect to the parental GAP1. Both GAP2 and GAP3
behaved very similarly and were used interchangeably in the following experiments.
Remarkably, these sensors possess a Hill coefficient (n) of 1.0 (Fig. 1b); it is likely
that two out of the three Ca2+-binding sites in aequorin have been rendered non-functional in GAP, while preserving the fluorescence signalling mechanism. Sensors
with higher Hill coefficients are more difficult to calibrate (Suzuki, et al., 2014).
Furthermore, GAP is practically insensitive to variations in Mg2+ concentration (in the
0.1 to 5 mM range; Fig. S1a) or pH (in the 6.5 to 8.5 pH range; Fig. S1b). At lower pH
values the apparent affinity for Ca2+ decreased (the Kd increased 2.4 times at pH 6
and 40 times at pH 5.5; Fig. S1b).
Accurate measurement of luminal [Ca2+] requires satisfaction of several criteria: high
signal-to-noise ratio, large dynamic range with a midpoint close to resting [Ca2+], and reliable in situ calibration. We targeted GAP3 to the ER (erGAP3); erGAP3 was bright
and co-localized with ER markers. Cell stimulation with ATP produced large,
coordinated changes in the fluorescences excited at 405 and 470 nm (Fig. 1c).
Complete emptying of the ER resulted in Fmin, that was obtained by stimulation in
Ca2+-free medium containing the reversible sarco-endoplasmic reticulum Ca2+ ATPase (SERCA) inhibitor tert-butylhydroquinone (Moore, et al., 1990) (TBH, Fig.
1c). Similar results were obtained with the irreversible SERCA blocker thapsigargin
(Thastrup, et al., 1989), although in this case ER stores did not refill after inhibitor
(Fig. 1d, shown together with the erGAP3 R/R0 ratio values). Interestingly,
comparison of Ca2+ kinetics in the two compartments revealed that the cytosolic Ca2+ peak preceded the ER Ca2+ decrease peak (Fig.1d). erGAP3 was also calibrated against Fura-2 (Fig. S2b) with similar results. These findings indicate that [Ca2+]
C
changes only crudely correlate with [Ca2+]ER changes and direct ER measurements
are required for precise description of Ca2+ kinetics in this compartment.
Oscillations of [Ca2+]ER in cultured cortical astrocytes
We next applied the new sensors to explore various aspects of ER Ca2+ dynamics
under three experimental paradigms. In the first setting we expressed the
ER-targeted sensor in cortical astrocytes by infecting primary cultures with an erGAP2
Herpes viral vector (Fig. 2). The indicator successfully reported[Ca2+]
ERdynamics
and was sensitive enough to follow Ca2+ oscillations inside the ER. Stimulation with ATP, which induces Ca2+ release from the ER via inositol trisphosphate (Verkhratsky,
et al., 2012), reduced the GAP fluorescence (R/R0) by about 50% (Fig. 2a). In these
cells, low extracellular [K+] induces Ca2+ entry and triggers oscillations of the cytosolic Ca2+ (Dallwig, et al., 2000). We demonstrate here that the cytosolic oscillations are
due to large [Ca2+]ER oscillations that could be directly recorded with erGAP2 (video
1). The entry of Ca2+ across the plasma membrane would firstly trigger a Ca2+
release from the ER via activation of the ryanodine receptor (RyR) through a process
of Ca2+-induced Ca2+-release (CICR) (Alonso, et al., 1999). The luminal depletion will then desensitize the RyR and promote the gradual Ca2+ loading of the ER. As soon
membrane will operate as long as the Ca2+ flowing into the cell is guaranteed by the continuous low extracellular [K+] stimulation.
Additionally, detailed analysis of the probe signal enabled us to investigate how
[Ca2+]
ER oscillations are propagated from cell to cell. The lower panel in Fig. 2a
shows details of the cell to cell progression. It seems clear that cell excitation,
understood here as the progression of the Ca2+ release from the ER, was able to jump from one cell to its neighbour (arrowheads in Fig. 2a). The main wave was
visible in the average trace of all the cells present in the field (n=7; Fig. 2b), indicating
some degree of synchronization.
Functional mapping of ER Ca2+responses to neurotransmitters in hippocampal slices ex vivo
We next generated lines of transgenic mice expressing erGAPs (2 and 3) under the
ubiquitous CAG-GS promoter (Fig. S3a). Hippocampus showed strong expression of
the sensors (Fig. S3b). We looked for functional responses to neurotransmitters in
the different areas of the hippocampus examined at low magnification using acute
slices from erGAP3 transgenic mice. ER- and cytosolic-Ca2+ dynamics were
simultaneously monitored using erGAP3 and Rhod-3, respectively (Fig. 3). ER Ca2+ release in response to acetylcholine selectively occurred in the CA1 region (Fig. 3a).
These results correlate well with the expression of the muscarinic acetylcholine
receptors (Fernandez de Sevilla, et al., 2008; Power and Sah, 2002). Interestingly, a
detailed comparison between [Ca2+]
C and [Ca2+]ER kinetics (Fig. 3b) showed that
maximal [Ca2+]C rise preceded maximal ER release, in agreement with the results
In vivo monitoring of Ca2+ release in the sarcoplasmic reticulum of fly muscle
To demonstrate the feasibility of in vivo measurements with the new ER Ca2+
sensors, we genetically engineered Drosophila to express erGAP3 specifically in the
sarcoplasmic reticulum (SR) of striated muscles (Fig. 4a and 4b). We investigated SR
Ca2+ dynamics in the living fly by imaging GAP fluorescence in the thorax muscles during electrical stimulation of the giant fiber, a useful model system for studies of
muscle function during nerve stimulation that permits simultaneous activation of all
the motor nerves (Allen and Godenschwege, 2010). At low frequency (0.25-0.5 Hz),
erGAP3 readily detected individual SR release events secondary to nerve stimuli,
with small and repetitive decreases in F470 and concomitant rises in F405 (Fig. 4c). SR
Ca2+ release was completed in less than 100 ms and was followed by a slower Ca2+ reuptake (T1/2 , 0.5 - 1 s) (Figs. 4c and S4a). At high frequency stimulation (4-16 Hz),
individual SR-release events fused and summated during the first 1.5 s, resulting in a
much larger release (Fig. 4d, S4b and S4c). We also generated transgenic flies
expressing GCaMP3 in muscle to image cytosolic Ca2+ in parallel experiments. The decreases in [Ca2+]SR, imaged with erGAP3, correlated well with the large increases
in [Ca2+]
C, imaged with GCaMP3 (Fig. 4e). Taken together, these results demonstrate
that the new sensor erGAPs enable to monitor SR-Ca2+ release dynamics in response to physiological stimulation with a high temporal resolution in vivo.
In summary, the optimized Ca2+ sensors represent a substantial improvement over previous GAPs due to its optimal Kd for measurements in high [Ca2+]compartments,
its ratiometric measurements, large dynamic range and uncomplicated calibration
which facilitates robust functional expression of the indicator with no apparent
off-target effects. Finally, we demonstrate the applicability of the sensor, both ex vivo
and in vivo, to address different aspects of subcellular Ca2+ homeostasis. Its use in
combination with new disease models, such as those provided by iPS cell technology
(Fernandez-Santiago and Ezquerra, 2016; Wan, et al., 2015), promises novel
approaches to investigate the pathophysiological relevance of organellar Ca2+ dyshomeostasis.
MATERIALS AND METHODS
Gene construction
The original GAP containing the D119A substitution in aequorin (Rodriguez-Garcia, et al.,
2014) was cloned in pcDNA3. The initial GAP gene library was constructed by
site-directed mutagenesis (QuickChange Site-site-directed mutagenesis kit, Stratagene) using the
oligonucleotides No. 1 to 22 listed in Table S3. Genes encoding GAP variants were
sub-cloned into pET28a for expression, purification and screening in E. coli. The secondary
GAP library (Table S2) was created using erGAP2 cloned in pcDNA3 as a template and
oligonucleotides No. 23 to 29 of Table S3.
To target GAP2 or GAP3 to the ER (erGAP), the calreticulin signal peptide and the
sequence encoding the ER-retention tag, KDEL, were fused in frame to the 5’- and the
3’-end, respectively, resulting in pcDNA3-erGAP2 and pcDNA3-erGAP3. To produce viral
vectors, erGAP2 cDNA was cleaved from pcDNA3 as a HindIII/EcoRI fragment and
In order to improve gene expression in mouse, sequence optimization of the erGAP2
gene was performed (ATG:biosynthetics GmbH, Germany). To make transgenic mice,
mammalian codon usage-optimized erGAP2 and erGAP3 were sub-cloned into the
pCAG-GS vector with a CAG promoter (Miyazaki, et al., 1989) (CMV enhancer, β-actin
promoter) and regulatory elements from the woodchuck hepatitis virus (WPRE; Fig. S3a).
To make transgenic flies, erGAP3 was cloned into pUASt-attB vector (GenBank accesion
No. EF362409). The integrity of all constructs was verified by sequencing.
Bacterial expression and protein purification
GAP variants in pET28a were transformed in E. coli BL21 (Stratagene). For protein
expression, bacteria were grown at 37º C to A600 >0.6 in LB containing 40 mg/l kanamycin
and induced with 0.5 mM isopropyl β-D-thiogalactoside (IPTG) for 6h at 25º. The cells
were then pelleted by centrifugation at 6000 g for 10 min, and sonicated in a buffer
containing (in mM): NaCl, 250; EDTA, 5; phenylmethylsulfonyl fluoride, 0.5; DTT (reducing
agent), 2; Tris-HCl, 50, pH 8.8. The bacterial lysate was centrifuged at 30,000 g for 10
min. Most of the protein was present in inclusion bodies as an insoluble material that
could be solubilized in 8 M urea, 5 mM DTT, 50 mM Tris-HCl, pH 8.8, by rocking at 4º
overnight. The insoluble protein was removed by centrifugation at 30,000 g for 15 min. For
small-scale cultures used for screening, protein in supernatant was refolded by filtration
with 150 mM NaCl, 5 mM DTT, 50 mM Tris–HCl (pH 8.8) at 4º using a 10K filter (Amicon)
in such a way that urea was 125-fold diluted. For Ca2+ titration of GAP2 or GAP3, urea was dialyzed against 50 mM Tris-HCl (pH 8.8) at 4º. Next, 5 mM DTT was added and
proteins were further purified with Ni-Sepharose beads (GE Healthcare). Protein
GAP screening
Mutant screening (Table S1) was performed using a Tecan Genios Pro 96-well plate
reader. GAP recombinant proteins (3 µg) were added to each well containing 200 µl of
PBS, pH 7.4 at three different Ca2+ concentrations: 0 (0.1 mM EGTA added), 0.1 mM and
1 mM. GAP fluorescence was measured in triplicate at 390 and 485 nm excitation and
535 nm emission. These values were used to calculate the F485/F390 ratio (which was
similar to F470/F405 ratio). Ratio values obtained with Ca2+ (0.1 and 1 mM Ca2+) were
divided by the ones obtained with EGTA (RCa/REGTA) and, finally, the values obtained with
1 mM Ca2+ were divided by the ones obtained with 0.1 mM Ca2+. Only those GAP mutants
that gave RCa1/RCa0.1 values larger than 1.5 were pursued. The secondary screening of
GAP2 mutants was performed in transiently transfected HeLa cells.
Calibration with Ca2+ and interactions with H+ and Mg2+
Measurements were performed in the plate reader (see above). Recombinant GAP
proteins (3 µg) were added to each well with 200 µl of a buffer containing (in mM): KCl,
140; MgCl2, 1; MOPS/Tris, 20, pH 7.2. Ca2+ calibrations were performed in Ca2+-free
medium (0.1 mM EGTA added), or in the same solutions containing increasing Ca2+
concentrations between 50 µM and 50 mM. Rmax and Rmin were computed as the F485/F390
ratios at saturating [Ca2+] and at zero [Ca2+], respectively. The Ca2+ titration values fitted
the Hill equation, y=(ymax · [Ca2+]n) / (Kn + [Ca2+]n), where y is (R-Rmin) / (Rmax-Rmin), K is
the dissociation constant, Kd, and n is the Hill coefficient. The effects of pH were
monitored with GAP2 using different buffers for each pH range: histidine for pH 5.5 to 6.5,
Cell culture and expression in mammalian cells
HeLa cells were maintained in Dulbecco's Modified Eagle Medium (DMEM) (Invitrogen)
supplemented with 10% fetal bovine serum, 2 mM L-glutamine, 100 μg/ml streptomycin
and 100 U/ml penicillin. Stable HeLa clones expressing erGAP2 or erGAP3 were obtained
by lipofectamine transfection followed by G-418 selection. The population of GFP positive
cells was enriched by cell sorting. Single-cell clones were selected in culture medium
containing 0.8 mg/ml G-418 by limited dilution and maintained in 0.1 mg/ml G-418. For
imaging experiments, 5 x 10⁴ cells were seeded on poly-L-lysine coated 12 mm-diameter coverslips.
Cortical astrocyte cultures
Brain cortices were dissected from three P2-3 C57BL/6JCrl (Charles Rivers) mice in cold
HBSS and digested with 0.5 mg/ml papain and 0.04 mg/ml DNase dissolved in a Ca2+- and Mg2+-free HBSS with 10 mM glucose and 0.1% bovine serum albumin (BSA) at 37ºC
for 20 min. The cells were resuspended with Minimal Essential Medium (MEM)
supplemented with 2 mM glutamax, 27 mM glucose, 100 µg/ml streptomycin, 100 U/ml
penicillin and 10% (v/v) horse serum, and plated on a poly-L-lysine coated 75 cm2 flask.
After 2 and 7 days flasks were slapped to remove neurons and other loosely attached
cells such as microglia and oligodendrocytes. After one week, cells were trypsinized and
seeded in the same medium onto poly-L-lysine coated 12 mm-diameter glass coverslips
at a density of 2.5 x 10⁴ cells/coverslip. The cultures were used within 1-2 weeks.
Packaging and titration of Herpes Simplex Virus 1 (HSV1) vectors were performed as
reported earlier (Alonso, et al., 1998). Astrocyte cultures were infected with a multiplicity
of infection (moi) ranging between 0.01 and 0.1 one day before use.
Ca2+ imaging
HeLa cell imaging was performed in a Nikon Diaphot inverted microscope using a
20x PlanApoUV objective (NA =0.7, Olympus) as described previously (Villalobos, et
al., 1997). Briefly, standard medium containing 145 mM NaCl, 5 mM KCl, 1 mM
CaCl2, 1 mM MgCl2, 10 mM glucose, 10 mM Na–HEPES, pH 7.4, were applied at
22-25ºC by perfusion at 5-6 ml/min. GAP was excited using the two filters, 403/12 DF
and 470/25 DF, and a DM500 dichroic mirror. Cells were alternately epi-illuminated at
403 and 470 nm and light emitted above 520 nm was recorded using a Hamamatsu
C4742-98 camera handled by the Simple PCI 6.6 Hamamatsu software. For
simultaneous recording of [Ca2+]ER and [Ca2+]C, erGAP-expressing cells were
incubated for 60 min with rhod-3 AM (2 µM, Molecular Probes) at 22 ºC (Fig. 1d).
Cells were imaged in a Zeiss axioplan upright microscope equipped with a 20x
objective (W-Achroplan, Zeiss; NA= 0.5), sequentially excited at 405, 470 and 540
nm, and fluorescence was read at >515 (535DF35) nm and >590 (LP590) nm.
Output images were background-subtracted and ratioed pixel-to-pixel using ImageJ
software. The ratio F470/F403 was used as an index of [Ca2+]ER and F540, generally
expressed as F/F0, as an index of [Ca2+]C. F0 was the average of the fluorescence
values obtained during the first 5-10 frames. [Ca2+]C was also measured using fura-2
(Fig. S2b) as described previously (Rodriguez-Garcia, et al., 2014). Astrocyte
The 5 kb transgene (Fig. S3a) containing either the erGAP2 or the erGAP3 gene was
injected into C57BL/6JCrl (Charles Rivers) or B6CBAF2/OlaHsd (Harlan) oocytes,
respectively, using standard techniques. Genotyping was routinely performed by PCR of
genomic DNA obtained from tail biopsies using 4 oligonucleotides No. 30 and 31 of Table
S3 for GAP (234 bp product), together with No. 32 and 33 for endogenous glyceraldehyde
3-phosphate dehydrogenase (GAPDH), a housekeeping gene (350 bp product).
Experiments shown here were performed with mice of line 3 for erGAP2 and lines 1 and
10 for erGAP3. Experiments conformed to the institutional and national regulatory
standards concerning animal welfare.
Calcium imaging in brain slices
Acute hippocampal slices were prepared from mice (P7-P15) from transgenic lines
erGAP2 (L3) or erGAP3 (L1 or L10). The hippocampus was dissected out along with the
cortex and sliced into 350-400µm thick sections with a Mcllwain Tissue Chopper. Slices
were quickly transferred to a fine-meshed membrane filter and maintained in artificial
cerebrospinal fluid (ACSF) containing: 125 mM NaCl, 2.5 mM KCl, 1 mM MgCl2, 26 mM
NaHCO3, 1 mM CaCl2, 10 mM glucose, 1.25 mM NaH2PO4, pH7.4, continuously bubbled
with a 95% O2 / 5% CO2 gas mixture at 25ºC. Slices were mounted onto the stage of a
Zeiss Axioplan upright microscope equipped with a 5x objective (Plan-Neofluar, Zeiss;
NA= 0.15) and a Zeiss AxioCam camera MRm (12 bit) connected through a software
interface (Axiovision, Zeiss) to a Xenon fluorescent excitation source and a filter wheel.
GAPs were excited at 405 and 470 nm and acquired at 518-553 nm, as described above.
For simultaneous measuring of [Ca2+]ER and [Ca2+]C, slices were incubated for 1 h at room
described above for HeLa cells. All the experiments were performed at 22-25ºC in a
custom-made chamber of 42 µl volume under constant perfusion at 3 ml/min.
Generation of transgenic flies
PhiC31 system-mediated (Bischof, et al., 2007) transformation of Drosophila melanogaster strain “y1 M{vas-int.Dm}ZH-2A w*; M{3xP3-RFP.attP} ZH-86Fb”
(BL24749) was used. pUASTattB-erGAP3 was injected into embryos and stable lines
with the transgene incorporated into an attP86 site on the third chromosome were
selected (BestGene Inc, USA). We used the Gal4-UAS system (Brand and Perrimon,
1993) to express erGAP3 in muscle cells. UAS-erGAP3 or UAS-GCaMP3 flies (Tian,
et al., 2009) were crossed with myosin heavy chain (Mhc)-Gal4 flies (Schuster, et al.,
1996).
Calcium imaging in flies
Adult Drosophila were anesthetized with CO2, tethered ventrally with a small drop of agar
and then gently transferred to the microscope stage. Recordings of the dorsal longitudinal
muscles (DLM) in the fly thorax were obtained by stimulation of the giant fiber system
through two tungsten electrodes impaled into the fly eyes (Allen and Godenschwege,
2010). The stimulation protocol consisted of voltage stimuli of 5-10 V and 30-50 ms
duration at different frequencies (0.25 to 16 Hz). Each experiment started with a visual
check of twitches in the wing after stimulation. Fluorescence images were acquired with a
Leica MZ16FA Fluorescence Stereo Microscope equipped with a Plan Apo 1.0x objective
(N.A., 0.14) and a 100W mercury lamp, using either 470/40 nm or 405/40 excitation filters
and a 525/50 nm emission filter. Images were acquired at 12 bits with binning of 2x2 or
Statistical analysis
Results are expressed as mean ± SD or mean±SEM, as indicated. The statistical
significance was evaluated using Student’s t-test or one-way ANOVA with GraphPad
ACKNOWLEDGMENTS
We thank M. García Cubillas for technical assistance; I. López , Y. Gaciño and F.
Martínez for assistance with mice; A. Martín for assistance in cell sorting; J.
Fernández, C. Lázaro and R. Pascua-Maestro for help with flies; and M. Torres and
L.M. Criado for mouse microinjections. We thank A. Ferrús (Instituto Cajal, Madrid,
Spain) for providing Mhc-Gal4 flies. Preliminary recordings in Drosophila were
performed by the medical student J. González Zamora. This work was supported by
grants from the Spanish Ministerio de Economia y Competitividad
(BFU2014-53469P), and the Instituto de Salud Carlos III (TerCel; RD12/0019/0036)
AUTHOR CONTRIBUTIONS
J.G.-S. and M.T.A. conceived and designed the study. M.T.A. was responsible for
molecular biology designs. L.L.L. helped with the design of the low affinity mutations
for Ca2+. M.D.G. helped with the design and execution of the experiments in flies.
P.N.-N- and J.R.-R. and M.R.-P. performed the experiments and analyzed the data.
J.G.-S- and M.T.A. wrote the manuscript. J.G.-S. supervised the whole study. All
authors discussed the conceptual and practical implications of the results.
COMPETING FINANCIAL INTERESTS
1. Alonso, M.T., Barrero, M.J., Carnicero, E., Montero, M., Garcia-Sancho, J., and Alvarez,
J. (1998). Functional measurements of [Ca2+] in the endoplasmic reticulum using a
herpes virus to deliver targeted aequorin. Cell Calcium 24, 87-96.
2. Alonso, M.T., Barrero, M.J., Michelena, P., Carnicero, E., Cuchillo, I., Garcia, A.G.,
Garcia-Sancho, J., Montero, M., and Alvarez, J. (1999). Ca2+-induced Ca2+ release in
chromaffin cells seen from inside the ER with targeted aequorin. J Cell Biol 144, 241-254.
3. Allen, M.J., and Godenschwege, T.A. (2010). Electrophysiological recordings from the
Drosophila giant fiber system (GFS). Cold Spring Harb Protoc 2010, pdb prot5453.
4. Aulestia, F.J., Alonso, M.T., and Garcia-Sancho, J. (2015). Differential calcium handling
by the cis and trans regions of the Golgi apparatus. Biochem J 466, 455-465.
5. Bischof, J., Maeda, R.K., Hediger, M., Karch, F., and Basler, K. (2007). An optimized
transgenesis system for Drosophila using germ-line-specific phiC31 integrases. Proc Natl
Acad Sci U S A 104, 3312-3317.
6. Brand, A.H., and Perrimon, N. (1993). Targeted gene expression as a means of altering
cell fates and generating dominant phenotypes. Development 118, 401-415.
7. Dallwig, R., Vitten, H., and Deitmer, J.W. (2000). A novel barium-sensitive calcium influx
into rat astrocytes at low external potassium. Cell Calcium 28, 247-259.
8. Fernandez-Santiago, R., and Ezquerra, M. (2016). Epigenetic Research of
Neurodegenerative Disorders Using Patient iPSC-Based Models. Stem Cells Int 2016,
9464591.
9. Fernandez de Sevilla, D., Nunez, A., Borde, M., Malinow, R., and Buno, W. (2008).
Cholinergic-mediated IP3-receptor activation induces long-lasting synaptic enhancement
in CA1 pyramidal neurons. J Neurosci 28, 1469-1478.
10. Gallego-Sandin, S., Alonso, M.T., and Garcia-Sancho, J. (2011). Calcium homoeostasis
modulator 1 (CALHM1) reduces the calcium content of the endoplasmic reticulum (ER)
11. Henderson, M.J., Baldwin, H.A., Werley, C.A., Boccardo, S., Whitaker, L.R., Yan, X., Holt,
G.T., Schreiter, E.R., Looger, L.L., Cohen, A.E., et al. (2015). A Low Affinity GCaMP3
Variant (GCaMPer) for Imaging the Endoplasmic Reticulum Calcium Store. PLoS One 10,
e0139273.
12. Kienzle, C., and von Blume, J. (2014). Secretory cargo sorting at the trans-Golgi network.
Trends Cell Biol 24, 584-593.
13. Miyazaki, J., Takaki, S., Araki, K., Tashiro, F., Tominaga, A., Takatsu, K., and Yamamura,
K. (1989). Expression vector system based on the chicken beta-actin promoter directs
efficient production of interleukin-5. Gene 79, 269-277.
14. Moore, G.A., Kass, G.E., Duddy, S.K., Farrell, G.C., Llopis, J., and Orrenius, S. (1990).
2,5-Di(tert-butyl)-1,4-benzohydroquinone--a novel mobilizer of the inositol
1,4,5-trisphosphate-sensitive Ca2+ pool. Free Radic Res Commun 8, 337-345.
15. Palmer, A.E., and Tsien, R.Y. (2006). Measuring calcium signaling using genetically
targetable fluorescent indicators. Nat Protoc 1, 1057-1065.
16. Power, J.M., and Sah, P. (2002). Nuclear calcium signaling evoked by cholinergic
stimulation in hippocampal CA1 pyramidal neurons. J Neurosci 22, 3454-3462.
17. Rodriguez-Garcia, A., Rojo-Ruiz, J., Navas-Navarro, P., Aulestia, F.J., Gallego-Sandin,
S., Garcia-Sancho, J., and Alonso, M.T. (2014). GAP, an aequorin-based fluorescent
indicator for imaging Ca2+ in organelles. Proc Natl Acad Sci U S A 111, 2584-2589.
18. Schuster, C.M., Davis, G.W., Fetter, R.D., and Goodman, C.S. (1996). Genetic dissection
of structural and functional components of synaptic plasticity. I. Fasciclin II controls
synaptic stabilization and growth. Neuron 17, 641-654.
19. Suzuki, J., Kanemaru, K., Ishii, K., Ohkura, M., Okubo, Y., and Iino, M. (2014). Imaging
intraorganellar Ca2+ at subcellular resolution using CEPIA. Nat Commun 5, 4153.
20. Tang, S., Wong, H.C., Wang, Z.M., Huang, Y., Zou, J., Zhuo, Y., Pennati, A., Gadda, G.,
Delbono, O., and Yang, J.J. (2011). Design and application of a class of sensors to
monitor Ca2+ dynamics in high Ca2+ concentration cellular compartments. Proc Natl
P.J., Christensen, S.B., and Hanley, M.R. (1989). Thapsigargin, a novel molecular probe
for studying intracellular calcium release and storage. Agents Actions 27, 17-23.
22. Tian, L., Hires, S.A., Mao, T., Huber, D., Chiappe, M.E., Chalasani, S.H., Petreanu, L.,
Akerboom, J., McKinney, S.A., Schreiter, E.R., et al. (2009). Imaging neural activity in
worms, flies and mice with improved GCaMP calcium indicators. Nat Methods 6, 875-881.
23. Verkhratsky, A., Rodriguez, J.J., and Parpura, V. (2012). Calcium signalling in astroglia.
Mol Cell Endocrinol 353, 45-56.
24. Villalobos, C., Nunez, L., Frawley, L.S., Garcia-Sancho, J., and Sanchez, A. (1997).
Multi-responsiveness of single anterior pituitary cells to hypothalamic-releasing hormones: a
cellular basis for paradoxical secretion. Proc Natl Acad Sci U S A 94, 14132-14137.
25. Wan, W., Cao, L., Kalionis, B., Xia, S., and Tai, X. (2015). Applications of Induced
Pluripotent Stem Cells in Studying the Neurodegenerative Diseases. Stem Cells Int 2015,
382530.
26. Wu, J., Prole, D.L., Shen, Y., Lin, Z., Gnanasekaran, A., Liu, Y., Chen, L., Zhou, H., Chen,
S.R., Usachev, Y.M., et al. (2014). Red fluorescent genetically encoded Ca2+ indicators
FIGURE LEGENDS
Figure 1. Characterization of the new GAP sensors.(a) ER Ca2+ emptying
monitored with erGAP in HeLa cells. Comparison of the GAP1 and GAP2
submaximal responses to stimulation with ATP + carbachol (labelled as ATP; 100 µM
each) followed by full ER emptying by stimulation with the same stimuli applied in
Ca2+-free medium containing 10 µM of the SERCA inhibitor TBH. Traces are the average of 14 (GAP1) or 20 (GAP2) cells. Experiments were performed in cell lines
stably expressing erGAP1 or erGAP2. (b) Purified-protein Ca2+ titrations of GAP2
and GAP3; curves fit with Hill equation y = (ymax · [Ca2+]n) / (Kdn + [Ca2+]n), yielding
(mean±SEM; n=3): GAP2 Kd = 407 ± 37 and n=1.0 ± 0.1; GAP3, Kd =489 ± 43 µM
and n =0.9 ± 0.1. For more details see Fig. S1. (c) Response of erGAP3-expressing
HeLa cells to repeated stimulation with ATP + carbachol (details as in a) followed by
response in Ca2+-free medium containing 10 µM TBH; CAF stands for 50 mM
caffeine. Trace is the average of 34 cells. Note the reciprocal changes of the
individual fluorescence channels, F470 and F405. (d) F470/F405 ratio (R) normalized
to R0 (R/R0) was shown alongside simultaneous measurement of cytosolic Ca2+ with
Rhod-3 (F/F0).
Figure 2. Use of erGAP for monitoring ER-Ca2+ oscillations in cultured astrocytes. (a) Oscillations of [Ca2+]ER induced by low K+ (0.2 mM) in erGAP2–
expressing astrocytes. The upper row shows a gray-scale GAP fluorescence image
in which 4 nuclei (n1-n4) can be seen. Next to it, the contours of the four cells and
the pseudocolored ratio image at baseline (REST) and at maximum response with
ATP (+ATP; 100 µM) are shown. The pseudocolor scale and the trace of cell 2 are
Note that the [Ca2+]ER drop starts in cell 1 (frame 1; start at the arrowhead),
progresses towards cell 2 (frame 2; arrowhead), invades it (frames 3 and 4) and,
finally reaches cell 3 (frames 5 and 6). At frame 7, refilling of the ER calcium stores
begins (at the arrowhead). Note that cell 4 oscillates independently. It is maximally
depleted at frame 1 and refills during frames 2-9. (b) Synchronization of ER Ca2+
release during Ca2+ oscillations in astrocytes. The same experiment as in a is shown.
Regions of interest (1-7) were defined in different cells as shown over the
pseudocolored image, which is the average of all the images of the whole
experiment. Ordinate: R/R0 in arbitrary units. Traces have been displaced vertically
for better visibility. AVG, averaged value of the 7 cells in the field. Note that [Ca2+]ER
decrease (D) is synchronous at D1 (D, ATP-induced), whereas D2-D5 start in one
cell and then progress to the others.
Figure 3. Functional mapping of acetylcholine responses in hippocampal slices
ex vivo. (a) Frame sequence during stimulation with acetylcholine (ACh; 200 µM, 30
s) in acute hippocampal slices from erGAP3 transgenic mice (line 10; P7). Cornus
ammonis regions (CA) and the upper blade of dentate gyrus (DG) are visible.
Measurements of ER- (erGAP3) and cytosolic (Rhod-3) Ca2+ were performed simultaneously. Frames were acquired every 10 s. Upper row: ER Ca2+ release,
evidenced by the decrease of the GAP signal in CA1, during ACh stimulation.
Calibration bar, 200 µm. Lower row, coordinated increase of Rhod-3 fluorescence,
indicating the increase of [Ca2+]
C by release from the ER. (b) Detailed kinetics of
experiment shown in a. Each graph symbol corresponds to 10 s. Note that the peak
[Ca2+]ER decrease required more than 30 s. The relaxation of the [Ca2+]C peak was
also faster than the one of the [Ca2+]ER peak. Video 2 shows the changes in erGAP3
during the whole experiment. Similar results were obtained with erGAP2 transgenic
mice (line 3).
Figure 4. Monitoring [Ca2+]ER dynamics during muscle contraction in the living
fly with erGAP3. (a, b) Specific expression of erGAP3 (green fluorescence) in the
thoracic muscle of Mhc-erGAP3 fly. Lateral view of bright field and fluorescence
image were superimposed in (a). Dorsal view of fluorescence and the ROI where it
was quantified is shown in (b). The muscles were stimulated via the giant fiber (see
Methods) at different frequencies with 5-10 V / 30-50 ms stimuli. (c) Individual SR
release Ca2+ events seen during stimulation at low frequency (0.5 Hz). Reciprocal responses of the GAP3 fluorescence excited at 470 and 405 nm. Fluorescence
images were acquired every 100 ms. (d) Comparison of ER Ca2+ release during
stimulation at low- (0.25 Hz) and high-frequency (4 and 16 Hz). The traces of
fluorescence excited at 470 nm are shown. (e) Complementary changes in the
Figure S1. Sensitivity of GAP2 to Mg2+ and pH. Figure S2. Calibration of erGAP in single HeLa cells.
Figure S3. Generation of erGAP transgenic mice and expression in the hippocampus.
Figure S4. Frequency-dependent summation of elementary muscle SR Ca2+ release events during repetitive
neural stimulation of living flies.
Movie S1. [Ca2+]ER oscillations in astrocytes.
Movie S2. Neurotransmitter functional mapping in hippocampal slices. Table S1. Screening for low Ca2+ affinity GAP mutants.
Table S2. Re-engineering of the GFP moiety to increase GAP fluorescence.
Supplementary Figure Legends
Fig. S1. Sensitivity of GAP2 to Mg2+ and H+. (a) Sensitivity to Mg2+; measurements were performed in solution
containing 140 mM KCl, 0.1, 1 or 5 mM MgCl2 and 20 mM MOPS/Na, pH 7.2. (b) Sensitivity to pH;
measurements performed in solution containing 140 mM KCl, 1 mM MgCl2 and the following
buffers (20 mM): pH 5.5-6.0, histidine/HCl; pH 6.5-7.5, MOPS/Na; pH 8.5, Tris/HCl. At pH 6 or below the Ca2+ affinity was substantially decreased.
Fig. S2. Calibration of erGAP in single HeLa cells. The erGAP2 stably expressing clone was used. The trace is
the average of 37 cells. Values were normalized to R0 or F0. (a) Cells were perfused with standard
incubation medium containing either 1 mM Ca2+ or no Ca2+ (0.1 mM EGTA) and 100 µM ATP or
200 nM thapsigargin as shown. (b) Details as in a, except that cells were first loaded with Fura-2 by
incubation with 2 µM Fura-2/AM for 90 min. GAP2 fluorescence was measured only at 470 nm excitation and it is expressed as F/F0. Fura-2 fluorescence was measured at 340 and 380 nm excitation
and is expressed as the ratio of the two fluorescences. TBH, 10 µM tert-butylhydroquinone; 5 Ca, standard medium containing 5 mM Ca2+.
Fig. S3. Generation of erGAP transgenic mice and expression in the hippocampus. (a) The transgene construct
included the following elements:CMV, cytomegalovirus early enhancer; cβA, chicken β-actin 5'-UTR; CAGp, promoter; I1, intron 1 (first intron of chicken β-actin gene); K, Kozac sequence; CR, human calreticulin signal peptide (MLLSVPLLLGLLGLAVAND); GAP2/GAP3, GFP-Aequorin Protein 2 or 3; KDEL, ER-retention tag; I2, intron 2; WPRE, woodchuck virus post-transcriptional regulatory element; polyA, bovine growth hormone polyadenylation sequence; βG polyA, β-globin polyadenylation sequence. Restriction enzyme sites for excision of the transgene are indicated (arrows). (b) Fluorescent image of a live hippocampus slice (350 µm thickness) isolated from
erGAP3 transgenic mice (Line 1; P5) taken at 470 nm excitation during 450 ms.
Fig. S4. Frequency-dependent summation of elementary muscle SR Ca2+ release events during repetitive neural
stimulation of living flies. The values of F/F0 for the fluorescences excited at 470 nm are shown. The decreases of the signal obtained at different stimulation frequencies are compared: 0.2 Hz (a), 4 Hz (b), and 16 Hz (c). Other details as in Fig. 4d. Images were taken at a rate of 1 frame every 100 ms. Supplementary Movies:
Video S1. [Ca2+]ER oscillations in astrocytes. Cultured astrocytes expressing erGAP2 were first stimulated with
a maximal ATP challenge during 1 min ER refilled rapidly upon stimulus washout. Then, cells were perfused with low-K+ (0.2 mM) medium for 5 min to induce Ca2+ entry; this resulted in
[Ca2+]
ER oscillations. On return to control medium containing 5 mM K+ the oscillations disappeared
and ER refilled quickly with Ca2+ recovering the baseline values.
Video S2. Neurotransmitter functional mapping in hippocampal slices. The slices were stimulated with ACh
(200 µM) for 30 s and then returned to control solution. Simultaneous measurements of [Ca2+] ER
(GAP3) and [Ca2+]
The lowest affinity mutant was No. 2, and was named GAP2.
RCa / REGTA RATIO
No. Mutated residues 0.1 mM Ca2+ 1 mM Ca2+ 1 mM / 0.1 mM
1 (D24H,D119A) 1.019 1.040 1.02
2 (D24N,D119A) 1.180 2.084 1.77
3 (D24V,D119A) 2.527 2.604 1.03
4 (V25P,D119A) 3.314 3.214 0.97
5 (N28Q,D119A) 1.002 1.046 1.04
6 (N28V,D119A) 0.998 1.014 1.02
7 (D35Q,D119A) 2.199 2.411 1.10
8 (Y38S,D119A) 2.405 2.289 0.95
9 (D117N,D119A) 0.998 1.022 1.03 10 (D117V,D119A) 2.393 2.423 1.01
11 (D119K) 2.057 2.270 1.10
12 (D119I) 1.426 1.506 1.06
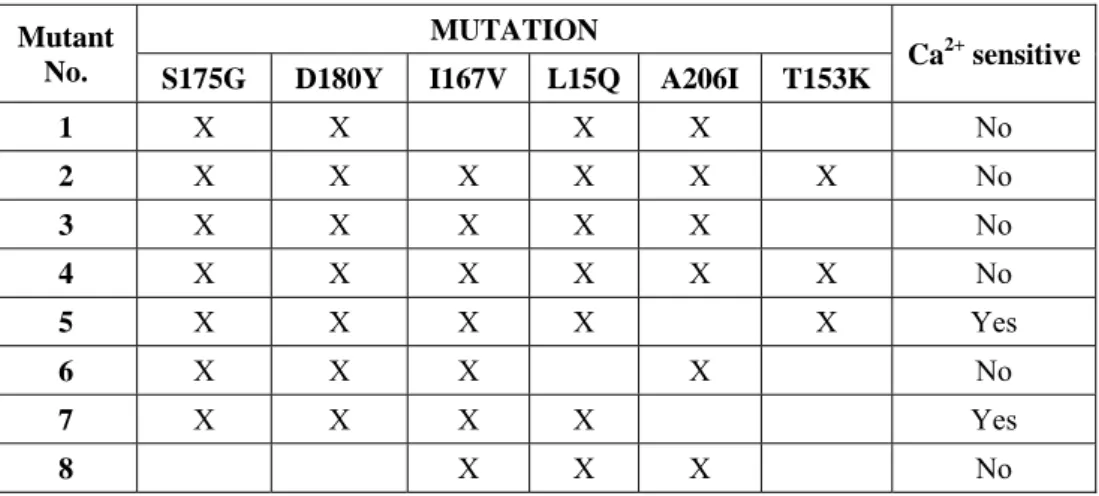
Table S2. Re-engineering of the GFP moiety to increase GAP fluorescence. GAP2 was humanized for codon
usage and re-engineered in different residues of the GFP moiety to increase GAP fluorescence (Heim, et al., 1994; Tallini, et al., 2006; Tian, et al., 2009; Zacharias, et al., 2002; Zhao, et al., 2011). In 6 variants the Ca2+ -sensitivity was lost. Mutant No. 7, named GAP3, gave the maximum increase in fluorescence
Mutant No.
MUTATION
Ca2+ sensitive S175G D180Y I167V L15Q A206I T153K
1 X X X X No
2 X X X X X X No
3 X X X X X No
4 X X X X X X No
5 X X X X X Yes
6 X X X X No
7 X X X X Yes
No. Mutation Sequence
1 D24H GTTCAATTTCCTTCATGTCAACCACAATGG
2 D24N GTTCAATTTCCTTAATGTCAACCACAATGG
3 D24V GTTCAATTTCCTTGTTGTCAACCACAATGG
4 D25P AATTTCCTTGATCCCAACCACAATGG
5 N28Q TGTCAACCACCAAGGAAAAATCTC
6 N28V TGTCAACCACGTCGGAAAAATCTC
7 E35Q GGAAAAATCTCTCTTGACCAGATGGTCTACAAGGCATC
8 Y38S ACGAGATGGTCTCCAAGGCATCTG
9 D117N GTTTGACATCGTTAACAAAGCCCAAAATGG
10 D117V GCTTTGTTTGACATCGTTGTCAAAGCCCAAAATGGAGC
11 D119K ATCGTTGACAAAAAGCAAAATGGAGC
12 D119I ATCGTTGACAAAATTCAAAATGGAGC
13 N121L TGACAAAGCCCAACTTGGAGCTATTACAC
14 E128K ATTACACTGGATAAATGGAAAGCATAC
15 E128R ATTACACTGGATAGATGGAAAGCATAC
16 D153L GAAACATTCAGAGTGTGCCTTATTGATGAAAGTGGACAACTCG
17 D155K TTCAGAGTGTGCGATATTAAAGAAAGTGGACAACTCG
18 E156N TGCGATATTGATAATAGTGGACAACTC
19 E156P TGCGATATTGATCCAAGTGGACAACTC
20 S157Q ATATTGATGAACAAGGACAACTCGATG
21 D161K AGTGGACAACTCAAAGTTGATGAGATG
22 E164K CTCGATGTTGATAAGATGACAAGAC
23 D175G CAACATAGAAGACGGCGGCGTACAGCTGGC
24 D180Y AGAAGACGGCGGCGTACAGCTGGCTTACCACTATCAGC
25 I167V AAAGCTAATTTCAAGGTGAGGCACAACATAGAAG
26 T153K ATAATGTGTACATAAAGGCCGACAAACAGAAGAACG
27 L15Q GTGGTCCCTATCCAGGTGGAACTCGATGG
28 A206I TCTGTCCACACAATCAATCCTGAGCAAGGACCC
29 A206K TCTGTCCACACAATCAAAGCTGAGCAAGGACCC
30 mGFPuv GATGGCAACATCCTCGGACA
31 mGFPuv GTCCTTGCTCAGGGCTGATT
32 hGAPDH GTCTTCTGGGTGGCAGTGATGG
Supplementary References
1. Heim, R., Prasher, D.C., and Tsien, R.Y. (1994). Wavelength mutations and posttranslational autoxidation of green fluorescent protein. Proc Natl Acad Sci U S A 91, 12501-12504.
2. Tallini, Y.N., Ohkura, M., Choi, B.R., Ji, G., Imoto, K., Doran, R., Lee, J., Plan, P., Wilson, J., Xin, H.B., et al. (2006). Imaging cellular signals in the heart in vivo: Cardiac expression of the high-signal Ca2+ indicator GCaMP2. Proc Natl Acad Sci U S A 103, 4753-4758.
3. Tian, L., Hires, S.A., Mao, T., Huber, D., Chiappe, M.E., Chalasani, S.H., Petreanu, L., Akerboom, J., McKinney, S.A., Schreiter, E.R., et al. (2009). Imaging neural activity in worms, flies and mice with improved GCaMP calcium indicators. Nat Methods 6, 875-881.
4. Zacharias, D.A., Violin, J.D., Newton, A.C., and Tsien, R.Y. (2002). Partitioning of lipid-modified monomeric GFPs into membrane microdomains of live cells. Science 296, 913-916.
F / F
0
R / R
0
(Rhod-3)
ATP in 0 Ca+TBH
0.5 0.6 0.7 0.8 0.9 1.0 ATP erGAP1 erGAP2 0.0 0.2 0.4 0.6 0.8 1.0
10-5 10-4 10-3 10-2 [Ca2+] (M)
0.4 0.6 0.8 1.0 1.0 1.1 1.2 1.3 0.3 0.5 0.7 0.9 1.1 1.3 0.9 1.5 ATP ATP Caf
c
d
Caf 2 min 5 min GAP2 GAP3 0 Ca+TBH 0 Ca+TBHF
405F
470 (erGAP3)R / R
0
F
/ F 0
(erGAP3)
(R - R
n1 n4 n2 n3 1.00 0.26 0.62 1 min REST 4 1 3 2 4
1 2 3 4 5 6 7 8 9
ATP +ATP Low K F470 R/R0 1 4 2 3 7 6 5 1 2 4 3 5 6 7 AVG
D1 D2 D3 D4 D5 5 min
ATP Low K
a
F / F
0R / R
00.6
0.8
1.0
1.2
ACh
1.4
0.8 1.0
0.4
(Rhod-3)
1 min
1
2
3
4
5
6
b
(erGAP3)
R
/ R
0 (erGAP3)
or F
/ F
0 (Rhod-3)
F / F
0
F /
F 0
F / F
0 0.90 0.95 1.00 0.25 Hz 4Hz 16 Hz 1.8 1.0 1.2 1.4 1.6 0.5 Hz 16 Hz 4 Hz 0.98 0.99 1.00 1.01
1.02 0.5 Hz
5 s
10 s
10 s
500 m 500 m
(R - R
min)/(
R
max- R
min)
(R - R
min
)/(
R
max- R
min)
0.0
0.2
0.4
0.6
0.8
1.0
10
-510
-410
-310
-210
-1b
pH 5.5
pH 6
pH 6.5
pH 7
pH 7.5
pH 8.5
0.0
0.2
0.4
0.6
0.8
1.0
MgCl
25 mM
MgCl
21 mM
MgCl
20.1 mM
10
-510
-410
-310
-210
-1a
[Ca
2+] (M)
F
340/ F
380F /
F
0R /
R
0ATP
ATP
CMV cβA CAGp I1K GAP2/GAP3 I2 WPRE polyA βG polyA
SspI BsaBI
0.5 Kb
CR KDEL
a
b
100µm
Linker
F /
F
0F /
F
0F /
F
01.00
0.99
0.98
0.97
0.99
0.98
0.97
0.96
0.95
0.94
0.93
0.98
0.96
0.94
0.92
0.90
a
b
c
0.2 Hz
4 Hz
16 Hz
1 s
1 s
Click here to access/download