1 23
International Journal of Colorectal
Disease
Clinical and Molecular Gastroenterology
and Surgery
ISSN 0179-1958
Int J Colorectal Dis
DOI 10.1007/s00384-012-1616-2
Expression and potential role of
apolipoprotein D on the death–survival
balance of human colorectal cancer cells
under oxidative stress conditions
Raquel Bajo-Grañeras, Jesús
Crespo-Sanjuan, Rosa M. García-Centeno, José
Antonio Garrote-Adrados, Gabriel
1 23
ORIGINAL ARTICLE
Expression and potential role of apolipoprotein D
on the death
–
survival balance of human colorectal
cancer cells under oxidative stress conditions
Raquel Bajo-Grañeras&Jesús Crespo-Sanjuan&Rosa M. García-Centeno& José Antonio Garrote-Adrados&Gabriel Gutierrez&Manuel García-Tejeiro& Beatriz Aguirre-Gervás&María D. Calvo-Nieves&Rosa Bustamante& Maria D. Ganfornina&Diego Sanchez
Accepted: 19 November 2012
#Springer-Verlag Berlin Heidelberg 2013 Abstract
Purpose Inverse correlations of apolipoprotein D (ApoD) expression with tumor growth have been shown, therefore proposing ApoD as a good prognostic marker for diverse cancer types, including colorectal cancer (CRC). Besides, ApoD expression is boosted upon oxidative stress (OS) in many pathological situations. This study aims at understand-ing the role of ApoD in the progression of human CRC.
Methods Samples of CRC and distant normal tissue (n051) were assayed for levels of lipid peroxidation, expression profile of OS-dependent genes, and protein expression. Three single-nucleotide polymorphisms in the ApoD gene were analyzed (n0139), with no significant associations found. Finally, we assayed the effect of ApoD in prolifera-tion and apoptosis in the CRC HT-29 cell line.
Results In CRC, lipid peroxides increase while ApoD mes-senger RNA and protein decrease through tumor progres-sion, with a prominent decrease in stage I. In normal mucosa, ApoD protein is present in lamina propia and enter-oendocrine cells. In CRC, ApoD expression is heteroge-neous, with low expression in stromal cells commonly associated with high expression in the dysplastic epithelium. ApoD promoter is basally methylated in HT-29 cells but retains the ability to respond to OS. Exogenous addition of ApoD to HT-29 cells does not modify proliferation or apo-ptosis levels in control conditions, but it promotes apoapo-ptosis upon paraquat-induced OS.
Conclusion Our results show ApoD as a gene responding to OS in the tumor microenvironment. Besides using ApoD as marker of initial stages of tumor progression, it can become a therapeutic tool promoting death of proliferating tumor cells suffering OS.
Keywords Lipocalin . Lipid peroxidation . Apoptosis . Predictive marker . DNA methylation . Colorectal cancer stages
Introduction
Colorectal cancer (CRC) is the second most common cancer in developed countries, being the third in frequency world-wide. CRC counts as the second most frequent cancer in women, following breast cancer, while it is the third most common cancer in men, after those from prostate and lung. In terms of causes underlying CRC, well-known risk factors are hereditary genetic predisposition, age, inflamma-tory colon diseases, and diet composition [1]. A correlation
MDG and DS contributed equally to this work.
Electronic supplementary material The online version of this article
(doi:10.1007/s00384-012-1616-2) contains supplementary material, which is available to authorized users.
R. Bajo-Grañeras
:
M. D. Ganfornina:
D. Sanchez (*) Instituto de Biología y Genética Molecular-Departamento de Bioquímica y Biología Molecular y Fisiología, Universidad de Valladolid–CSIC, c/ Sanz y Forés 3, 47003 Valladolid, Spaine-mail: [email protected]
J. Crespo-Sanjuan
:
R. M. García-Centeno:
J. A. Garrote-Adrados
:
M. García-Tejeiro:
B. Aguirre-Gervás:
M. D. Calvo-Nieves:
R. BustamanteHospital Clínico Universitario de Valladolid, Valladolid, Spain
G. Gutierrez
Departamento de Genética, Universidad de Sevilla, Sevilla, Spain Int J Colorectal Dis
DOI 10.1007/s00384-012-1616-2
between inflammation and CRC development has been ob-served in both chronic inflammation processes and inflam-matory bowel disease. The link between them may be the increase in COX-2 and nuclear factor kappa B during in-flammation, which triggers the release of tumor necrosis factor alpha and interleukin-6. These signals have been associated with tumor growth [2].
Growing evidence also points to the participation of reactive oxygen species (ROS) and their reactive derivatives in the pathogenic origin and development of CRC. Inflam-mation and environmental factors lead to the generation of large amounts of ROS in colon tissue, inducing in turn oxidative stress (OS). ROS damages DNA, proteins, and lipids, and these factors are correlated with tumor growth [3–5]. CRC cells show an increase in lipid peroxidation byproducts that could be triggered by the increased arach-idonic acid levels attained by the increased activity of COX-2 [6,7]. The accumulation of lipid peroxidation results in cell damage and death. However, cancer cells tend to reduce the levels of the antiproliferative cytokine TGF-β1 and the lipid peroxidation adduct 4-hydroxynonenal (4-HNE) as a way to prevent apoptosis [8]. The levels of lipid peroxida-tion thus reflect the health state of the tissue.
Apolipoprotein D (ApoD) is a member of the Lipocalin protein family whose expression has been related to cell cycle and cancer progression because this gene is induced by growth arrest and its presence reduces cell proliferation in some cellular models [9,10]. ApoD expression is regu-lated by p73 and p63, members of the p53 tumor suppressor family, both implicated in development control [11]. Many reports show an inverse correlation of ApoD expression levels with tumor growth [12], therefore proposing ApoD as a good diagnostic and prognostic marker.
Our laboratory studies the role of ApoD and its homo-logues in the nervous system using genetic model organisms such as the mouse and the fruit fly Drosophila mela-nogaster. Inducing OS by treatment with the ROS generator paraquat (PQ), we have demonstrated a protective function of ApoD in the organism survival. This effect was associat-ed with a role in regulating tissue homeostasis and in main-taining low levels of lipid peroxidation [13–15]. We have recently shown that ApoD contributes to reduce inflamma-tion levels in ROS-injured tissues and promotes the clear-ance of lipid peroxides in cells [16,17].
The fact that ApoD expression is inversely correlated with the malignity of various tumors has been described, but what triggers this repression and how it is causally linked to the final outcome of the patient is still poorly understood. As mentioned above, in many instances, tumor-al tissues develop OS. This fact represents a paradox, since OS is a positive stimulus triggering ApoD upregulation in other systems. An analysis of gene expression and an eval-uation of oxidative stress in the tissue along the progression
of CRC are here combined with studies in a cell-culture system to solve this question. Our aim is to get a deeper understanding of how ApoD has an impact in cancer pro-gression and patient survival.
In this report, we study the expression of ApoD in dif-ferent stages of cancer progression and its relationship with the levels of lipid peroxidation in CRC tissues. We also evaluate OS-dependent genes that show coregulated expres-sion patterns with ApoD to uncover potential signaling pathways that can become targets for therapeutic interven-tion. Our results show a repression of ApoD gene expres-sion in CRC, particularly in the initial stages of the disease, which correlates with an elevation of lipid peroxide adducts in the tissue. We also found several genes involved in ROS metabolism and antioxidant function that show expression patterns similar to ApoD through CRC progression stages. Finally, the role of ApoD in proliferation and apoptosis of tumor cells was studied, and the dependence of gene ex-pression on the DNA methylation state will be discussed in the context of tumor development and progression.
Materials and methods
Patients and tumor features
Our study was conducted on a group of 51 patients, of 70.14± 11.21 years of age, surgically treated for colorectal cancer at the Surgery Department of the Hospital Clínico Universitario de Valladolid (Spain) (Table1). The time since CRC diagnosis was 3–8 weeks. Patients receiving oncological treatment before surgery were excluded from the study. The study was approved by the Hospital Ethics Committee, in accordance with The Code of Ethics of the World Medical Association for experi-ments involving humans, and all subjects provided informed consent for the procedures.
The tumors belong to the histological type adenocarcino-ma and were diagnosed by routine histopathological exam-ination in the Pathology Department of the hospital.
The clinical evaluation of CRC progression involves tumor features such as size, penetration of colon tissue, lymph node, and vascular invasion, and the presence of distant metastases. We followed the classification stages (E0-IV), advocated by the American Joint Committee on Cancer, to categorize our samples.
Samples of tumor and healthy mucosa were selected, being the latter excised out of tissue at least 6 cm away of tumor edges. The samples used for biochemical and molec-ular biology experiments (∼1 cm3) were processed within 30–45 min after resection and either frozen in RNAlater (Ambion, USA) or snap-frozen and stored in liquid nitro-gen. Samples used for immunohistochemistry were fixed in formalin and embedded in paraffin.
Table 1 Clinical data of the CRC cases studied in this work
Characteristics of patients studied
Number of patients (n) 51
Gender (n)
Male 29 (56.86 %)
Female 22 (43.14 %)
Gender by stage (male/female) SI (9/7), SII (8/6), SIII (4/3), SIV (8/6)
Age (years)
Mean age 70.14±11.21
Age range 44–91
<50 (n) 3 (5.88 %)
>50 (n) 48 (94.12 %)
≥80 (n) 13 (25.49 %)
Age by stage SI (72.25±10.36), SII (66.29±13.36), SIII (68.86±9.63),
SIV (72.21±10.66)
Tumor size (mm)
Mean size 46.90±25.56
Size by stage SI (33±12.33), SII (54.21±31.96), SIII (67.86±32.64),
SIV (45±16.98)
Depth of invation (n) T1 (3), T2 (14), T3 (24), T4 (7)
Depth of invasion by stage (n) SI: T1 (3), T2 (13), T3 (0), T4 (0)
SII: T1 (0), T2 (0), T3 (12), T4 (2) SIII: T1 (0), T2 (1), T3 (5), T4 (1) SIV: T1 (0), T2 (3), T3 (7), T4 (4)
TNM stage (n) (UICC) SI (16), SII (14), SIII (7), SIV (14)
Tumor histology (n) Nonmucinous (44), mucinous (7)
Mucinous by stage (n) SI (2), SII (1), SIII (2), SIV (2)
Grade of differentiation (n) G1 (36), G2 (10), G3 (5), G4 (0)
Differentiation by stage SI: G1 (12), G2 (3), G3 (1)
SII: G1 (9), G2 (3), G3 (2) SIII: G1 (4), G2 (1), G3 (2) SIV: G1 (11), G2 (3), G3 (0)
Lymph node status (n) Negative (33), positive (18)
Positive lymph node by stage(n) SI (0), SII (0), SIII (6), SIV (12)
Prognosis after 1 year (n) Died (6) (11.1 %)
Died by stage (n) SI (1), SII (1), SIII (3), SIV (1)
Control tissues Normal colon adjacent to cancern054 for TBARS analyses,
n016 for qPCR anayses andn030 for immunoblot analyses
Int J Colorectal Dis
Immunohistochemistry
The paraffin-embedded samples were sectioned (3 μm thick) in a rotary microtome (Thermo), and the sections were mounted onto poly-L-lysine-coated glass slides. The hydration, blocking, washes, and incubation with antibodies were performed in the automated system BOND-MAX (Leica, Spain). ApoD immunohistochemistry was per-formed with rabbit anti-ApoD (Novocastra, USA) diluted 1:40 in Dako RealTM antibody diluent (Dako, USA), and horseradish peroxidase (HRP)-conjugated secondary anti-body (ready to use dilution in bond polymer detection solution, Novocastra, USA). Signal detection was per-formed with HRP-driven diaminobenzidine oxidation reac-tion. After dehydration, clearance, and mounting, the sections were observed with an Eclipse 90i (Nikon, Spain) microscope equipped with a DS-Ri1 (Nikon) digital camera. Images were acquired and processed with NIS-Elements BR 3.0 software (Nikon).
Evaluation of histological samples was carried out in ×200 fields of randomly selected slides and assessed by an expert pathologist. ApoD staining was categorized in four classes according to the percentage of ApoD-positive cells: 1 (0 %), 2 (<15 %), 3 (15–50 %), and 4 (>50 %).
Immunoblot analysis
Tumor and normal mucosal tissues were homogenized in lysis buffer [1 % Nonidet P-40, 0.1 % sodium dodecyl sulfate (SDS), 10 % glycerol, 1 % sodium deoxycholate, 1 mM dithiothreitol, 1 mM EDTA, 100 mM HEPES, 100 mM KCl, 10 % complete protease inhibitors (Roche, Germany) in phosphate-buffered saline (PBS)], centrifuged after 30 min at 4 °C, and the super-natants were stored at−20 °C until further use.
Protein concentration in the samples was determined with the Micro-BCA™protein assay (Pierce, USA). Immunoblot analyses were performed with 30μg of total protein sepa-rated by SDS polyacrylamide gel electrophoresis on a 12 % polyacrylamide gel and transferred to polyvinylidene fluo-ride membranes following standard procedures. As primary antibody, we used a rabbit serum antihuman ApoD (gener-ated by Dr. C. López-Otín, Univ. Oviedo, Spain) diluted 1:1,000. As secondary antibody, we used HRP-conjugated antirabbit antibody diluted 1:2,000 (Santa Cruz Biotechnol-ogy, USA). Each blot was also incubated with HRP-conjugated anti-β-Actin antibody diluted 1:250,000 (Sigma, Spain) for normalization purposes. Membranes were devel-oped with ECL (Millipore, USA). The integrated optical density of the immunoreactive protein bands was measured in images taken within the linear range of the charged coupled device camera (VersaDoc, BioRad, Spain) avoiding signal saturation. Mean +SD of arbitrary density units was calculated from at least duplicate blots.
Quantitative real-time RT-PCR
Tissue samples stored in RNAlater were homogenized in TRIzol (Invitrogen, Spain) with an OMNI blender (three 10-s 10-stroke10-s at maximum 10-speed). RNA from ti10-s10-sue10-s or cell10-s wa10-s extracted following the TRIzol protocol. Total RNA (1μg) was reverse-transcribed with Prime-ScriptTM (Takara, Ja-pan) and treated with DNaseI. The complementary DNA (cDNA) obtained was used as template for quantitative reverse transcriptase PCR (qRT-PCR) amplifications. To quantify human ApoD expression, we used SYBR Green I (Takara) and the primers human ApoD-forward, 5′ -CCACCCCAGTTAACCTCACA, and human ApoD-reverse, 5′-CCACTGTTTCTGGAGGGAGA. The human gene RPL18, amplified with primers RPL18-forward, 5′ -CCATCATGGGAGTGGACAT, and RPL18-reverse, 5′ -CACGGCC GTCTTGTTTTC, was used as a reference be-cause neither genotype nor treatment gives a significant fold change. Amplifications were performed in five (ApoD) or four (RPL18) replicates in a Rotor-Gene RG-3000 (Corbett Research, UK) thermal cycler. Cycling conditions were as follows: 95 °C, 5 min; 40 cycles (95 °C, 30 s; 55 °C, 15 s; and 72 °C, 15 s).
To study the expression of genes related to the antioxidant response and ROS metabolism, we used qRT-PCR and a SybrGreen-based array (PAHS-065; SABiosciences, USA). Gapdh was selected as the reference gene. Amplifications were performed in quadruplicate in an ABI Prism 7900HT (Applied Biosystems, USA). Standard cycling conditions were as follows: 95 °C, 5 min; 40×(95 °C, 30 s; 60 °C, 1 min).
Changes in transcriptional expression were estimated using theΔΔCTmethod [18]. The following criteria were
applied to our analysis. (1) Replicates with variation coeffi-cient>2.5 % were excluded. (2) Undetermined CT values
(gene expression below detection levels) were assigned CT0
35. Pairwise comparisons where the gene average CT>
35 cycles in both conditions were excluded from the analy-sis. (3) Only transcriptional changes≥2-fold were included in the analysis. Significant differences of gene transcription-al changes were evtranscription-aluated with a Mann–Whitney U test, usingΔCTof each replica. Values are expressed as mean ±
SEM. Only statistically significant (P<0.05) differences of expression are presented and discussed in the text.
ApoD polymorphism analysis
Blood samples of CRC patients included in the study (n0
139) were collected before surgery, and those of control healthy subjects (n0102) were obtained upon their approval to enter the study.
Genomic DNA was extracted from peripheral blood cells using a DNA purification system (Magna Pure, Roche). Three APOD single-nucleotide polymorphisms (SNPs) located in
chromosome 3 were genotyped. These SNPs were the follow-ing: (1) (rs5952) 15T→C, NM_001647.2:c.44T>C, NP_001638.1:p.Phe15Ser; (2) (rs1568565) –352G→A, NM_001647.2:c.124–352T>A; (3) (rs1467282) +718C→T, NM_001647.2:c.334+718T>C. Genotyping was carried out in a LightCycler 480 II (Roche) by analyzing melting curves of amplicons. Primers and fluorescent probes were designed with the LightCycler ProbeDesign program (v.2.0) and syn-thesized (Biomol, UK). The PCR reactions were performed with 50–100 ng genomic DNA, 0.5μM of each primer, and 0.1μM of each probe. PCR conditions were 95 °C, 2 min followed by 40 cycles (95 °C, 5 s;X°C, 15 s; 72 °C, 20 s). Annealing temperature (X) was 62 °C for rs5952, 60 °C for rs1467282, and a touchdown from 57 to 62 °C for rs1568565. Thermal conditions for the analysis of melting curves were 95 °C, 30 s followed by a gradient of 50–90 °C at a rate of 0.1 °C/s.
TBARS assay
To measure the levels of lipid peroxidation in the tissues, the 2-thiobarbituric acid (TBA) reactive species (TBARS) assay was performed. Tumor and normal colonic tissues were homogenized in PBS in the presence of butylated hydrox-ytoluene. Extracts were incubated with 0.2 M glycine–HCl, pH3.6, and TBA reagent (0.5 % TBA, 0.5 % SDS). After 15 min incubation at 90 °C, samples were cooled on ice and transferred to a 96-well microplate for triplicate readings. Absorbance was monitored at 532 nm in a Versamax micro-plate reader (Molecular Devices, USA). The experimental values were normalized to protein concentration. Two inde-pendent experiments with measurements in triplicate were performed.
Cell culture and immunocytofluorescence
The cell line HT-29 (kindly donated by Dr. C. Villalobos, IBGM, Spain) was cultured and maintained in Dulbecco’s modified Eagle’s medium (Lonza Iberica, Spain) with 10 % fetal bovine serum (FBS; Lonza Iberica), 1 %L-glutamine, and 1 % antibiotic cocktail (penicillin, 10 U/μl; streptomy-cin, 10μg/μl; amphotericin B, 25μg/ml; Lonza Iberica) at 37 °C in 5 % CO2with 90–95 % humidity.
To analyze the effect of 2′-deoxy-5-azacytidine (DAC; Sigma), this demethylating agent was added at 1μM to the culture medium, and the cells were cultured for 24 h, as suggested by Hagemann et al. [19].
Paraquat (1,1′-dimethyl-4,4’-bipyridinium; Sigma) was added to the culture medium in the absence of FBS for either 6 h (to assess ApoD expression profile) or for 24 h (to evaluate cell death and proliferation).
Human ApoD purified from cystic fluid was kindly do-nated by Dr. E. Rassart, (University of Québec at Montreal,
Canada) and added (4 nM) to the cell culture medium for 24 h in the absence of FBS.
Cells used for proliferation and apoptosis assays, as well as for ApoD immunofluorescence, were cultured onto
poly-L-lysine (Sigma) coated coverslips. Fixation was performed in 4 % formaldehyde in PBS for 15 min, followed by washes in PBS, and cells were blocked and permeabilized in PBS with 0.25 % Triton X-100 and 1 % normal goat serum. A rabbit primary antibody antihuman ApoD (gener-ated by C. López-Otín, Univ. de Oviedo) and an Alexa 488-conjugated secondary antibody were used for ApoD immu-nofluorescence. After mounting with Vectashield-DAPI (Vector Labs, USA), the cells were observed with an Eclipse 90i (Nikon) microscope, and images were taken with a DS-Ri1 (Nikon) digital camera, acquired with NIS-Elements BR 3.0 software (Nikon) and processed with ImageJ (v1.45 s). For normal, proliferating or apoptotic cell counting, we acquired images under the same conditions of illumination, diaphragm and condenser adjustments, exposure time, back-ground correction, and color levels. A minimum of five ×20 fields randomly taken were used for quantification. Proliferation and apoptosis assays
Terminal deoxynucleotidyl transferase dUTP nick end la-beling (TUNEL) assay was used to evaluate the DNA frag-mentation that occurs in the last phase of apoptotic cell death. A TUNEL labeling kit (Roche) was used. Cell pro-liferation was assessed with the Clik-iT® EdU kit (Invitrogen) according to the manufacturer’s protocol. This assay detects the newly synthesized DNA by incorporation of a modified nucleoside, 5-ethynyl-2′-deoxyuridine (EdU) during DNA synthesis.
Statistical analysis
Statistical analyses used for testing differences in expression levels were performed with Statgraphics plus (v 5.0) and Sigmaplot (11.0) softwares.p<0.05 was defined as a thresh-old for significant changes. SNPs association analysis was performed with SNPStats [20]; http://bioinfo.iconcologia. net/snpstats/start.htm].
Results
Lipid peroxidation increases with the clinical stage of colorectal cancer
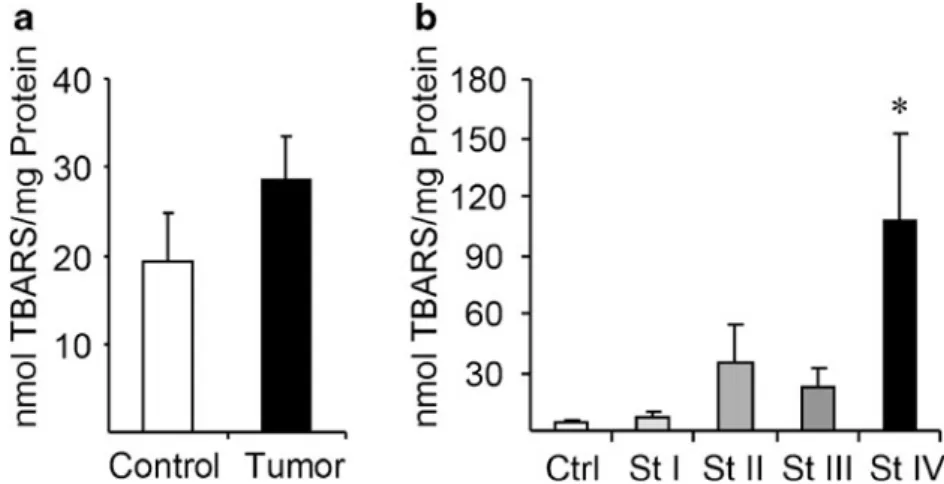
The levels of lipid peroxidation adducts were evaluated with the TBARS method in our samples of adenocarcinoma and control adjacent tissue. Overall, the lipid peroxidation levels are increased in cancer tissues compared to normal mucosa
Int J Colorectal Dis
(Fig.1a), as was previously described in blood [21]. How-ever, when different stages of cancer development are taken into account, a maximum increase in TBARS signal was observed in stage IV adenocarcinomas (Fig.1b).
ApoD expression levels in CRC progression
Many reports document low levels of ApoD in different forms of cancer [22–29]. In primary colorectal cancer, Ogawa et al. [30] corroborated a similar downregulation of ApoD messenger RNA (mRNA), and by establishing two categories of mRNA expression, they found a positive cor-relation between ApoD levels and CRC patient survival. However, an account of the development of ApoD expres-sion in different tumor stages has not been studied. We therefore have examined the expression of ApoD in CRC tissue compared to normal colonic mucosa and have quan-tified ApoD gene expression by qRT-PCR and protein levels by immunoblot at different stages.
ApoD mRNA levels show an overall decrease in malignant tissue, with a particularly strong decline in mRNA levels in stage I CRC tissue (Fig.2a). This sharp downregulation of mRNA in the initial stages of the tumor accounts for the decrease in protein levels observed in immunoblot studies (Fig. 2b). The reduced protein levels are then maintained during subsequent tumor developmental stages, with a lesser amount of downregulation in stages II and III.
Immunohistochemical localization of ApoD in normal mucosa and CRC tissue
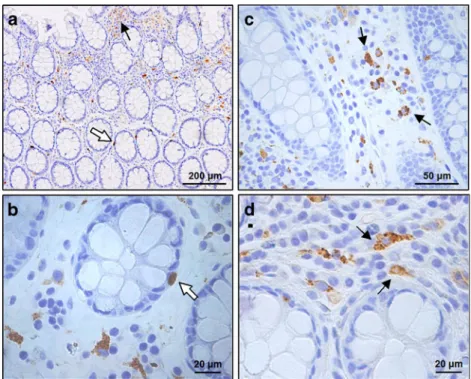
ApoD is found to be expressed in cells of normal colonic mucosa both in the epithelium (white arrow in Fig.3a) and the lamina propia (arrow in Fig.3a). In the epithelium, ApoD labeling is observed in the cytoplasm of basally located cells
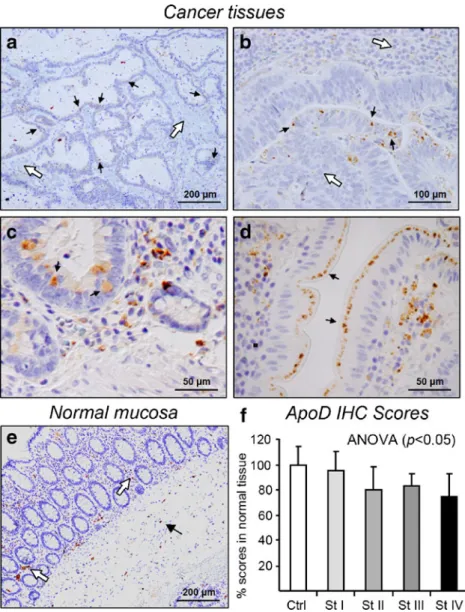
(white arrow in Fig.3b), with position and morphology resem-bling enteroendocrine cells (see“Discussion”). In the lamina propia, ApoD is seen as a cytoplasmic vesicular labeling in plasma cells (Fig. 3c, d), possibly in fibroblasts, a cell type known to express ApoD [31,32]. Other unidentified ApoD-expressing cells are seen in the submucosa (arrow in Fig.4e). After studying the localization of cells expressing ApoD in the normal mucosa, we proceeded to find out whether the decrease in ApoD mRNA and protein levels observed in CRC malignant tissues (Fig.2) is due to a general reduction in expression in the cells that normally express ApoD or alternatively to a heterogeneous decrease in ApoD-expressing cells (Fig. 4a–e). A general decrease in ApoD labeling is clear in the tumor tissue (Fig.4a) compared to the normal tissue (Fig. 4e). However, the decrease in stromal labeling seen in malignant tissues when compared to the normal mucosa (white arrows in Fig. 4a, bvs. e), is com-monly accompanied by an increase in the number of cells expressing ApoD in the dysplastic epithelium of the tumor tissue (arrows in Fig. 4c, d). Thus, regulation of ApoD protein expression in tumor tissues is more complex than a pure downregulation of ApoD.
Finally, we evaluated semiquantitatively the expression of ApoD in histological samples of tumor and normal mu-cosa tissues. The percentage of ApoD-expressing cells was estimated by scoring the staining obtained with immunohis-tochemistry. Net amounts of ApoD significantly decrease in malignant tissue progressively with CRC developmental stages (Fig.4f).
Expression profile of ROS-dependent genes in CRC progression and coregulation with ApoD
The transcriptional levels of a set of 84 genes known to be related to ROS metabolism and antioxidant response were
Fig. 1 Lipid peroxidation increases in terminal stages of colorectal
cancer.aThe levels of lipid peroxidation adducts, assayed by TBARS, increase in colorectal tumor tissue of pooled stages compared to control healthy mucosa tissue. b When analyzed independently in
evaluated by qRT-PCR using the GAPDH gene as a ubiq-uitous control and the levels of gene transcription in normal tissues as the calibrator for relative quantification.
Most of the genes of our array showed an upregulation in the tumor tissue as compared to normal colonic tissue (Fig. 5a), and 32 genes showed significant changes of
expression in the tumor tissues according to the criteria described in“Materials and methods.”The complete list of genes showing significant changes is in Table2.
Since we have studied the gene expression profile in different stages (I–II, III, and IV), we were interested in looking at the patterns of gene expression with tumor pro-gression. Most of the genes studied (63 %) showed a peak of expression at stage III (expression pattern type 1; Fig.5b), while 13 % show higher expression at stages I–II (expres-sion pattern type 2; Fig.5c). Some genes, like SGK2, show an upregulation in all of the CRC stages (expression pattern type 3; Fig. 5c), while only 6 % of genes show increased expression with advanced stages of tumor development (expression pattern type 4; Fig.5e).
The expression profile study also allows searching for genes that show coregulation of expression with ApoD, as possible targets to study ApoD-related gene pathways. The genes showing downregulation with tumor development account for 7 % of the total studied (expression pattern type 5; Fig.5f), and some of them are functionally linked in a gene network (Fig.1Sand Table1S).
ApoD polymorphisms and CRC risk
Several SNPs of the human ApoD gene have been reported to associate with disease states such as Alzheimer’s (AD) and schizophrenia [33,34]. We have genotyped three SNPs (rs5952, rs1568565, and rs1467282) that have been associ-ated to AD [33,35]. The single and multiple SNPs analyses are shown in Tables2Sand 3S. A study of the haplotypes generated by the SNPs analyzed in our study found no significant association with CRC risk (Table3S).
ApoD expression in the CRC cell line HT-29 and its role in proliferation and cell death
DNA methylation is a mechanism by which tumor cells silence gene expression [36], and several reports have shown that ApoD is a hypermethylated cancer-associated gene [29,
30,37]. ApoD is upregulated by, and protects against, oxida-tive stress [9,13,15]. As reported here and in other works, ApoD expression is maintained at general low levels in tumor tissues, which, along with its positive regulation by growth arrest [38], supports the proposal made by several authors that ApoD is a tumor suppressor gene [30]. Nevertheless, malig-nant cells generate high levels of ROS and boost lipid per-oxides, which in turn should increase ApoD expression [16]. How could we explain this paradox?
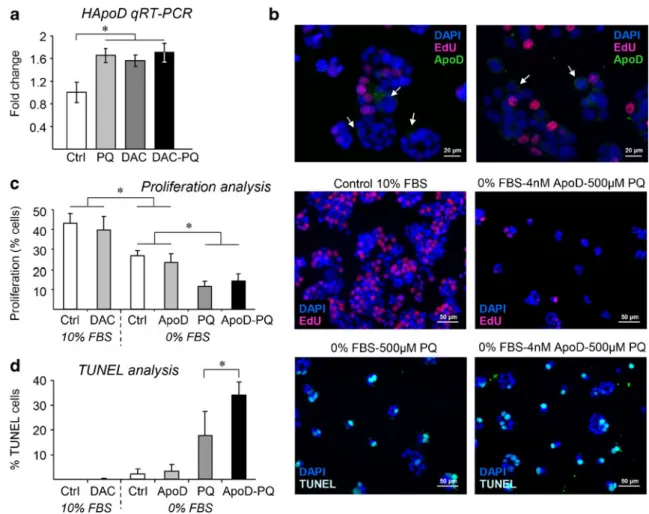
We set up to test the effect of ApoD silencing by meth-ylation and ApoD regulation by stress, on the proliferation and death of the CRC cell line HT-29 (Fig.6). Demethyla-tion with DAC liberates ApoD from methylaDemethyla-tion-induced silencing and increases its expression (1.6-fold mRNA
Fig. 2 Human ApoD is down-regulated in CRC tissues. a HApoD
mRNA expression levels are decreased in colorectal tumor tissue, especially in stage I. Quantitative RT-PCR values are represented with respect to control conditions (calibrator sample). Relative amounts with respect to control healthy tissue in each tumor stage are shown.
bHApoD protein levels remain low in tumor tissue during all stages of disease. Detection and quantification of HApoD was performed by immunoblot analysis. The blot shows a representative experiment of pooled samples for each stage with equal amounts of total protein extracts from control and CRC tissues.Bar graphrepresents mean± SD of three independent immunoblot experiments. Densitometry val-ues were normalized toβ-actin and shown as percent of control values. Statistical differences assayed by Mann–WhitneyUtest inaand by ANOVA test inb. *p<0.05
Int J Colorectal Dis
induction; Fig.6a) to levels known to significantly decrease cell growth [29]. PQ treatment increases ApoD expression to levels similar to those attained by treatment with DAC. Our analysis also suggests that there is an upper limit of endogenous expression that can be reached either by deme-thylation or after exposure to OS, as no further ApoD expression is attained by simultaneous treatment with DAC and PQ (Fig.6a). Curiously, these constantly prolifer-ating cells are able to express ApoD while they have not entered cell cycle. This is clear in Fig.6b, where only EdU-negative cells (arrows) express ApoD.
Demethylation with DAC, which causes an increase in ApoD expression, affects neither cell proliferation (Fig.6c) nor cell death (Fig.6d) under control culture conditions. On the other hand, serum starvation stress halts proliferation as expected (Fig.6c) without significant effects on cell death (Fig.6d). We then tested whether the exogenous addition of human ApoD to the cell culture medium affects cell growth. In control conditions, ApoD added to the culture medium at concentrations known to protect cells from stress [16] does not have a significant effect in proliferation or apoptosis levels (Fig.6c,d).
As mentioned above, tumor growth increases ROS and inflammation levels. The treatment of HT-29 cells with the ROS generator paraquat (PQ), which induces ApoD expres-sion in these cells (Fig.6a) and in a number of experimental models [13,15, 16], shows a dramatic effect on both cell proliferation and cell death (Fig. 6c, d). Interestingly, the simultaneous addition of exogenous ApoD does not affect proliferation (Fig.6b), but significantly increases apoptotic cell death upon PQ-induced oxidative stress (Fig.6c).
Discussion
Oxidation state of CRC along stages and its relationship to ApoD expression
The particular metabolic demands of cancer cells are known to generate increased levels of ROS in many tumor types, and this in turn results in peroxidation of cell membrane phospholipids. An increase in lipid peroxidation, both in blood and cancerous tissue samples, has been previously reported in primary CRC patients [39–41]. In particular, Skrzydlewska et al. [41] found a steady increase of the lipid peroxide adduct MDA in malignant tissue of stages II–IV and a sustained increase in 4-HNE. Although our results confirm the previous findings, we observed a sharp increase in lipid peroxide adducts in stage IV of CRC. Our results are also in agreement with the reported deployment in stage IV CRC of nonenzymatic antioxidants such as GSH and vita-mins C and E [41].
An extensive literature supports the notion that tumor cells maintain low levels of ApoD in their surroundings, and a decreased mRNA and/or protein expression has been reported in breast [22], ovary [23], prostate [24], hepatic [25,26], neural [27,28], esophageal cancer [29], and colo-rectal cancer [30]. Our data show a prominent decrease in mRNA and protein levels in the initial stages of CRC. While mRNA levels are kept below normal throughout the pro-gression of the tumor, they increase with respect to the stage I levels, in parallel with the increase in lipid peroxidation adducts, indicating a complex temporal regulation of ApoD depending on the phisiological state of the tissue.
Fig. 3 ApoD protein
expression in normal colon tissue. Mesenchymal cells express ApoD in normal mucosa (arrowsina,c, andd) and a small number of possibly enteroendocrine cells show ApoD labeling in the colonic crypts (white arrowsinaandb)
Cell-type distribution of ApoD expression in normal and cancerous colorectal tissues
As shown above, in addition of the ApoD-expressing cells in the lamina propia, ApoD-positive cells are observed in the epithelium. These cells, according to their location and morphology, could be the endocrine cells of the crypts, known to be secreting a number of hormones as well as cell stress proteins such as heat shock protein 1 and superoxide dismutase 1 [42]. Interestingly, enteroendocrine colonic cells are involved in immune activation and inflammatory response (reviewed by [43]), a role that has also been proposed for ApoD [16,44,45]. In CRC, ApoD immuno-reactivity changes heterogeneously, with more ApoD-positive cells generally seen in the dysplastic epithelium. These altered epithelial cells might be those keeping their ability to respond to the increasing oxidative stress by upregulating ApoD. The remaining malignant cells downregulate ApoD expression, thus resulting in a
global decrease in ApoD. We propose that a balance between two different cellular behaviors can be the final determinant of the patient outcome. Understanding this differential regulation of ApoD along the different stages of CRC is therefore of special interest for further research.
The transcriptional responses of ROS-dependent genes parallel or oppose ApoD expression changes throughout the stages of CRC
We observe a general upregulation of antioxidant gene expression when comparing CRC and control tissues, as it has been previously described [41,46]. It accounts for the timely cell response to cope with the increasing levels of oxidative stress generated by the abnormal proliferation of cancerous cells. However, the different patterns of expres-sion along CRC stages reveal subsets of genes functionally linked that deserve more studies. Only a few of the genes
Fig. 4 Human ApoD is
globally down-regulated in co-lorectal tumors but shows het-erogeneous changes of expression in different cell types.a–dHApoD protein ex-pression in CRC tissues.White
arrowspoint to stromal tissue
that shows minimal ApoD la-beling.Arrowsindicate ApoD-positive cells in the dysplastic epithelium and carcinoma tis-sue.eApoD expression in nor-mal mucosa shown for comparison.eSemiquantitative expression of ApoD by scoring immunohystochemical labeling of samples according to their developmental tumor stage. Data represent mean±SD of samples. Statistical differences were assayed by Anova test. *p<0.05
Int J Colorectal Dis
studied respond, like ApoD, with a decrease in expression. Moreover, though not explored in our arrays, the gene PACAP was also found strongly downregulated in CRC tissues [47], and it is known to participate in the regulation of ApoD expression [48].
Another interesting finding of our study is the different expression pattern exhibited by ApoE (expression pattern type 2; upregulated) and ApoD (expression pattern type 5; downregulated), two proteins frequently proposed to show coregulation because of their presumed function in lipoprotein metabolism. These opposite expression pro-files, already reported in our previous studies on ApoD function in the nervous system [16, 45], point to differ-ent roles for the two lipoproteins.
It is interesting to note that despite a consistent downregulation has been found in many cancer types for ApoD, this gene does not stand as a CRC biomarker in several metanalyses of expression profiles [49, 50]. We think that these results are due to the expression changes with tumor progression reported above. Instead, and based on our results, ApoD could be used as a marker for initial stages of tumor invasion beyond the colonic mucosa.
ApoD as a cell-death-promoting factor in CRC cells In this work, we verify that the ApoD promoter is basally methylated in the CRC HT-29 cell line, which silences to
PDLIM1 MSRA MPO OXR1 CSDE1 PXDN MT3 PRDX6 PRDX3 PRDX4 NOX5 NME5 NUDT1 EPHX2 KRT1 SOD1 DGKK GPX2 PRDX2 TXNRD1 ALB DUOX2 MBL2 SIRT2 PRNP STK25 OXSR1 SOD3 PTGS1 SRXN1 LPO DHCR24 IPCEF1 GPR156 APOE CYGB CAT SGK2 ALOX12 NOS2 SELS DUOX1 GTF2I TTN ATOX1 PRDX5 CYBA BNIP3 GPX4 MGST3 SOD2 PRG3 NCF1 PRDX1 MPV17 SCARA3 CCS GPX6 GSR PTGS2 PXDNL NCF2 GPX1 SEPP1 TXNDC2 SFTPD MTL5 PNKP DUSP1 GPX5 GLRX2 FOXM1 ANGPTL7 EPX CCL5 RNF7 AOX1 GPX3 TPO GPX7 PREX1 GSS GSTZ1 TXNRD2
Expression pattern Type 1
0 10 20 30 40 50
ANGPTL7
CCL5 CCS EPX
GLRX2 GPX2 GPX3 GPX5 GPX7
GSS
GSTZ1 GTF2I
MT3
PRDX1 PXDNL SEPP1
TXNDC2 TXNRD2
AOX1 GPX6
MPV17 PRDX3
SCARA3
TPO
Genes
Fold Regulation
St I-II St III St IV
Gene expression
Min Avg Max
a
0 2 4 6 8 10
SGK2
Genes
0 1 2 3 4 5 6
NME5
Genes
0 2 4 6 8 10
APOE DHCR24 LPO SRXN1
Genes
St I-II St III St IV
-12 -10 -8 -6 -4 -2 0
SIRT2 ALB
Genes St I-II St III St IV
Fold Regulation Fold Regulation Fold Regulation Fold Regulation
b
c
d
e
f
Expression pattern Type 2
Expression pattern
Type 3
Expression pattern
Type 4
Expression pattern Type 5
Fig. 5 Quantitative RT-PCR expression profiles of OS-related genes
in CRC tissues of different developmental stages.aCluster analysis and heat map of the genes that showed genotype-dependent significant differences. Columns represent samples, and rows represent genes.
Relative quantification scaling and corresponding color codes are shown at the bottom-left. Fold change values are listed in Table 2.
b–fDifferent patterns of gene expression are shown
T able 2 Expression profiles of genes related to ROS metabolism and antioxidant response in CRC tumor tissues of dif ferent stages Up – down regulation (comparing to control group) S ta g es I an d II Stage III Stage IV p value (comparing to control group) Fold regulation Comments Fold regulation Comments Fold regulation Comments Group 1 Group 2 Group 3 Gene name ALB − 5.42 − 1.08 − 10.83 0.000359 0.344061 0.000179 Albumin ALOX12 5.33 A 5.64 A 3.93 A 0.014894 0.000001 0.000021 Arachidonate 12-lipoxygenase ANGPTL7 4.18 7.85 4.23 0.001781 0.001 177 0.022402 Angiopoietin-like 7 AOX1 8.66 20.24 A 1 1.55 0.005527 0.000167 0.000106 Albumin APOE 2.56 2.40 2.26 0.012312 0.000031 0.000003 Apolipoprotein E A T OX1 − 1.64 B 1.45 B − 1.62 B 0.207943 0.2676 0.204858 A TX1 antioxidant protein 1 homolog (yeast) BNIP3 1.13 2.10 − 1.82 0.355284 0.000285 0.004312 BCL2/adenovirus E1B 19 kDa interacting protein 3 CA T 5.79 A 5.08 A 5.90 A 0.020306 0.000017 0.000092 Catalase CCL5 5.10 9.08 4.15 0.0031 17 0.000887 0.00001 Chemokine (C – C motif) ligand 5 CCS 2.58 8.67 2.32 0.006973 0.000001 0.000069 Copper chaperone for superoxide dismutase CSDE1 1.07 B 1.37 B 1.65 0.750389 0.164293 0.020505 Cold shock domain containing E1, RNA-binding CYBA 1.01 3.26 − 1.53 0.816368 0.000371 0.000681 Cytochrome b-245, alpha polypeptide CYGB 2.86 A 2.67 A 2.45 A 0.007389 0.000237 0.000035 Cytoglobin DGKK 12.50 A 14.98 A 13.00 A 0.00185 0.000002 0.000013 Diacylglycerol kinase, kappa DHCR24 9.1 1 5.75 5.14 0.000015 0.000051 0.000469 24-dehydrocholesterol reductase DUOX1 10.94 A 12.97 A 9.61 A 0.003242 0.000002 0.000016 Dual oxidase 1 DUOX2 − 1.61 A − 1.35 − 1.79 0.016687 0,014672 0,001593 Dual oxidase 2 DUSP1 13.98 A 22.63 A 12.67 A 0.004939 0.000001 0.000186 Dual specificity phosphatase 1 EPHX2 4.21 A 6.15 A 5.88 0.010745 0.00022 0.000494 Epoxide hydrolase 2, cytoplasmic EPX 5.91 1 1.27 5.88 0.003998 0.000002 0.00003 Eosinophil peroxidase FOXM1 3.53 A 6.15 A 3.36 A 0.005489 0.000023 0.000036 Forkhead box M1 GLRX2 6.05 10.90 5.94 0.000987 0.000155 0.000051 Glutaredoxin 2 GPR156 3.97 A 3.42 A 3.38 A 0.005431 0.000054 0.000003 G protein-coupled receptor 156 GPX1 18.39 A 36.88 A 21.39 A 0.005394 0.000028 0.000002 Glutathione peroxidase 1 GPX2 2.32 2.65 2.39 0.01818 0.000054 0.000088 Glutathione peroxidase 2 (gastrointestinal) GPX3 12.21 33.67 18.00 0.002722 0.000003 0.000001 Glutathione peroxidase 3 (plasma) GPX4 1.52 B 2.54 − 1.63 0.050446 0.00028 0.019233 Glutathione peroxidase 4 (phospholipid hydroperoxidase) GPX5 2.85 3.99 2.50 0.010091 0.006701 0.000062 G lu ta th io n e p er o x id as e 5 (e p id id y m al an d ro g en -r el at ed p ro te in ) GPX6 5.87 48.16 A 8.07 0.017343 0.000026 0.003525 Glutathione peroxidase 6 (olfactory) GPX7 4.80 10.55 4.48 0.004305 0 0.000825 Glutathione peroxidase 7 GSR 2.01 B 8.67 1.90 0.068594 0.000002 0.030164 Glutathione reductase
Int J Colorectal Dis
T able 2 (continued) Up – down regulation (comparing to control group) S ta g es I an d II Stage III Stage IV p value (comparing to control group) Fold regulation Comments Fold regulation Comments Fold regulation Comments Group 1 Group 2 Group 3 Gene name GSS 5.95 16.66 7.29 0.00315 0 0.001624 Glutathione synthetase GSTZ1 5.41 12.29 6.07 0.00805 0.000019 0.000012 Glutathione transferase zeta 1 GTF2I 9.85 1 1.70 9.09 0.001747 0 0 General transcription factor II, i KR T1 1 1.90 A 16.67 A 17.51 A 0.001463 0.000019 0.000035 Keratin 1 LPO 3.35 2.69 2.46 0.010494 0.000057 0.000225 Lactoperoxidase MBL2 − 1.81 − 1.26 − 1.77 A 0.01 184 0.013227 0.00087 Mannose-binding lectin (protein C) 2, soluble (opsonic defect) MGST3 1.44 A 2.07 A − 1.06 B 0.140885 0.00217 0.63463 Microsomal glutathione S-transferase 3 MPO 13.98 A 10.65 A 19.00 A 0.001465 0.00001 0.000002 Myeloperoxidase MPV17 1.96 B 7.66 2.69 0.1 10412 0.000008 0.000452 MpV17 mitochondrial inner membrane protein MSRA 153.76 A 199.06 A 332.55 A 0.002594 0 0.000004 Methionine sulfoxide reductase A MT3 5.06 14.01 10.58 0.008775 0 0 Metallothionein 3 MTL5 5.44 A 8.80 A 5.48 0.003815 0 0.000235 Metallothionein-like 5, testis-specific (tesmin) NCF1 1.52 3.08 1.55 0.021764 0.000091 0.002019 Neutrophil cytosolic factor 1 NCF2 19.01 A 35.69 A 22.58 A 0.002443 0.000002 0.000055 Neutrophil cytosolic factor 2 NME5 4.08 4.87 4.97 0.00193 0.00003 0.00007 Non-metastatic cells 5, protein expressed in (nucleoside-diphosphate kinase) NOS2 1.31 1.30 1.22 0.19083 0.00959 0.03356 Nitric oxide synthase 2, inducible NOX5 3.04 A 4.91 A 4.97 A 0.01021 0.00001 0.00000 NADPH oxidase, EF-hand calcium binding domain 5 NUDT1 12.39 A 15.83 A 15.88 A 0.00175 0.00000 0.00000 Nudix (nucleoside diphosphate linked moiety X)-type motif 1 OXR1 208.45 A 175.64 A 290.40 A 0.00177 0.00000 0.00000 Oxidation resistance 1 OXSR1 43.45 A 5.49 2.88 0.00233 0.00030 0.00001 Oxidative-stress responsive 1 PDLIM1 1.46 1.17 1.61 0,02587 0.1341 1 0.00386 PDZ and LIM domain 1 IPCEF1 1.16 1.10 1.07 0.33359 0.00689 0.08616 Interaction protein for cytohesin exchange factors 1 PNKP 9.07 A 14.59 A 9.21 0.00131 0.00000 0.00002 Polynucleotide kinase 3 ’ -phosphatase PRDX1 3.07 9.15 2.95 0.01417 0.00001 0.00025 Peroxiredoxin 1 PRDX2 2.83 A 3.89 A 3.15 A 0.00774 0.00001 0.00000 Peroxiredoxin 2 PRDX3 5.56 10.30 A 7.88 0.00323 0.00000 0.00010 Peroxiredoxin 3 PRDX4 12.91 A 23.91 A 16.93 A 0.00285 0.00001 0.00000 Peroxiredoxin 4 PRDX5 − 1.10 1.17 − 1.50 0.58461 0.1 1277 0.00703 Peroxiredoxin 5 PRDX6 8.42 A 18.66 A 13.66 0.00130 0.00039 0.00013 Peroxiredoxin 6 PREX1 1 1.07 A 28.36 A 1 1.36 A 0.00280 0.00007 0.00005 Phosphatidylinositol-3,4,5-trisphosphate-dependent Rac exchange factor 1
T able 2 (continued) Up – down regulation (comparing to control group) S ta g es I an d II Stage III Stage IV p value (comparing to control group) Fold regulation Comments Fold regulation Comments Fold regulation Comments Group 1 Group 2 Group 3 Gene name PRG3 1.95 B 4.1 1 1.85 0.06409 0.00017 0.00936 Proteoglycan 3 PRNP − 1.10 − 1.30 − 1.20 0.55793 0.01056 0.01490 Prion protein PTGS1 2.37 2.47 B 1.29 B 0.02002 0.13761 0. 22171 Prostaglandin-endoperoxide synthase 1 (prostaglandin G/H synthase and cyclooxygenase) PTGS2 3.24 5.13 2.31 B 0.00584 0.00059 0.05500 Prostaglandin-endoperoxide synthase 2 (prostaglandin G/H synthase and cyclooxygenase) PXDN − 1.09 1.37 1.24 0.60194 0.00243 0.00023 Peroxidasin homolog (Drosophila) PXDNL 4.34 8.48 2.82 0.01486 0.00003 0.,00244 Peroxidasin homolog (Drosophila)-like RNF7 3.66 A 6.31 A 3.29 A 0.01086 0.00001 0.00001 Ring finger protein 7 SCARA3 6.26 42.02 A 9.71 0.00322 0.0001 1 0.01597 Scavenger receptor class A, member 3 SELS 5.74 A 7.47 A 4.95 A 0.00530 0.00003 0.0001 1 Selenoprotein S SEPP1 7.90 16.38 9.98 0.00099 0.00012 0.00165 Selenoprotein P, plasma, 1 SFTPD 5.26 A 9.13 A 5.53 0.00230 0.00033 0.00031 Surfactant protein D SGK2 9.52 9.52 9.41 0.00218 0.00019 0.00000 Serum/glucocorticoid regulated kinase 2 SIR T2 − 2.40 − 2.88 − 2.96 0.00060 0.00000 0.00000 Sirtuin (silent mating type information regulation 2 homolog) 2 (S. cerevisiae) SOD1 8.26 A 9.71 A 8.81 A 0.00572 0.00000 0.00000 Superoxide dismutase 1, soluble SOD2 1.25 1.71 − 1.06 0.28408 0.00787 0.62557 Superoxide dismutase 2, mitochondrial SOD3 77.56 A 18.80 A 2.14 0.00274 0.00000 0.00138 Superoxide dismutase 3, extracellular SRXN1 4.76 4.13 2.1 1 0.00401 0.00001 0.00016 Sulfiredoxin 1 homolog (S. cerevisiae) STK25 − 1.09 − 1.78 − 1.89 0.70550 0.00239 0.00272 Serine/threonine kinase 25 (STE20 homolog, yeast) TPO 7.72 21.16 A 1 1.94 0.00761 0.00001 0.00001 Thyroid peroxidase TTN 1.19 1.16 − 1.53 0.291 19 0.01 195 0.00120 T itin TXNDC2 3.66 6.74 4.38 0.00080 0.00001 0.00201 Thioredoxin domain containing 2 (spermatozoa) TXNRD1 16.92 A 25.34 A 21.14 A 0.00482 0.00000 0.00000 Thioredoxin reductase 1 TXNRD2 4.55 10.94 5.15 0.00617 0.00005 0.00004 Thioredoxin reductase 2 GAPDH gene was used as a ubiquitous control, and the level of gene transcription in normal tissues was the calibrator for relative quantification. Fol d change (2 − ΔΔ Ct ) is the normalized gene expression (2 − ΔΔ Ct ) in the test Sample divided by the normalized gene expression (2 − Δ Ct ) in the control sample. Fold regulation represents fold-change results in a biologically meaningful way . Fold-change values > 1 indicate a positive or upregulation, and the fold regulation is equal to the fold change. Fold-change values < 1 indicate a negat ive or downregulation, and the fold regulation is the negative inverse of the fold change. The p values are calculated based on a Student ’ s t test of the replicate 2 − Δ Ct values for each gene in the control group and treatment groups A the gene expression is relatively low in one sample (Ct > 30) and reasonably detected in the other sample (Ct < 30), suggesting that the actual fold-chan ge value is at least as lar ge as the calculated fold-change result; B the gene average threshold cycle is relatively high (> 30), meaning that its relative expression level is low , in both control and test samples, and the p value for the fold change is either unavailable or relatively high ( p > 0.05)
Int J Colorectal Dis
some extent the expression of this lipocalin while the cells are undergoing cell division. However, HT-29 cells do in-deed express ApoD, and they retain the ability to overex-press this protein in response to escalating OS. We have previously shown in PQ-challenged astrocyte primary cul-tures that the concentration of ApoD is critical for its pro-tective effect [16]. An excess of ApoD appears to be detrimental for cell survival, a result also supported by the fact that ApoD gene transcription is transient in response to OS [13,16].
Our data show that the situation in the colorectal tissue would in fact be more complex. Stromal cells would silence ApoD expression, perhaps by methylating the ApoD gene, while cancer cells could still express ApoD when they are not dividing (Fig. 6). The general decrease in ApoD protein expression in the malignant tissue is accompanied by in-creased numbers of cells expressing ApoD in the dysplastic epithelium. When tumor growth progresses OS builds up in
the tissue, cells that induce ApoD expression account at least in part for the recovery of expression after the initial down-regulation at early stages (Fig.2). This effect might be a key factor determining the final levels of ApoD in the tissue, which might favor apoptosis of tumor cells and therefore could influence the final patient survival outcome [30].
Another apolipoprotein, ApoL6, is located in a chromo-somal region recently found to be one of the genomic hotspots clinically associated to tumor aggressiveness [51]. Curiously, this apolipoprotein has also been demonstrated to be a proapoptotic factor [52].
Since no loss-of-function mutation in ApoD has been associated to cancer so far, ApoD cannot be classified as a classical tumor suppressor gene. However, our results strongly support that ApoD is one of the genes that respond to the anomalous physiology occurring in the cancer microenviron-ment. ApoD might be a beneficial protein for CRC not by controlling the proliferative state of malignant cells, but by
Fig. 6 Cell proliferation and apoptotic death levels of HT-29 CRC
cells in relation to ApoD expression and OS levels.aQuantitative RT-PCR expression of ApoD in HT-29 CRC cultures subjected to oxida-tive stress (PQ), demethylation (DAC), or both treatments, represented with respect to control conditions (calibrator sample). Statistical differ-ences were assayed by Mann–Whitney Utest; *p<0.05.b Immuno-fluorescent pictures showing endogenous ApoD expression (white
arrows) only by cells that have not entered the cell cycle.c, dCell
proliferation (c) and apoptotic cell death (d) analyses under different conditions of serum concentration, demethylating treatment (DAC), experimental oxidative stress (PQ), and/or addition of exogenous ApoD. Representative immunofluorescence pictures for each assay are shown on theright
promoting their death in the pro-oxidant environment of the tumor. In this context, ApoD could be used as an exogenous tool to promote the death of proliferating tumor cells when they are simultaneously suffering oxidative stress.
Acknowledgments We thank Drs. J. Herreros and B. Velayos for
their help in patient recruitment and sample collection. We thank M. Ruiz, N. García, M. del Caño, and A. Pérez for their helpful discus-sions. We thank Dr. A.S. Peña for his insight and comments on the manuscript.
Grant support This work has been supported by grants to M.D.G.
and D.S. (Ministerio de Educación y Ciencia (MEC), Spain, grant BFU2005-00522; Junta de Castilla y León (JCyL), grant VA049A05; and Ministerio de Ciencia e Innovación (MICINN), grant BFU2008-01170); and to R.B. (JCyL, GRS/278/A/08).
Disclosure of potential conflicts of interest Authors declare no
conflict of interest exists in relation to the content of this manuscript. Neither the author’s institutions nor the funding agencies had a role in the study design, data collection and analysis, decision to publish, or preparation of the manuscript.
References
1. Benson AB 3rd (2007) New approaches to assessing and treating early-stage colon and rectal cancers: cooperative group strategies for assessing optimal approaches in early-stage disease. Clin Cancer Res 13(22 Pt 2):6913s–6920s. doi:10.1158/1078-0432.CCR-07-1188
2. Kraus S, Arber N (2009) Inflammation and colorectal cancer. Curr Opin Pharmacol 9(4):405–410. doi:10.1016/j.coph.2009.06.006 3. Olinski R, Jaruga P, Zastawny TH (1998) Oxidative DNA base
modifications as factors in carcinogenesis. Acta Biochim Pol 45 (2):561–572
4. Ohshima H, Tatemichi M, Sawa T (2003) Chemical basis of inflammation-induced carcinogenesis. Arch Biochem Biophys 417(1):3–11. doi:S0003986103002832
5. Itzkowitz SH, Yio X (2004) Inflammation and cancer IV Colorectal cancer in inflammatory bowel disease: the role of inflammation. Am J Physiol Gastrointest Liver Physiol 287(1): G7–G17. doi:10.1152/ajpgi.00079.2004
6. Bartsch H, Nair J (2002) Potential role of lipid peroxidation derived DNA damage in human colon carcinogenesis: studies on exocyclic base adducts as stable oxidative stress markers. Cancer Detect Prev 26(4):308–312
7. Schmid K, Nair J, Winde G, Velic I, Bartsch H (2000) Increased levels of promutagenic etheno-DNA adducts in colonic polyps of FAP patients. Int J Cancer 87(1):1–4. doi:10.1002/1097-0215 8. Zanetti D, Poli G, Vizio B, Zingaro B, Chiarpotto E, Biasi F (2003)
4-Hydroxynonenal and transforming growth factor-beta1 expres-sion in colon cancer. Mol Aspects Med 24(4–5):273–280. doi: S0098299703000220
9. Do Carmo S, Levros LC Jr, Rassart E (2007) Modulation of apolipoprotein D expression and translocation under specific stress conditions. Biochim Biophys Acta 1773(6):954–969. doi:10.1016/ j.bbamcr.2007.03.007
10. Sarjeant JM, Lawrie A, Kinnear C, Yablonsky S, Leung W, Massaeli H, Prichett W, Veinot JP, Rassart E, Rabinovitch M (2003) Apolipoprotein D inhibits platelet-derived growth factor-BB-induced vascular smooth muscle cell proliferated by preventing
translocation of phosphorylated extracellular signal regulated kinase 1/2 to the nucleus. Arterioscler Thromb Vasc Biol 23(12):2172– 2177. doi:10.1161/01.ATV.0000100404.05459.39
11. Sasaki Y, Negishi H, Koyama R, Anbo N, Ohori K, Idogawa M, Mita H, Toyota M, Imai K, Shinomura Y, Tokino T (2009) p53 family members regulate the expression of the apolipoprotein D gene. J Biol Chem 284(2):872–883. doi:10.1074/jbc.M807185200 12. Van Dijk W, Do Carmo S, Rassart E, Dalhlback B, Sodetz J (2006) The plasma Lipocalins a1-acid glycoprotein, apolipoprotein D, apolipoprotein M and complement C8g. In: Akerstrom B, Borregaard N, Flower D, Salier J (eds) Lipocalins. Landes biosci-ence, Georgetown, pp 140–166
13. Ganfornina MD, Do Carmo S, Lora JM, Torres-Schumann S, Vogel M, Allhorn M, González C, Bastiani MJ, Rassart E, Sanchez D (2008) Apolipoprotein D is involved in the mechanisms regulating protection from oxidative stress. Aging Cell 7(4):506–515 14. Hull-Thompson J, Muffat J, Sanchez D, Walker DW, Benzer S,
Ganfornina MD, Jasper H (2009) Control of metabolic homeosta-sis by stress signaling is mediated by the lipocalin NLaz. PLoS Genet 5(4):e1000460
15. Sanchez D, Lopez-Arias B, Torroja L, Canal I, Wang X, Bastiani MJ, Ganfornina MD, Walker DW, Muffat J, Rundel C, Benzer S (2006) Loss of glial lazarillo, a homolog of apolipoprotein D, reduces lifespan and stress resistance inDrosophila. Curr Biol 16 (7):680–686
16. Bajo-Graneras R, Ganfornina MD, Martin-Tejedor E, Sanchez D (2011) Apolipoprotein D mediates autocrine protection of astro-cytes and controls their reactivity level, contributing to the func-tional maintenance of paraquat-challenged dopaminergic systems. Glia 59(10):1551–1566. doi:10.1002/glia.21200
17. Bajo-Graneras R, Sanchez D, Gutierrez G, Gonzalez C, Do Carmo S, Rassart E, Ganfornina MD (2011) Apolipoprotein D alters the early transcriptional response to oxidative stress in the adult cerebellum. J Neurochem 117(6):949–960. doi:10.1111/j.1471-4159.2011.07266.x 18. Livak KJ, Schmittgen TD (2001) Analysis of relative gene
expres-sion data using real-time quantitative PCR and the 2(−delta delta C (T)) method. Methods 25(4):402–408. doi:10.1006/meth.2001.1262 19. Hagemann S, Heil O, Lyko F, Brueckner B Azacytidine and decitabine induce gene-specific and non-random DNA demethy-lation in human cancer cell lines. PLoS One 6(3):e17388. doi:10.1371/journal.pone.0017388
20. Sole X, Guino E, Valls J, Iniesta R, Moreno V (2006) SNPStats: a web tool for the analysis of association studies. Bioinformatics 22 (15):1928–1929. doi:10.1093/bioinformatics/btl268
21. Farias IL, Farias JG, Rossato L, Araujo MC, Chiesa J, Morsh V, Schetinger MR (2011) Correlation between TBARS levels and glycolytic enzymes: the importance to the initial evaluation of clinical outcome of colorectal cancer patients. Biomed Pharmacother 65(6):395–400. doi:10.1016/j.biopha.2011.04.026 22. Diez-Itza I, Vizoso F, Merino AM, Sanchez LM, Tolivia J,
Fernandez J, Ruibal A, Lopez-Otin C (1994) Expression and prognostic significance of apolipoprotein D in breast cancer. Am J Pathol 144(2):310–320
23. Vazquez J, Gonzalez L, Merino A, Vizoso F (2000) Expression and clinical significance of apolipoprotein D in epithelial ovarian carci-nomas. Gynecol Oncol 76(3):340–347. doi:10.1006/gyno.1999.5678 24. Rodriguez JC, Diaz M, Gonzalez LO, Sanchez J, Sanchez MT, Merino AM, Vizoso F (2000) Apolipoprotein D expression in benign and malignant prostate tissues. Int J Surg Investig 2(4):319–326 25. Utsunomiya T, Ogawa K, Yoshinaga K, Ohta M, Yamashita K,
Mimori K, Inoue H, Ezaki T, Yoshikawa Y, Mori M (2005) Clinicopathologic and prognostic values of apolipoprotein D alter-ations in hepatocellular carcinoma. Int J Cancer 116(1):105–109. doi:10.1002/ijc.20986
26. Vizoso FJ, Rodriguez M, Altadill A, Gonzalez-Dieguez ML, Linares A, Gonzalez LO, Junquera S, Fresno-Forcelledo F, Corte Int J Colorectal Dis
MD, Rodrigo L (2007) Liver expression of steroid hormones and apolipoprotein D receptors in hepatocellular carcinoma. World J Gastroenterol 13(23):3221–3227
27. Hunter S, Weiss S, Ou CY, Jaye D, Young A, Wilcox J, Arbiser JL, M o ns o n D , G o l db l um J , N ol e n J D , Var m a V ( 20 0 5 ) Apolipoprotein D is down-regulated during malignant transforma-tion of neurofibromas. Hum Pathol 36(9):987–993. doi:10.1016/ j.humpath.2005.06.018
28. Hunter S, Young A, Olson J, Brat DJ, Bowers G, Wilcox JN, Jaye D, Mendrinos S, Neish A (2002) Differential expression between pilocytic and anaplastic astrocytomas: identification of apolipopro-tein D as a marker for low-grade, non-infiltrating primary CNS neoplasms. J Neuropathol Exp Neurol 61(3):275–281
29. Yamashita K, Upadhyay S, Osada M, Hoque MO, Xiao Y, Mori M, Sato F, Meltzer SJ, Sidransky D (2002) Pharmacologic unmasking of epigenetically silenced tumor suppressor genes in esophageal squamous cell carcinoma. Cancer Cell 2(6):485–495. doi: S1535610802002155
30. Ogawa K, Utsunomiya T, Mimori K, Yamashita K, Okamoto M, Tanaka F, Inoue H, Ikeda Y, Saku M, Murayama S, Mori M (2005) Genomic screens for genes upregulated by demethylation in colo-rectal cancer: possible usefulness for clinical application. Int J Oncol 27(2):417–426
31. Smith LC, Voyta JC, Catapano AL, Kinnunen PK, Gotto AM Jr, Sparrow JT (1980) Activation of lipoprotein lipase by synthetic fragments of apolipoprotein C-II. Ann N Y Acad Sci 348:213–223 32. Spreyer P, Schaal H, Kuhn G, Rothe T, Unterbeck A, Olek K, Muller HW (1990) Regeneration-associated high level expression of apolipoprotein D mRNA in endoneurial fibroblasts of peripheral nerve. EMBO J 9(8):2479–2484
33. Chen Y, Jia L, Wei C, Wang F, Lv H, Jia J (2008) Association between polymorphisms in the apolipoprotein D gene and sporadic Alzheimer’s disease. Brain Res 1233:196–202. doi:10.1016/ j.brainres.2008.07.018
34. Hansen T, Hemmingsen RP, Wang AG, Olsen L, Timm S, Soeby K, Jakobsen KD, Fenger M, Parnas J, Rasmussen HB, Werge T (2006) Apolipoprotein D is associated with long-term outcome in patients with schizophrenia. Pharmacogenomics J 6(2):120–125. doi:10.1038/sj.tpj.6500350
35. Helisalmi S, Hiltunen M, Vepsalainen S, Iivonen S, Corder EH, Lehtovirta M, Mannermaa A, Koivisto AM, Soininen H (2004) Genetic variation in apolipoprotein D and Alzheimer’s disease. J Neurol 251(8):951–957. doi:10.1007/s00415-004-0470-8 36. Jones PA, Baylin SB (2007) The epigenomics of cancer. Cell 128
(4):683–692. doi:10.1016/j.cell.2007.01.029
37. van den Boom J, Wolter M, Blaschke B, Knobbe CB, Reifenberger G (2006) Identification of novel genes associated with astrocytoma progression using suppression subtractive hybridization and real-time reverse transcription-polymerase chain reaction. Int J Cancer 119(10):2330–2338. doi:10.1002/ijc.22108
38. Provost PR, Marcel YL, Milne RW, Weech PK, Rassart E (1991) Apolipoprotein D transcription occurs specifically in nonprolifer-ating quiescent and senescent fibroblast cultures. FEBS Lett 290 (1–2):139–141. doi:0014-5793(91)81244-3
39. Hendrickse CW, Kelly RW, Radley S, Donovan IA, Keighley MR, Neoptolemos JP (1994) Lipid peroxidation and prostaglandins in colorectal cancer. Br J Surg 81(8):1219–1223
40. Ozdemirler G, Pabuccuoglu H, Bulut T, Bugra D, Uysal M, Toker G (1998) Increased lipoperoxide levels and antioxidant system in colorectal cancer. J Cancer Res Clin Oncol 124(10):555–559 41. Skrzydlewska E, Sulkowski S, Koda M, Zalewski B,
Kanczuga-Koda L, Sulkowska M (2005) Lipid peroxidation and antioxidant status in colorectal cancer. World J Gastroenterol 11(3):403–406 42. Nikoulina SE, Andon NL, McCowen KM, Hendricks MD, Lowe
C, Taylor SW (2010) A primary colonic crypt model enriched in enteroendocrine cells facilitates a peptidomic survey of regulated hormone secretion. Mol Cell Proteomics 9(4):728–741. doi:10.1074/mcp.M900529-MCP200
43. Khan WI, Ghia JE (2010) Gut hormones: emerging role in immune activation and inflammation. Clin Exp Immunol 161(1):19–27. doi:10.1111/j.1365-2249.2010.04150.x
44. Do Carmo S, Jacomy H, Talbot PJ, Rassart E (2008) Neuroprotective effect of apolipoprotein D against human coro-navirus OC43-induced encephalitis in mice. J Neurosci 28 (41):10330–10338. doi:10.1523/JNEUROSCI.2644-08.2008 45. Ganfornina MD, Do Carmo S, Martinez E, Tolivia J, Navarro A,
Rassart E, Sanchez D (2010) ApoD, a glia-derived apolipoprotein, is required for peripheral nerve functional integrity and a timely re-sponse to injury. Glia 58(11):1320–1334. doi:10.1002/glia.21010 46. Janssen AM, Bosman CB, Sier CF, Griffioen G, Kubben FJ,
Lamers CB, van Krieken JH, van de Velde CJ, Verspaget HW (1998) Superoxide dismutases in relation to the overall survival of colorectal cancer patients. Br J Cancer 78(8):1051–1057 47. Shi H, Hood KA, Hayes MT, Stubbs RS (2011) Proteomic analysis
of advanced colorectal cancer by laser capture microdissection and two-dimensional difference gel electrophoresis. J Proteomics 75 (2):339–351. doi:10.1016/j.jprot.2011.07.025
48. Kosacka J, Schroder T, Bechmann I, Kloting N, Nowicki M, Mittag A, Gericke M, Spanel-Borowski K, Bluher M (2011) PACAP up-regulates the expression of apolipoprotein D in 3 T3-L1 adipocytes. DRG/3 T3-T3-L1 co-cultures study. Neurosci Res 69 (1):8–16. doi:10.1016/j.neures.2010.09.009
49. Chan SK, Griffith OL, Tai IT, Jones SJ (2008) Meta-analysis of colorectal cancer gene expression profiling studies identifies consis-tently reported candidate biomarkers. Cancer Epidemiol Biomarkers Prev 17(3):543–552. doi:10.1158/1055-9965.EPI-07-2615 50. LaPointe LC, Pedersen SK, Dunne R, Brown GS, Pimlott L, Gaur
S, McEvoy A, Thomas M, Wattchow D, Molloy PL, Young GP (2012) Discovery and validation of molecular biomarkers for co-lorectal adenomas and cancer with application to blood testing. PLoS One 7(1):e29059. doi:10.1371/journal.pone.0029059 51. The Cancer Genome Atlas Network (2012) Comprehensive
mo-lecular characterization of human colon and rectal cancer. Nature 487(7407):330–337
52. Liu Z, Lu H, Jiang Z, Pastuszyn A, C-aA H (2005) Apolipoprotein L6, a novel proapoptotic Bcl-2 homology 3—only protein, induces mitochondria-mediated apoptosis in cancer cells. Molecular Cancer Research 3(1):21–31