Essays on Overeducation: Evidence from Spain
130
0
0
Texto completo
(2) PhD in Economics. PhD in Economics. Sandra Nieto Viramontes. Essays on Overeducation: Evidence from Spain Sandra Nieto Viramontes.
(3) PhD in Economics Thesis title:. Essays on Overeducation: Evidence from Spain PhD student:. Sandra Nieto Viramontes Advisor:. Raúl Ramos Lobo Date: July 2014.
(4)
(5) A mis padres y a mis hermanos. iii.
(6) iv.
(7) Acknowledgements First and foremost, I would like to express my most heartfelt gratitude to my supervisor Raúl Ramos. I really appreciate his guidance, support and dedication all the time. I owe this thesis and everything that derives from it to him. Moltes gràcies Raul! I would like to thank the Department of Econometrics, Statistics and Spanish Economy for its logistic support and the Catalan and the Spanish Government for the financial support. Additionally, I would like to thank Jordi Roca, from UB-Economics, for his patience and help. I want to express my gratitude to the AQR Research Group and its director Enrique López-Bazo for the support and encouragement during the last months of writing the thesis. I am also grateful to Jordi Suriñach for introducing me into the AQR and showing me the existence of research. I would also like thank Dr Joop Hartog for his valuable comments during my stay at the University of Amsterdam. I am also very grateful to Dr Hessel Oosterbeek. It has been a pleasure for me to meet all of you. During all this time, I have had the opportunity to know some researchers and, above all, wonderful people. In particular, I am grateful to Elisabet Motellón, Luis Díaz and Inés Murillo for their generosity, confidence and support. Furthermore, I would like to thank all my colleagues at the University, with whom I have shared a lot of experiences. In particular, I thank Ernest Miguélez for his great company and the time we spent at the office. It was always funny and enjoyable. I would also like to mention that I am very thankful to Esther Goya, Aïda Solé and Elena Costas for their friendship, support and the advice I received from them. I would also like to thank all my friends for their understanding that I could not always be around as I had to work on my thesis.. v.
(8) Finally, I am extremely grateful to my family, especially to my parents, who have sacrificed their lives to create so many opportunities for their children. They taught me to work hard, to be strong and grateful and never lose the smile.. vi.
(9) Contents List of Tables ................................................................................................................ ix List of Figures ............................................................................................................... x Chapter 1: Introduction............................................................................................ 1 1.1. Background and motivation ............................................................................ 1 1.2. Measurement of educational mismatch ........................................................ 2 1.3. The impact of overeducation .......................................................................... 4 1.4. Theoretical background ................................................................................... 5 1.5. Three empirical studies on overeducation .................................................... 7 References................................................................................................................ 10 Chapter 2: Non-formal education, overeducation and wages ................... 15 2.1. Introduction ..................................................................................................... 15 2.2. Database and variables ................................................................................... 19 2.2.1. The Spanish sample of the 2007 Adult Education Survey ......................... 19 2.2.2. Measurement of educational mismatch ......................................................... 22. 2.3. Descriptive analysis ........................................................................................ 25 2.4. Methodology and results ............................................................................... 28 2.5. Results ............................................................................................................... 30 2.5.1. Sample selection bias ........................................................................................ 30 2.5.2. Wage models ...................................................................................................... 32 2.5.3. Robustness check .............................................................................................. 37. 2.6. Conclusions...................................................................................................... 37 References................................................................................................................ 38 Annex chapter 2 ..................................................................................................... 42 Chapter 3: Overeducation, skills and wage penalty ...................................... 45 3.1. Introduction ..................................................................................................... 45 3.2. Literature review ............................................................................................. 47 3.3. Data sources and variable definition ........................................................... 50. vii.
(10) 3.3.1. PIAAC database ................................................................................................ 50 3.3.2. Measuring educational and skill mismatches ................................................ 52. 3.4. Are overeducated workers also overskilled?............................................... 54 3.5. Educational mismatch, skills and wages ..................................................... 56 3.5.1. Empirical models .............................................................................................. 56 3.5.2. Results ................................................................................................................. 59 3.5.3. Robustness checks ............................................................................................ 63. 3.6. Final remarks ................................................................................................... 63 References................................................................................................................ 64 Annex chapter 3 ..................................................................................................... 68 Chapter 4: Is there a link between parents’ overeducation and children’s educational achievement? ............................................................... 73 4.1. Introduction ..................................................................................................... 73 4.2. Literature Review ............................................................................................ 76 4.3. Database and variables ................................................................................... 78 4.3.1. PISA database .................................................................................................... 78 4.3.2. Variables and final sample ............................................................................... 80 4.3.3. Measuring educational mismatch.................................................................... 81. 4.4. Descriptive analysis ........................................................................................ 83 4.5. Methodology and results ............................................................................... 87 4.5.1. Methodology ...................................................................................................... 87 4.5.2. Results ................................................................................................................. 88 4.5.3. Robustness checks ............................................................................................ 91. 4.6. Conclusions...................................................................................................... 99 References.............................................................................................................. 100 Annex chapter 4 ................................................................................................... 105 Chapter 5: Concluding remarks ........................................................................ 113 References.............................................................................................................. 117. viii.
(11) List of Tables Table 2.1. Educational mismatch in 2006 and 2007 (in percentages) ................ 23 Table 2.2. Survey of research on educational mismatch in Spain ...................... 24 Table 2.3. Evolution of the educational mismatch from 2006 to 2007 ............ 26 Table 2.4. Percentage of workers who have undertaken NFE activities in the last 12 months ...................................................................................................... 27 Table 2.5. Determinants of the probability of being in work ............................. 31 Table 2.6. OLS estimates of the Mincer wage equations ..................................... 33 Table 2.7. OLS estimates of the ORU wage equations ........................................ 35 Table A2.1. Equivalent level of studies and schooling years .............................. 42 Table A2.2. Descriptive statistics ............................................................................. 43 Table A2.3. OLS estimates of the ORU wage equations using the statistical method (mean) ............................................................................................................ 44 Table 3.1. Educational mismatch ............................................................................. 53 Table 3.2. Distribution of undereducated, well-matched and overeducated workers by their skill (mis)match in literacy (in %) .............................................. 55 Table A3.1. Descriptive statistics ............................................................................. 68 Table A3.2. Educational mismatch using the statistical method ........................ 68 Table A3.3. Determinants of being employed....................................................... 69 Table A3.4. Estimated earnings ORU functions measuring educational mismatch by means of the statistical method (mode and mean) ....................... 70 Table A3.5. Estimated earnings ORU functions using numeracy skills ............ 71 Table 4.1. Parents’ educational mismatch (in percentages) ................................. 82 Table 4.2. OLS estimation of the EPF in Mathematics ....................................... 92 Table 4.3. OLS estimation of the EPF in Sciences ............................................... 94 Table 4.4. OLS estimation of the EPF in Reading ............................................... 96. ix.
(12) Table A4.1. Descriptive statistics ........................................................................... 105 Table A4.2. OLS estimation of the EPF in Mathematics using mean method ....................................................................................................................... 106 Table A4.3. OLS estimation of the EPF in Sciences using mean method ..... 108 Table A4.4. OLS estimation of the EPF in Reading using mean method ...... 110 Table A4.5. OLS estimation of the EPF .............................................................. 112. List of Figures Figure 2.1. Annual average growth in 25-64 year-old population between 1998 and 2006 ............................................................................................................. 17 Figure 3.1. Average skills levels of workers by educational level. ...................... 56 Figure 4.1. Students’ educational outcomes distribution in Mathematics according to parents’ educational mismatch .......................................................... 84 Figure 4.2. Students’ educational outcomes distribution in Science according to parents’ educational mismatch .......................................................... 85 Figure 4.3. Students’ educational outcomes in Reading according to parents’ educational mismatch................................................................................................. 86. x.
(13) Chapter 1. Introduction. Chapter 1: Introduction. 1.1. Background and motivation Investment in human capital is a key tool for the social and economic progress in every country. Thus one of the most important public policies in the last century has focused on increasing the level and quality of education among the population. This goal has been reached by all developed countries. However, the rapid increase of the percentage of the population with high education in developed economies during the last decades has probably contributed to labour market inefficiency. It is observed that part of this population is not working in jobs that require their level of education; otherwise they end up in jobs that require workers with a lower level of education. This situation is called overeducation. The concept of overeducation was introduced by Richard Freeman in his book The Overeducated American, which was published in 1976 (Freeman, 1976). From a macroeconomic point of view, he argued that the apparent declination of the income returns from high education since 1970 in the U.S. could be explained by an excess of supply of high-educated workers. Years later, Duncan and Hoffman (1981) made an important contribution analysing overeducation at an individual level by comparing workers whose level of attained education matches with that required by their jobs with workers who have more (and less) attained education. After that, the analysis was extended for several developed but also developing countries.. 1.
(14) Chapter 1. Introduction. Nowadays, there are several contributions that focus on analysing the incidence of overeducation, its determinants and its consequences for workers who are suffering from it. Quantifying the incidence of overeducation is indeed crucial to understanding the importance of its negative consequences and to design public policies to reduce the overeducation weight on countries. This thesis focuses on Spain, because it is a developed country supporting one of the largest percentages of overeducated workers (OECD, 2013), a feature that was also observed before the current economic crisis (OECD, 2009; and Verhaest and van der Velden, 2013). Spain is a country that was characterised by having a population with lower educational levels among the OECD countries in the 1960s and 1970s (Mas et al., 1995), and it has increased the percentage of its population with high education to the average of the OECD countries over three decades. However, the productive structure of the country is not comprised of mostly high-technology companies. This situation may point out an imbalance between the supply of and demand for highskilled workers in the Spanish labour market. However, it has recently born a debate related to the skills and ability of workers in the country given that Spain is always at the bottom of the rankings that measure children’s knowledge (PISA data) and adults’ skills (PIAAC data). In this sense, overeducation may be a consequence of a lack of skills of workers, and policy implications should be targeted towards improving higher education institutions, i.e., universities. The rest of this chapter is divided into four sections. Section 1.2 describes the different existing methods to measure overeducation. Section 1.3 summarises the most relevant findings of the consequences of overeducation on workers. Then, section 1.4 includes a short overview of the most supported theories to explain overeducation phenomena. Lastly, section 1.5 presents a summary of the three empirical analyses of the dissertation.. 1.2. Measurement of educational mismatch The most common way to approximate the concept of educational mismatch involves comparing the level of a worker’s attained education with the level. 2.
(15) Chapter 1. Introduction. required by the worker’s job. From this perspective, workers are overeducated (undereducated) if their level of education is higher (lower) than the level of education required by their jobs. Literature on educational mismatch has proposed (at least) three different methods for measuring years of required education (see Hartog, 2000; and McGuinness, 2006 for a review): the objective or job analysis, the subjective or worker self-assessment (both direct and indirect) and the statistical or realised matches (in terms of the mean and the mode). In particular, the objective method is based on the opinion of expert analysts who determine what level of education workers should have in order to perform a certain job. A person is then overeducated (undereducated) if his/her level of education is higher (lower) than the level the analysts determine to be ideal for the occupation. The subjective or self-assessment method relies on questions that ask workers about the schooling requirements of their job. Educational mismatch is determined by comparing workers’ answers about required education and attained education. Workers are properly or well-matched when their attained education matches with their jobs’ required education. Conversely, overeducated (undereducated) workers have more (less) attained education than required by their jobs. Lastly, the statistical method based on the mean (Verdugo and Verdugo, 1989) considers that a person is overeducated (undereducated) if he/she has a level of education that is higher (lower) by more than one standard deviation than the mean level of education of the workers in that occupation. Nevertheless, Kiker et al. (1997) propose the use of the mode instead of the mean; so they consider a person who has a higher (lower) level of education than the mode for the job they perform to be overeducated (undereducated). Unfortunately, at present there is no consensus as to which is the best method, because each has its advantages and disadvantages (Hartog, 2000). As a consequence, the use of one method or another usually depends on the nature of the data available.. 3.
(16) Chapter 1. Introduction. It is important to highlight that the main critique of educational mismatch literature comes from its measurement methods. It is found that the incidence of educational mismatch generally differs depending on the measurement method considered, although a specific database is used that refers to the same period of time and country. However, the effects of educational mismatch on different labour market outcomes, especially on wages, are quite robust regardless of the measurement method used (Hartog, 2000).. 1.3. The impact of overeducation Overeducation could have negative consequences on workers, firms and the economy as a whole. Most of the literature on overeducation focuses on its effects on individual wages. Following the wage model specified by Duncan and Hoffman (1981), it is found that overeducated workers earn less than properly educated workers with the same educational level, but more than their properly educated work colleagues (Hartog, 2000; Groot and Maassen van der Brink, 2000; Rubb, 2003a). On the other hand, undereducated workers earn more than properly educated workers with the same level of education, but less than their properly educated work colleagues1. Sattinger and Hartog (2013) provide a theoretical foundation for those empirical regularities based on Nash bargaining between workers and employers. Besides the wage penalty, overeducated workers have less job satisfaction (Verhaest and Omey, 2009; Korpi and Tåhlin, 2009), less life satisfaction (Piper, 2013) and more depression symptoms (Bracke, et al., 2013). They also have higher turnover rates (Alba-Ramirez, 1993; Sloane, et al., 1999; Quintini, Undereducation has not attracted the same attention of researchers, because undereducated workers do not have any incentives to leave a job that requires a higher level of education. Furthermore, firms could also have the benefit of hiring workers with an initial lack of education or knowledge if the cost of providing them specific job training is less than the benefit of giving them fewer wages than properly educated workers.. 1. 4.
(17) Chapter 1. Introduction. 2011), an adverse impact on productivity (Tsang et al. 1991) but they experience greater promotion within firms (Groeneveld and Hartog, 2004). On the other hand, firms run the risk of lower profits primarily because of lower overeducated worker effort (higher absenteeism, etc.) induced by low job satisfaction (Levin and Tsang, 1985). Belfield (2010) shows how overeducation rates across workplaces adversely influence workplace labor relations. From a macroeconomic point of view, overeducation could be considered a waste of resources in economic terms given that high education is highly subsidised by governments and that they obtain fewer economic returns of investment in education from populations that end up overeducated.. 1.4. Theoretical background Some theories related to the labour market have been considered to explain the incidence of the overeducation phenomenon and its impact on wages. The human capital theory considers that an individual’s particular level of human capital will provide a certain level of productivity, irrespective of the job in which that individual works (Becker, 1975). It suggests that individuals are paid the value of their marginal product. Thus if one adopts a strict interpretation of human capital theory, where markets are efficient, one would not observe overeducation in the labour market other than as a short-term dynamic problem (Dolton and Vignoles, 1998). However, this characterisation assumes that firms are able to fully utilise the skills and knowledge of their employees and can adapt their production technology in response to changes in the relative supply of skilled workers. However, empirical analysis does not support this theory given that wages of workers with the same level of education vary depending on their occupation match (Hartog and Oosterbeek, 1988; Hartog, 2000; Leuven and Oosterbeek, 2011). Another explanation consistent with the human capital theory is the career mobility theory (Sicherman and Galor, 1990). It considers overeducation as an. 5.
(18) Chapter 1. Introduction. investment opportunity. Sicherman and Galor (1990) defined a model that considers that a worker with a given level of education may prefer to start in a job below his or her educational level if this is compensated with a higher probability to be promoted. Under this point of view, overeducation is a transitory phenomenon explained by the worker’s lack of experience. Although the finding that overeducation is more prominent among younger workers is consistent with this theory, there is empirical evidence that the probability of a job mismatch does not significantly decrease with experience (Frei and Sousa-Poza, 2012; Rubb, 2003b). In this sense, Baert et. al (2013) also find that once a youth worker accept a job for which is overeducated, monthly transitions rates into adequate employment fall by 51-98%. On the other hand, job competition theory (Thurow, 1975) predicts that job characteristics are the only factor determining wages and qualifications are only important for the allocation of jobs. Individuals compete for job opportunities based on their relative training costs – i.e., their position in the hiring queue is determined by their cost in terms of training. This model assumes that qualifications serve as a proxy for training costs with the more highly qualified seen as more able and therefore requiring less training by the firm. Under this point of view, overeducation is a persistent phenomenon and that wages are fully dependant on required qualifications while returns to surplus qualifications are zero. Empirical studies do not support this theory given that the returns to surplus qualification are positive and statistically significant (Hartog and Oosterbeek, 1988; Hartog, 2000; Leuven and Oosterbeek, 2011). The assignment theory (Sattinger, 1993) is a model between human capital theory on the one hand and job competition on the other. It considers that workers’ productivity is limited by their workplace and in part by their human capital. The basic idea is that, although education raises productivity in general, working in a job below one’s own qualification level imposes a ceiling on a worker’s productivity because it limits the extent to which his or her skills can be utilised and results in lower wages. According to assignment theory, productivity is maximised when workers are allocated top-down according to their skills, whereby the most skilled are assigned to the most complex job and the least skilled to the simplest job. Overeducation is explained by differences. 6.
(19) Chapter 1. Introduction. in the share of complex jobs and skilled workers. Although it has been one of the most supported theories, different empirical analyses that have tried to test it do not support it (Allen and van der Velden, 2001; Di Pietro and Urwin, 2006; Green and McIntosh, 2007; Sánchez-Sánchez and McGuinness, 2013; Mavromaras et al. 2013). Finally, the heterogeneous skills theory (Green and McIntosh, 2007) considers that there is significant variability in terms of skills among individuals with the same level of education. Thus it is quite possible to find workers who appear to be overeducated, but their skills level may match more closely that of those with the appropriate level of education for the job they occupy. Accordingly, the reason why overeducated workers are found to earn less than their peers with the same level of education who work in jobs for which their qualifications are appropriate is because the former are either less able or have fewer skills. This theory seems to be the most supported by recent literature given that it is found that the effect of overeducation on wages reduces or even disappears when it is controlled for all unobserved individual fixed effects (Bauer, 2002; Frenette, 2004; Korpi and Tåhlin, 2009; Tsai, 2010).. 1.5. Three empirical studies on overeducation This section presents a summary of the three empirical analyses on overeducation in Spain and their contribution to the literature.. Chapter 2: “Non-formal education, overeducation and wages” Although there is an important incidence of overeducation, demand for skills is growing in most countries. In this sense, important efforts are being devoted to promote lifelong learning, since it permits both individuals and society to better adapt to changes in economic conditions. In spite of the fact that overeducated workers have more attained education than that required by their jobs, it is found that overeducated workers participate more in training activities in comparison with their adequately. 7.
(20) Chapter 1. Introduction. educated colleagues working at the same job level, but they get significantly less training in comparison with adequately educated individuals with the same level of education (Verhaest and Omey, 2006). The objective of this chapter is twofold. First, it will examine the effect of non-formal education activities on individual wages and test whether this effect is different depending on workers’ years of schooling. And, second, the chapter will analyse if the returns of the participation in these types of training activities is higher for overeducated workers than for the rest of workers. If it is so, overeducated workers could overcome part of the wage penalty derived from their education-occupation mismatch. The results show that non-formal education activities have a positive effect on wages, this effect being higher for those workers with higher education. Moreover, overeducated workers suffer a wage penalisation compared to well-educated workers with the same level of education. However, only overeducated workers who have undergone nonformal education activities receive a wage premium. It seems that this type of training seems to provide overeducated workers with new abilities that permit them to reduce the wage penalisation derived from the mismatch between their level of education and occupation. The contribution of this chapter is to show a way to modify the negative consequences of overeducation on wages. Overeducated workers are the ones that benefit from getting training, because it allows them to reduce the wage penalty associated with their overeducation.. Chapter 3: Overeducation, skills and wage penalty A supported theory on overeducation is based on the existence of individuals’ skill heterogeneity. From such a perspective, the wage penalty associated with overeducation is due to the huge variation of skills among workers with the same level of education. Then, overeducated workers would not suffer a wage penalty. In fact, they would earn lower wages as a result of their lower level of skills. However, most of the literature does not explicitly test this hypothesis due to data limitations regarding individuals’ skill levels.. 8.
(21) Chapter 1. Introduction. The specific aim of the chapter is to test the skill heterogeneity theory in Spain. Our hypothesis is that the wage penalty associated with overeducation could be explained by lower skill levels. In consequence, overeducated workers may not be suffering a wage penalty in Spain, but their earnings are determined by their skill level. Our results show that individuals’ skill heterogeneity only explains 18% of the effect of educational mismatch on wages in Spain. The wage penalty still remains for those overeducated workers who are not less skilled than properly matched workers. This chapter is a contribution to the literature of overeducation that takes into account workers’ individual skills using direct indicators of skill levels. In the case of Spain, workers’ skill heterogeneity explains little about the wage loss of overeducated workers.. Chapter 4: Is there a link between parents’ overeducation and the students’ educational achievement? As Haveman and Wolfe (1995) highlight, children of highly educated parents tend to perform better than children of less educated parents. One possible explanation for the positive relationship between parents’ human capital and students’ performance is based on children’s perceptions about the importance of education. In this sense, students whose parents have a high level of education and good jobs might be more aware of the value of education and, consequently, have higher motivation and perform better than other students. Under this point of view, our hypothesis is that the existence of parents’ jobeducation mismatch can modify the students’ perception about the importance of education and, consequently, have an effect on their performance at school. In particular, the objectives in this chapter are the following: first, we analyse whether there is a relationship between parents’ educational mismatch and the educational performance of their children. And, second, in case this relationship exists, we check whether it is similar across the performance. 9.
(22) Chapter 1. Introduction. distribution or, by contrast, whether there are differences between students at the top and at the bottom of the performance distribution. The results show a statistically significant relationship between parents’ educational mismatch and children’s educational performance after controlling for the effect of individual and school characteristics and other family-related variables. On the one hand, students whose parents are overeducated have a penalty in their academic achievement in all three subjects analysed, this effect being stronger for students with lower educational outcomes. On the other hand, undereducation only affects students’ educational achievement when it is suffered by the mother, this effect being positive. So, the results confirm our hypothesis, although they cannot prove that the students’ perception is the transmission channel, an aspect that is beyond the scope of the current research due to data limitations. This chapter makes a contribution by identifying a new collective that can be affected by the overeducation phenomenon. Whilst previous literature focuses on the effect of overeducation on workers, we identify that there could also be an impact of parents’ overeducation on the academic performance of their children.. References Alba-Ramirez, A. (1993) “Mismatch in the Spanish labor market: overeducation?” Journal of Human Resources, 28 (2), 259-278. Allen, J. and Van der Velden, R. (2001) “Educational mismatches versus skill mismatches: effects on wages, job satisfaction, and on-the-job search”, Oxford Economic Papers, 53(3), 434-452. Baert, S.; Cockx, B. and Verhaest, D. (2013) “Overeducation at the start of the career: stepping stone or trap?”, Labour Economics, 25, 123-140. Bauer, T. (2002) “Educational Mismatch and Wages: A Panel Analysis”, Economics of Education Review, 21, 221–229.. 10.
(23) Chapter 1. Introduction. Becker, G. S. (1975) Human Capital, 2nd edn, National Bureau of Economic Research (NBER), New York. Belfield, C. (2010) “Over-education: What influence does the workplace have?”, Economics of Education Review, 29(2), 236-245. Bracke, P.; Pattyn, E. and von dem Knesebeck, O. (2013) “Overeducation and depressive symptoms: Diminishing mental health returns to education”, Sociology of Heath and Illness, 35(8), 1242-1259. Di Pietro, G. and Urwin, P. (2006) “Education and skills mismatch in the Italian graduate labour market”, Applied Economics, 38(1), 79-93. Dolton, P. and Vignoles, A. (1998) “Overeducation: problem or not?” in Changing Relationship between Higher Education and the State (Eds) M. Henkel and B. Little, Jessica Kingsley, London. Duncan, G. and Hoffman, S. (1981) “The incidence and wage effects of overeducation”, Economics of Education Review, 1(1), 75-86. Freeman, R. (1976) The Overeducated American. Academic Press. Frei, C. and Sousa-Poza, A. (2012) “Overqualification: permanent or transitory?”, Applied Economics, 44(14), 1837-1847. Frenette, M. (2004) “The overqualified Canadian graduate: the role of the academic program in the incidence, persistence, and economic returns to overqualification”, Economics of Education Review, 23, 29–45. Green, F. and McIntosh, S. (2007) “Is There a Genuine Under-utilisation of Skills Amongst the Over-qualified?”, Applied Economics, 39(4), 427-439. Groeneveld, S. and Hartog, J. (2004) “Overeducation, Wages and Promotions within the Firm”, Labour Economics, 11, 701-714. Groot, W. and Maassen van den Brink, H. (2000) “Overeducation in the Labor Market: a Meta-Analysis”, Economics of Education Review, 19(2), 149158. Hartog, J. (2000) “Over-education and earnings: Where are we, where should we go?”, Economics of Education Review, 19, 131-147. Hartog, J. and Oosterbeek, H. (1988) “Education, allocation and earnings in the Netherlands: overschooling?”, Economics of Education Review, 7(2), 185– 194.. 11.
(24) Chapter 1. Introduction. Haveman, R. and Wolfe, B. (1995) “The determinants of children’s attainment: A review of methods and findings”, Journal of Economics Literature, 33(4), 1829-1878. Kiker, B.F.; Santos, M.C. and Mendes de Oliveira, M. (1997) “Overeducation and Undereducation: Evidence for Portugal”, Economics of Education Review, 16(2), 111-125. Korpi, T. and Tåhlin, M. (2009) “Educational mismatch, wages, and wage growth: Overeducation in Sweden, 1974–2000”, Labour Economics, 16, 183-193. Leuven, E. and Oosterbeek, H. (2011) “Overeducation and Mismatch in the Labor Market”, in: E. Hanushek, S. Machin, L. Woessman (Eds.), Handbook of the Economics of Education, 4, 283-326. Levin, H. M., and Tsang, M. (1985) “The economics of overeducation”, Economics of Education Review, 4, 93-104. Mas, M.; Perez, F.; Uriel, E. and Serrano, L. (1995) Capital Humano Series Históricas, 1964-1992, Fundación Bancaixa. Mavromaras, K.; McGuinness, S.; O'Leary, N.; Sloane, P. and Wei, Z. (2013) “Job Mismatches and Labour Market Outcomes: Panel Evidence on University Graduates”, Economic Record, 89, 382–395. McGuinness, S. (2006) "Overeducation in the Labour Market," Journal of Economic Surveys, 20(3), 387-418. OECD (2009) Education at a glance 2009, Paris. OECD (2013) OECD Skills Outlook 2013 First Results from the Survey of Adult Skills, Paris. Piper, A. (2014) “Heaven knows I'm miserable now: overeducation and reduced life satisfaction”, Education Economics, forthcoming. Quintini, G. (2011) “Over-Qualified or Under-Skilled: A Review of Existing Literature”, OECD Social, Employment and Migration Working Papers, No. 121, OECD Publishing. Rubb, S. (2003a) “Overeducation in the labor market: A comment and reanalysis of a meta-analysis”, Economics of Education Review, 22, 621-629.. 12.
(25) Chapter 1. Introduction. Rubb, S. (2003b) “Overeducation: A short or long run phenomenon for individuals?”, Economics of Education Review, 22, 389-394. Sánchez-Sánchez, N. and McGuinness, S. (2013) “Decomposing the impacts of overeducation and overskilling on earnings and job satisfaction: an analysis using REFLEX data”, Education Economics, forthcoming. Sattinger, M. (1993) “Assignment Models of the Distribution of Earnings”, Journal of Economic Literature, 31, 831-880. Sattinger, M. and Hartog, J. (2013) “Nash bargaining and the wage consequences of educational mismatches”, Labour Economics, 23(1), 50-56. Sicherman, N. and Galor, O. (1990) “A theory of career mobility”, Journal of Political economy, 98(1), 169–192. Sloane, P.; Battu, H. and Seaman, P. (1999) “Overeducation, Undereducation and the British Labour Market,” Applied Economics, 31, 1437-1453. Thurow, L. (1975) Generating inequality. Basic Books. Tsai, Y. (2010) “Returns to overeducation: A longitudinal analysis of the U.S. labor market”, Economics of Education Review, 29, 606-617. Tsang, M. C.; Rumberger, R. and Levin, H.M. (1991) “The impact of surplus schooling on worker productivity”, Industrial Relations, 30(2), 209-228. Verdugo, R. and Verdugo, N. (1989) “The impact of surplus schooling on earnings”, Journal of Human Resources, 24(4), 629-643. Verhaest, D. and Omey, E. (2006) “The impact of overeducation and its measurement”, Social Indicators Research, 77, 419-448. Verhaest, D. and Omey, E. (2009) "Objective over-education and worker wellbeing: A shadow price approach," Journal of Economic Psychology, 30(3), 469481. Verhaest, D. and van der Velden, R. (2013) “Cross-country Differences in Graduate Overeducation”, European Sociological Review, 29(3), 642-653.. 13.
(26) Chapter 1. Introduction. 14.
(27) Chapter 2. Non-formal education, overeducation and wages. Chapter 2: Non-formal education, overeducation and wages2. 2.1. Introduction Traditionally, there has been a clear separation between two different ways of accumulating human capital: schooling at an early age and on-the-job experience in adulthood. Nowadays, this separation is not so clear. The role of lifelong learning as a way through which individuals can accumulate human capital beyond early adulthood is a central issue in the current European education policy. In fact, while recognising the role of primary, secondary and higher education, the “Strategic framework for European cooperation in education and training – ET2020” gives priority to lifelong learning as a way to adapt to a rapidly changing world. From the seminal contribution of Mincer (1974), there is a consensus about the positive effect of education on wages. That is, high-educated workers earn higher wages than workers with lower educational levels. However, returns on education have decreased over time. This was indeed pointed out for the U.S. by Freeman (1976) in the book The Overeducated American. He explains that this trend may be the consequence of an excess supply of high-educated workers 2. Previous versions of this research have been presented in XIV Encuentro de Economía Aplicada 2011 (Huelva, Spain); XX Jornadas de la Asociación de Economía de la Educación 2011 (Málaga, Spain); IX Jornadas de Economía Laboral (Santiago de Compostela, Spain); IV Congreso Nacional sobre Mercado de Trabajo y Relaciones Laborales (Palencia, Spain). It has also been published as “Nieto, S. and Ramos, R. (2013) Non-formal education, overeducation and wages, Revista de Economía Aplicada, 61(XXI), 5-28.”. 15.
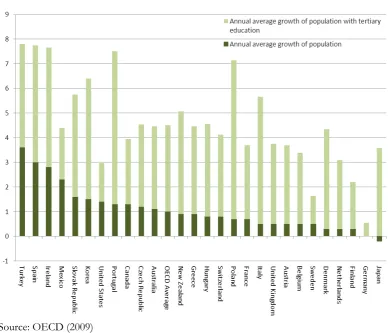
(28) Chapter 2: Non-formal education, overeducation and wages. caused by an overinvestment in college education in the U.S. On the other hand, analyses of the effect of lifelong learning activities on wages in later adulthood are scarce and less conclusive. Furthermore, they mainly focus on formal education in adulthood as lifelong learning activity, while other nonformal education activities have not been considered. For instance, Egerton and Parry (2001) report substantial penalties for late learners since the returns on these activities are fewer than their estimated costs. Jenkins et al. (2002), on the other hand, find little evidence of the positive effect of lifelong learning on wages. In particular, they find positive and significant earning returns for men who left school with low-level qualifications and subsequently obtained a degree. De Coulon and Vignoles (2008) reveal a positive effect of 18% on earnings (on average) of lifelong learning, while Blanden et al. (2012) provide evidence of a medium-run return for women of 10% on hourly wages. A trend in education similar to the one observed by Freeman (1976) seems to appear in most of the OECD countries, since they have experienced an important increase in the number of graduates (see Figure 2.1). In particular, the annual average growth in graduates across all the OECD countries between 1998 and 2006 was around 4.5%, far above the annual population growth in the same period, which was around 1%. The case of Spain deserves special attention, because, in the 1960s and 1970s, Spain’s population had a very low level of education in comparison with the other OECD countries (Mas et al., 1995). Over the last decades, Spain has experienced an annual average growth in the number of graduates of almost 8%, accompanied by an average population increase of approximately 3.5%.. 16.
(29) Chapter 2. Non-formal education, overeducation and wages. Figure 2.1. Annual average growth in 25-64 year-old population between 1998 and 2006. Source: OECD (2009). This sharp increase in the number of graduates has led to a situation in which the percentage of highly educated workers in Spain is currently above the OECD average, although the occupational structure of the Spanish economy is clearly dominated by low and medium skill jobs. As a result, Spain is one of the developed countries with the highest incidence of overeducation, i.e., workers who have a level of education higher than that required by their jobs. According to the OECD (2007), overeducated workers accounted for 25% of total employees in Spain in 2004, more than double the OECD average (12%). Then, one in every four workers in Spain suffers the negative effects of overeducation, especially on their wages. In particular, it is found that overeducated workers receive smaller wages than properly educated workers with the same educational level (see for a review Hartog, 2000; and Leuven and Oosterbeek, 2011).. 17.
(30) Chapter 2: Non-formal education, overeducation and wages. García-Montalvo (2005) points out that the higher incidence of overeducation could be related to an excessive supply of highly educated individuals that the job market has been incapable of absorbing because the jobs on offer do not require such a high level of education, but also to the lack of practical competences of the graduates. In this sense, Sloane (2003) also argues that workers could be overeducated because they do not have the required skills and competences to perform the job satisfactorily and that these skills probably could not be acquired through formal education, an argument that reinforces the role of lifelong learning through activities different from formal education. Regarding the relation between overeducation and lifelong learning activities, Verhaest and Omey (2006) and Büchel (2002) find that overeducated workers participate more in training activities in comparison with their adequately educated colleagues working at the same job level, but they acquire significantly less training in comparison with adequately educated individuals with the same level of education (Hersch, 1991; van Smoorenburg and van der Velden, 2000; Büchel and Mertens, 2004; and Verhaest and Omey, 2006). This finding suggests that, first, more educated workers get more training activities, an idea that is related to the fact that education and training activities are complements (Rosen, 1976). And, second, overeducated workers may not perform non-formal education activities because of a lack of skills, since they tend to carry out these types of activities less frequently than workers with the same level of education who are well matched in their jobs. Taking into account these previous considerations, the objective of this chapter is twofold. First, its objective is to examine the effect of non-formal education activities on individual wages and test whether this effect is different depending on workers’ years of schooling. And, second, its objective is to determine if the returns of the participation in these types of training activities is higher for overeducated workers than for the rest of workers. If it is so, overeducated workers could overcome part of the wage penalisation derived from their education-occupation mismatch. The analysis is carried out using microdata from the Spanish sample of the 2007 Adult Education Survey, a survey that provides detailed information on lifelong learning among the adult population.. 18.
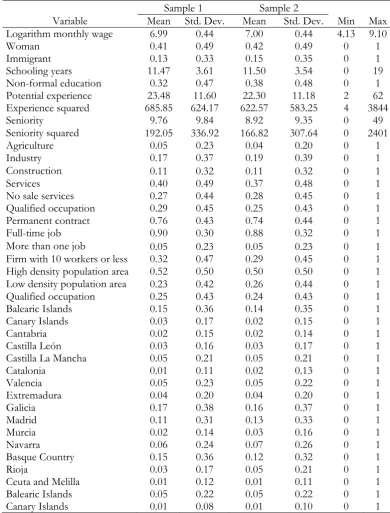
(31) Chapter 2. Non-formal education, overeducation and wages. According to our results, the participation in non-formal education activities has a positive effect on individual wages. We have also found that non-formal education seems to provide overeducated workers with new abilities that permit them to reduce the wage penalisation derived from their skill mismatch. The rest of chapter is structured as follows: Section 2 . 2 presents the data and the variables used in the analysis. It also explains how educational mismatch is measured. Next, Section 2.3 shows a descriptive analysis of the relation between non-formal education activities and educational mismatch. Section 2.4 describes the methodology strategy. Section 2.5 presents the results of estimating the return of the different types of human capital considered in the study, paying special attention to the interaction between non-formal education and educational mismatch. Finally, Section 2.6 contains some closing remarks.. 2.2. Database and variables. 2.2.1. The Spanish sample of the 2007 Adult Education Survey The most appropriate survey for analysing lifelong learning among adults is the Adult Education Survey (AES). The main objective of the survey is to study lifelong learning – that is, those training and learning activities that the adult population performs with the objective of improving or extending their knowledge, skills and competences from a personal, civil, social or workrelated perspective. In this work, we use the Spanish sample of the 2007 AES3 (Encuesta sobre la Participación de la Población Adulta en las Actividades de Aprendizaje; EADA) that was carried out by the Spanish National Institute of Statistics (INE). This survey provides information about a sample of 20,009 people aged between 25 and 74 from all over Spain. Now AES 2011 is available. However, this wave was not available when this research was conducted.. 3. 19.
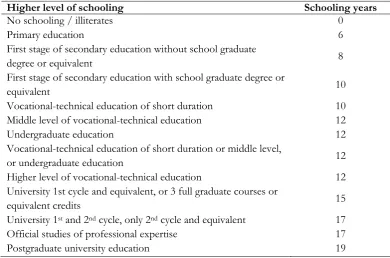
(32) Chapter 2: Non-formal education, overeducation and wages. The learning activities considered by the AES are the following: -. Formal education: it includes education provided in the system of schools, colleges, universities and other formal educational institutions that normally constitutes a continuous “ladder” of full-time education for children and young people, generally beginning at the age of 5 to 7 and continuing up to 20 or 25 years old. It leads to recognised qualifications.. -. Non-formal education (NFE): it refers to institutionalised learning activities, which are not considered formal education. It includes structured programmes that cannot be positioned in the ISCED usually because of the provider and/or the awarding organisation, content or duration. For example, language courses, computer training or art classes are considered non-formal education activities.. -. Informal education: it considers activities that are carried out with the intention of learning, but are not as organised or structured as educational activities. It includes activities such as reading the newspaper or looking for specific information in a book or on the internet.. We restrict our analysis to non-formal education activities since they are intended to improve the population’s specific skills, but without modifying the amount of attained years of schooling. It is worth mentioning that this is the only survey carried out in Spain that provides a high degree of detail on formal and non-formal education. Previous studies focusing on the analysis of educational mismatch and its impact on wages have used microdata extracted from different surveys, such as: the Encuesta de Calidad de Vida en el Trabajo (Quality of Life at Work Survey; ECTV), the Encuesta de Población Activa (Labour Force Survey; LFS), the Encuesta de Estructura, Conciencia y Biografía de Clase (Class Biography, Conscience and Structure Survey; ECBC), the European Community Household Panel (ECHP), the Encuesta de Presupuestos Familiares (Household Budget Survey;. 20.
(33) Chapter 2. Non-formal education, overeducation and wages. EPF) or the Encuesta de Estructura Salarial (Structure of Earnings Survey; SES). However, these sources do not provide information on lifelong learning, with the exception of the LFS, which devotes seven questions to training activities but provides very little information on non-formal education activities. For this reason, we choose to use microdata from the AES survey. Beyond information about lifelong learning activities, the survey provides variables related to personal and job characteristics. With respect to the personal characteristic variables, we use information related to gender, nationality, years of education4 and the number of household members. As for job characteristics, we consider workers’ occupation, monthly earnings, economic activity, potential experience (age minus the number of years in education minus six), seniority, type of contract, type of working day, number of jobs and firm size. Finally, we also consider information about the region (Autonomous Communities) and regional population density. Moreover, although AES is a dataset containing cross-sectional data referring to 2007, it provides retrospective information on a series of variables related to the occupation of workers corresponding to the 12 months preceding the survey. Consequently, it also allows us to measure educational mismatch in 2006 beyond 2007. The initial sample considered is composed of people who were working at the time of the survey (11.738 observations). However, the sample is restricted to 5.183 observations when the effect of non-formal education and educational mismatch on wages is estimated due to an important number of workers having missing values in the variables related to jobs (mainly wages). Descriptive statistics for both samples are shown in Table A2.2 of the Annex. As we can see, there are no important differences between both samples.. The AES provides data on schooling levels. The equivalences applied to calculate the number of schooling years are shown in Table A2.1 of the Annex.. 4. 21.
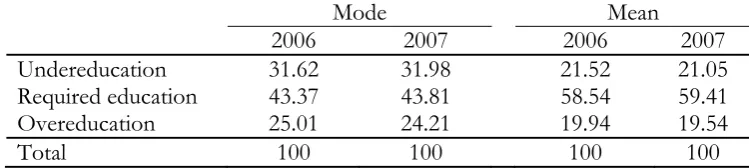
(34) Chapter 2: Non-formal education, overeducation and wages. 2.2.2. Measurement of educational mismatch As it has been explained in the section 1.2 of chapter 1, literature on educational mismatch has proposed (at least) three different methods for measuring educational mismatch. The AES database allows us to measure educational mismatch only through the statistical method (both the version based on the mean and the version based on the mode) given that it informs workers’ attained education and their occupations5. In particular, the statistical method based on the mean (Verdugo and Verdugo, 1989) considers that a person is overeducated (undereducated) if he/she has a level of education that is higher (lower) by more than one standard deviation than the mean level of education of the workers in that occupation. Nevertheless, Kiker et al. (1997) propose the use of the mode instead of the mean; so they consider a person who has a higher (lower) level of education than the mode for the job they perform to be overeducated (undereducated). Following both definitions, Table 2.1 shows the percentages of educational mismatch for 2006 and 2007. As we can see, the incidence of educational mismatch varies according to the procedure used. In particular, the method based on the mean shows that undereducated workers represent 21% of the total number of workers in 2007, while almost 20% are overeducated. However, using the method based on the mode, both overeducation and undereducation are greater. Specifically, the percentage of undereducated workers is almost 32% of all workers, while overeducated workers are 24%, more than 10 and 5 percentage points (respectively) above the figure obtained using the method based on the mean. As is to be expected, the results for 2006 are very similar to those for 2007.. 5. Two digits disaggregation.. 22.
(35) Chapter 2. Non-formal education, overeducation and wages. Table 2.1. Educational mismatch in 2006 and 2007 (in percentages) Mode Undereducation Required education Overeducation Total. 2006 31.62 43.37 25.01 100. 2007 31.98 43.81 24.21 100. Mean 2006 21.52 58.54 19.94 100. 2007 21.05 59.41 19.54 100. This finding is probably a consequence of the definition of educational mismatch adopted in each of the methods. Specifically, the method based on the mean classifies workers as properly educated if they are within one standard deviation of the mean number of years of education that people in a specific occupation have completed, whereas the version based on the mode counts workers as properly educated only when the number of years of education they have completed coincides exactly with the mode. This means that a worker is more likely to be considered properly educated in the version based on the mean than in the version based on the mode. This result is, indeed, a common finding in educational mismatch literature (see Table 2.2). In comparison to the subjective and the objective methods, Bauer (2002) observes that the level of educational mismatch given by the statistical method is less than that given by either the objective or subjective method and, therefore, that the statistical method is considered to underestimate educational mismatch. In fact, the statistical method takes the ideal level of education for performing a specific occupation to correspond to the mean (mode) number of years of formal education that people who work in that occupation received. Consequently, if the majority of workers in a specific occupation were overeducated, the mean (mode) for that occupation would be higher than it would be if the majority of the workers were not overeducated; therefore, in the former case, overeducation would be underestimated. Analogously, if the majority of workers were undereducated, the mean (mode) would be lowered and undereducation would be underestimated.. 23.
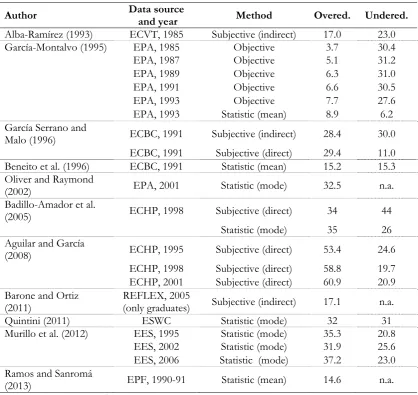
(36) Chapter 2: Non-formal education, overeducation and wages. Table 2.2. Survey of research on educational mismatch in Spain Author Alba-Ramírez (1993) García-Montalvo (1995). García Serrano and Malo (1996) Beneito et al. (1996) Oliver and Raymond (2002) Badillo-Amador et al. (2005). Data source and year ECVT, 1985 EPA, 1985 EPA, 1987 EPA, 1989 EPA, 1991 EPA, 1993 EPA, 1993. Method. Overed.. Undered.. Subjective (indirect) Objective Objective Objective Objective Objective Statistic (mean). 17.0 3.7 5.1 6.3 6.6 7.7 8.9. 23.0 30.4 31.2 31.0 30.5 27.6 6.2. ECBC, 1991. Subjective (indirect). 28.4. 30.0. ECBC, 1991 ECBC, 1991. Subjective (direct) Statistic (mean). 29.4 15.2. 11.0 15.3. EPA, 2001. Statistic (mode). 32.5. n.a.. ECHP, 1998. Subjective (direct). 34. 44. Statistic (mode). 35. 26. Aguilar and García (2008). ECHP, 1995. Subjective (direct). 53.4. 24.6. Subjective (direct) Subjective (direct). 58.8 60.9. 19.7 20.9. Barone and Ortiz (2011) Quintini (2011) Murillo et al. (2012). ECHP, 1998 ECHP, 2001 REFLEX, 2005 (only graduates) ESWC EES, 1995 EES, 2002 EES, 2006. Subjective (indirect). 17.1. n.a.. Statistic (mode) Statistic (mode) Statistic (mode) Statistic (mode). 32 35.3 31.9 37.2. 31 20.8 25.6 23.0. Statistic (mean). 14.6. n.a.. Ramos and Sanromá EPF, 1990-91 (2013) Note: n.a. = not available. However, it is important to highlight that in spite of the differences in percentages depending on the measurement method considered, Hartog (2000) concluded that the basic relation between educational mismatch and earnings seems not to be influenced by the measurement method. Nevertheless, Rubb (2003) points out that the measurement influences the magnitude of the coefficients.. 24.
(37) Chapter 2. Non-formal education, overeducation and wages. According to this, we perform the main analysis using one of the measurement methods – in particular, the mode version6. However, we do a robustness check using the mean version (see Section 2.5.3).. 2.3. Descriptive analysis First, using the information on educational mismatch for 2006 and 2007, we analyse whether workers who have participated in non-formal education activities change their situation of education-occupation mismatch in a different way than the rest of workers (Table 2.3). If this is so, non-formal education activities could encourage workers to change their occupation or, alternatively, help them to gain promotion. In this sense, it is important to highlight that non-formal education consists of those activities that do not lead to a recognised qualification and that people of all ages can embark on (so, by itself it does not change the situation of education mismatch of workers). This type of activity can lead to an increase in the competences and skills of those who undertake them. However, non-formal education is not counted when determining the number of years of education a person has received. Thus, in this study, people’s level of education is considered to be given by the number of years of formal education they have received, which remains unaltered by participation in non-formal education, although the latter is considered a means of increasing competences and skills.. 6. Hartog (2000) explains that the method based on the mean tends to produce very similar percentages of overeducation and undereducation as a consequence of the symmetry of the tails of the normal distribution.. 25.
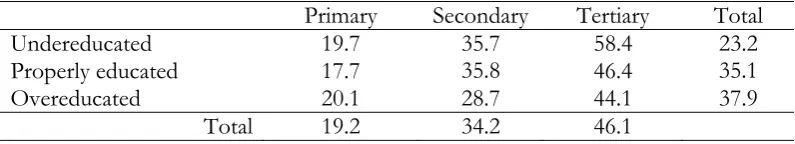
(38) Chapter 2: Non-formal education, overeducation and wages. Table 2.3. Evolution of the educational mismatch from 2006 to 2007 Workers Mismatch not changed Mismatch changed Total Mismatch changed From properly to over From properly to under From over to properly Other situations Total. Frequency % 10.994 94.86% 596 5.14% 11.590 100%. Workers who have undertaken NFE activities Frequency % 3.625 93.67% 245 6.33% 3.870 100%. 57. 9.56%. 24. 9.80%. 203. 34.06%. 76. 31.02%. 253 83 596. 42.45% 13.93% 100%. 115 30 245. 46.94% 12.24% 100%. Note: NFE=non-formal education. Common sample of employees is reduced to 11.590 in both years.. Table 2.3 shows that approximately 5% of all workers and 6% of workers who undertook non-formal education changed the match between their level of education and their occupation between 2006 and 2007. Moreover, more than 42% of the people whose degree of educational mismatch changed managed to equate their level of education to that required for the work they perform. However, the change of occupation or internal promotion does not seem to have been due to training activities, since this change can be observed in both those who undertook this type of activity and those who did not. Thus, the fact that both samples present a low percentage of workers who have changed their type of match between the level of education and occupation seems to indicate that undertaking non-formal education activities does not have a great impact on the type of mismatch. On the other hand, we also analyse the participation of workers in non-formal educational activities depending on their education-occupation match and educational level (Table 2.4). First, it can be seen that 46.1% of workers with tertiary education have undertaken non-formal education activities, while the percentage for workers with primary education is 19.2%. The results support the complementarity between education and training. On the other hand, Table 2.4 also shows that only the 23% of undereducated workers, who are those with less formal education than their job requires, realise non-formal education activities. In contrast, the 38% of overeducated workers have. 26.
(39) Chapter 2. Non-formal education, overeducation and wages. participated in some kind of non-formal education, while this percentage is 35% for workers without an education-occupation mismatch. Furthermore, if we focus on workers with tertiary and secondary education, overeducated workers participate more in training activities in comparison with their adequately educated colleagues working at the same job level, but they get less training in comparison with adequately educated individuals with the same level of education. Our results are in line with previous literature (Verhaest and Omey, 2006; Büchel, 2002; Hersch, 1991; van Smoorenburg and van der Velden, 2000; Büchel and Mertens, 2004; and Verhaest and Omey, 2006).. Table 2.4. Percentage of workers who have undertaken NFE activities in the last 12 months Undereducated Properly educated Overeducated Total. Primary 19.7 17.7 20.1 19.2. Secondary 35.7 35.8 28.7 34.2. Tertiary 58.4 46.4 44.1 46.1. Total 23.2 35.1 37.9. Note: NFE=non-formal education. In this sense, if overeducated workers are in jobs that require less education than they already have and non-formal education does not seem to help them to improve their situation and obtain a proper job, why is their participation in non-formal education activities higher than it is for their adequately educated colleagues working at the same job level? In the following sections, we analyse whether overeducated workers may receive a wage premium compared to other overeducated workers in order to explain their higher participation in these kinds of learning activities or, on the other hand, if this only reflects the fact that high-educated workers get more training than workers with a lower educational level.. 27.
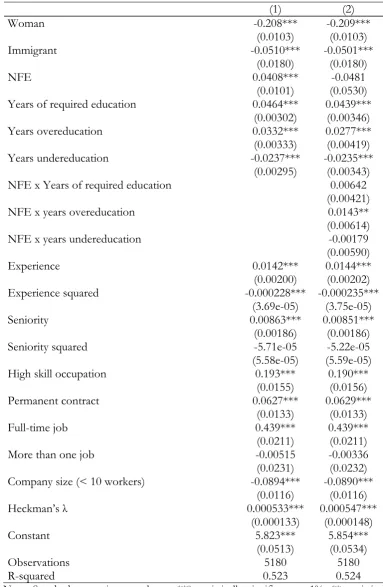
(40) Chapter 2: Non-formal education, overeducation and wages. 2.4. Methodology and results Firstly, in order to analyse the effect of non-formal education activities on individual wages and test whether this effect is different depending on workers’ schooling years, we estimate the following specifications of the Mincer wage equation (Mincer, 1974): log( W i ) ' X i S i 1 · E i 2 · E i2 u i. (1). log(Wi ) ' X i Si 1·Ei 2 ·Ei2 3 NFEi ui. (2). log(Wi ) ' X i S i 1· E i 2 · E i2 3 NFEi 4 S _ NFEi u i (3). where log(Wi) represents the logarithm of the monthly wage of worker i; Xi is a vector of variables related to personal characteristics and employment characteristics; Si refers to the number of years of formal education; Ei represents experience; Ei2 represents the square of experience; NFEi is a dummy variable that takes the value 1 if the worker has partaken in any nonformal education activity and 0 otherwise; S_NFEi is defined as the interaction of variable S with NFE; and, finally, ui is the error term with zero mean and constant variance7. Secondly, we estimate an ORU (Over-Required-Undereducated) by Duncan and Hoffman (1981) in order to analyse the effect of overeducation on wages. In fact, the ORU specification is a variant of the Mincer equation in which the years of education of the worker (S) are separated into years of education required for the job (Sr), years of overeducation (So) and years of undereducation (Su). More specifically, So and Su are defined as: S Sr if S Sr So 0 on contrary. Sr S if S Sr Su 0 on contrary. The ORU equation is then defined as:. Mincer equations have been estimated using ordinary least squares that are robust to heteroscedasticity.. 7. 28.
(41) Chapter 2. Non-formal education, overeducation and wages. log( W i ) ' X i 1 Sr i 2 So i 3 Su i 1 · E i 2 · E i2 u i. (4). Just as in the Mincer equation, Xi is a vector of variables related to personal and job characteristics, Ei represents potential experience and ui is the error term. Furthermore, in order to analyse whether non-formal education activities could report higher returns of workers depending on whether they are overeducated, undereducated or properly educated, we also estimate equation (5) including interactions between variables related to educational mismatch and non-formal education activities ( Sr _ NFE , So _ NFE , Su _ NFEi ): log(Wi ) α β' X i δ1 Sri δ2 Soi δ3 Sui ρ1·Ei ρ2·Ei2 ρ3 NFEi ρ4 Sr_NFEi ρ5 So_NFEi ρ6 Su_NFEi ui. (5). Finally, we also take into account that the results of each specification could mask a problem of sample selection bias or “self-selection” since the sample of workers with reported wages may no longer be random and may not be a suitable representation of workers overall – that is, when it comes to estimating the wage equation, only the characteristics of people who are working, which could lead to false conclusions about the effect of the different variables on the endogenous variable. For example, if the majority of workers in the sample considered have many years of education, there would be a tendency to underestimate the effect of education on wages. To correct the possible selection bias, Heckman (1979) proposed a two-stage method that can be interpreted as the incorporation of variables that were omitted from the wage equation. The first stage consists of analysing the factors that determine the probability of being employed, from which Heckman’s lambda is obtained (the inverse of Mills’ ratio). In the second stage, Heckman’s lambda is included as an explanatory variable in the wage equation. In this way, when the factors that determine wages are analysed, the uncontrolled characteristics relating to the probability of a person being employed are taken into account. Because of issues of identification, it is necessary that at least one explanatory variable that appears in the selection. 29.
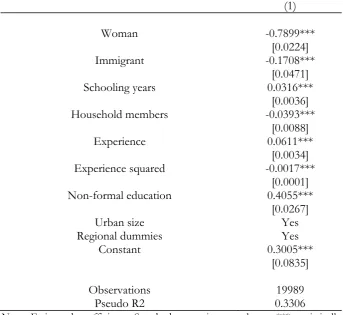
(42) Chapter 2: Non-formal education, overeducation and wages. equation does not appear in the wage equation. In other words, we need a variable that affects the probability of being employed, but not the salary.. 2.5. Results In this section, we show the results of the Mincer and ORU equations to check the effect of non-formal education activities on individual wages and whether overeducated workers who perform these types of activities achieve higher returns than overeducated workers who do not. All estimations include the correction term of a possible problem of sample selection and individual weights. 2.5.1. Sample selection bias As has been explained in the previous section, we apply the two-stage method proposed by Heckman (1979) in order to correct the possible selection bias. In the first stage, we analyse the determinants of being employed considering that one of the variables, at least, should not be a determinant of workers’ wages. Like in other studies, we consider the “number of household members” as an exclusion variable, as it can affect the decision to work but does not affect wages. In particular, people can decide to participate in the labour market depending on how many people they have in their charge, but we do not expect employers to consider this variable when setting their wages. The results of the first stage of the method are shown in Table 2.5. As we can see, women and immigrants are less likely to be employed than men and natives. Schooling years as non-formal education activities increase the probability of being in work. In contrast, the number of household members has a negative and statistically significant effect on the probability of being employed.. 30.
(43) Chapter 2. Non-formal education, overeducation and wages. Table 2.5. Determinants of the probability of being in work (1) Woman Immigrant Schooling years Household members Experience Experience squared Non-formal education Urban size Regional dummies Constant Observations Pseudo R2. -0.7899*** [0.0224] -0.1708*** [0.0471] 0.0316*** [0.0036] -0.0393*** [0.0088] 0.0611*** [0.0034] -0.0017*** [0.0001] 0.4055*** [0.0267] Yes Yes 0.3005*** [0.0835] 19989 0.3306. Note: Estimated coefficients. Standard errors in parentheses. *** statistically significant at 1%; ** statistically significant at 5%; * statistically significant at 10%. Individual sample weights are considered.. We have also tested the quality and the validity of this instrumental variable through common statistics. In particular, instrumental quality is ensured if there is a strong correlation between the instrument and the probability of employment; to test the joint significance, we have used the criteria suggested by Bound et al. (1995). The partial R squared and F statistic on the excluded instrument in the first-stage regression (using OLS) will indicate that the instrument is legitimate8. We have also checked the validity of the instrument through the approach of Dolton and Vignoles (2002): a valid instrument must be uncorrelated with the error term of the wage equation and, thus, it will not affect the income conditional on the included explanatory variables. Hence, we have regressed the residuals from the wage equation against the instrument, 8. The partial R squared is 0.0117, and the value of the F statistic is 218.53.. 31.
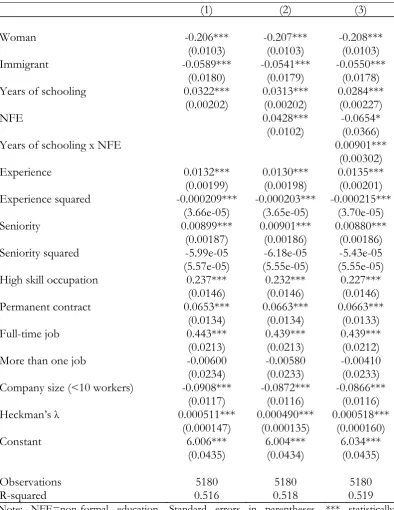
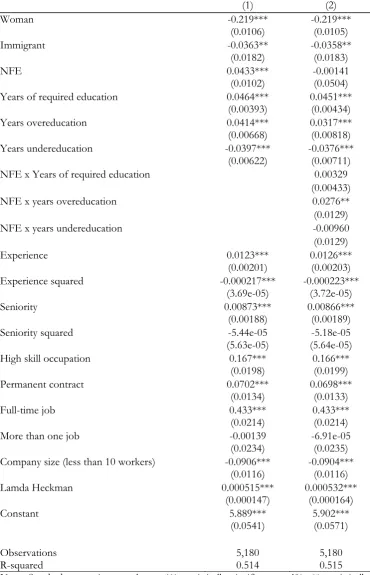
(44) Chapter 2: Non-formal education, overeducation and wages. and we have obtained an R squared of 0.0001, which means that the instrument does not explain any significant variation in the residuals. Taken together, these two results indicate that the chosen instrument will be appropriate.. 2.5.2. Wage models First, Table 2.6 shows the results of OLS estimations of Mincer’s equations. Regarding the variables related to personal characteristics and job characteristics, the expected results are obtained in all three specifications. Being a woman and an immigrant are handicaps in terms of wage. Working in companies of 10 or fewer workers and living in areas with a low population density also result in lower wages. In contrast, greater potential work experience and a longer time working in a company have positive effects on wages. Finally, workers in high-skilled occupations with permanent contracts, working full time, earn higher wages than workers with few qualifications and temporary contracts working part time. Moreover, Heckman’s lambda shows that self-selection of workers is relevant. The parameter is positive and statistically significant, so we cannot reject the possibility that there is a positive selection effect on wages, since it is probably the case that people with a greater probability of being employed earn more than the average for people who are employed and whose wages are reported. Regarding the variables of interest in the study, all three equations show that the workers’ years of schooling are statistically significant in the three specifications of the Mincer equation and have a positive return of approximately 3%. The results of equation [2] show that people who have undertaken non-formal education earn wages 4.7% (exp (0.0428) -1 = 0.0468) higher than those workers who have not done so, independent of their level of education. The results of equation [3] show that the returns on non-formal education are related to attained education, and its effect is greater if the worker has a higher level of education by just one year. Specifically, the return is 0.9% for each year of formal education.. 32.
Figure
+7
Documento similar
With the IoT Spartans Challenge we are helping universities, colleges and high schools train and guide the future workers who will build and run IoT projects and long term
Finally, ANCOVAs showed that for both permanent and temporary workers the profile with strong fulfillment of Balanced, Relational and Transactional psychological contract
These are Australia, Austria, Belgium, Denmark, Finland, Germany, Greece, Latvia, Liechtenstein, Luxembourg, New Zealand, Norway, Portugal, Switzerland and Scotland in
Over-education is a labor market phenomenon whereby heterogenous workers obtain jobs where their formal educational qualification (expressed as years of education or
This paper, using a large sample of farm level informa- tion collected by the Institute of Agrarian Reform for the estates expropriated in the re- gion of Extremadura, questions
The concept of breakdown probability profile is useful to describe the break- down properties of any estimate obtained through resampling, not just the bagged median or the
Regarding monetary consequences, our study shows the following results: 1) underqualification is penalised in wage, so this mismatch would explain wage differential between workers
This paper analyzes the incidence, and job satisfaction consequences of educational and competence job-worker mismatches in the Spanish labour market. Our purpose is not only to
