Genetic analysis and selection for intramuscular fat
and oleic acid content in pigs
Roger Ros Freixedes
Dipòsit Legal: L224.-2015 http://hdl.handle.net/10803/285933 llegit la tesi
ADVERTIMENT. L'accés als continguts d'aquesta tesi doctoral i la seva utilització ha de respectar els drets de la persona autora. Pot ser utilitzada per a consulta o estudi personal, així com en activitats o materials d'investigació i docència en els termes establerts a l'art. 32 del Text Refós de la Llei de Propietat Intel·lectual (RDL 1/1996). Per altres utilitzacions es requereix l'autorització prèvia i expressa de la persona autora. En qualsevol cas, en la utilització dels seus continguts caldrà indicar de forma clara el nom i cognoms de la persona autora i el títol de la tesi doctoral. No s'autoritza la seva reproducció o altres formes d'explotació efectuades amb finalitats de lucre ni la seva comunicació pública des d'un lloc aliè al servei TDX. Tampoc s'autoritza la presentació del seu contingut en una finestra o marc aliè a TDX (framing). Aquesta reserva de drets afecta tant als continguts de la tesi com als seus resums i índexs.
ADVERTENCIA. El acceso a los contenidos de esta tesis doctoral y su utilización debe respetar los derechos de la persona autora. Puede ser utilizada para consulta o estudio personal, así como en actividades o materiales de investigación y docencia en los términos establecidos en el art. 32 del Texto Refundido de la Ley de Propiedad Intelectual (RDL 1/1996). Para otros usos se requiere la autorización previa y expresa de la persona autora. En cualquier caso, en la utilización de sus contenidos se deberá indicar de forma clara el nombre y apellidos de la persona autora y el título de la tesis doctoral. No se autoriza su reproducción u otras formas de explotación efectuadas con fines lucrativos ni su comunicación pública desde un sitio ajeno al servicio TDR. Tampoco se autoriza la presentación de su contenido en una ventana o marco ajeno a TDR (framing). Esta reserva de derechos afecta tanto al contenido de la tesis como a sus resúmenes e índices.
GENETIC ANALYSIS AND SELECTION FOR
INTRAMUSCULAR FAT AND OLEIC ACID
CONTENT IN PIGS
GENETIC ANAL
YSIS AND SELECTION FOR
INTRAMUSCULAR F
AT AND OLEIC ACID CONTENT IN PIGS
Roger Ros Freixedes
Roger Ros Freixedes
GENETIC ANALYSIS AND SELECTION
FOR INTRAMUSCULAR FAT AND
OLEIC ACID CONTENT IN PIGS
Presentat per / Presented by
Roger Ros Freixedes
Aquesta tesi ha sigut presentada per optar al grau de Doctor en Ciència i
Tecnologia Agrària i Alimentària per la Universitat de Lleida.
This thesis has been submitted in fulfillment of the requirements for the degree
of Doctor of Philosophy in Agricultural and Food Science and Technology at
the University of Lleida.
La recerca s’ha realitzat sota la supervisió del director de tesi:
Research was performed with the guidance of doctoral supervisor:
Dr. Joan Estany Illa
Departament de Producció Animal
Universitat de Lleida
Celebrem els funerals amb diner i candela de la mort del nostre porc, que és gran meravella, entre els amics i parents que se’l troben entre dents sens tenir-ne pensaments si és mascle o femella.
Els funerals del porc (fragment), cançó tradicional catalana
Vull agrair al Dr. Joan Estany el suport que m’ha donat i les oportunitats
ofertes des que vaig començar a treballar en el seu grup l’estiu de l’any 2009,
llavors entubant mostres al laboratori amb la Teresa Giró i l’Anna Ñaco. En
aquells moments no m’imaginava que uns quants anys més tard encara estaria
aquí, a punt de presentar la meva tesi doctoral sota la seva direcció, i em sento
molt feliç i afortunat d’haver pogut formar part d’aquest equip també juntament
amb el Dr. Marc Tor, la Dra. Romi Pena, el Dr. Lluís Bosch, el Dr. Javi
Álvarez, la Cristina Labella durant el seu pas pel laboratori i les meves
companyes doctorandes i amigues: la Rebeca Muñoz i la Sofia Gol. De tots ells
he après molt i amb ells m’he sentit com a casa. Vull agrair-los a tots la seva
ajuda, sense la qual aquesta tesi no hauria esdevingut una realitat, i els bons
moments viscuts.
A en Josep Reixach i la resta de personal de Selección Batallé per fer
possible la realització dels experiments i la recerca en què es basa aquesta tesi,
pel suport en la preparació de les bases de dades i per estar sempre disponible
per donar el seu punt de vista i resoldre els dubtes o problemes que anessin
apareixent.
In Summer 2010, just before formally starting my PhD research, I had the
opportunity to visit Dr. Max Rothschild’s group at Iowa State University as an
intern. I would like to thank him for accepting me in the group back then. I
learnt a lot and I have very good memories of those months and all the people I
met there, particularly Dr. Suneel Onteru for teaching me everything I needed
to know and for his kindness. Happily, I had the chance to collaborate again
with Dr. Rothschild in 2013, together with Dr. Eui-Soo Kim, working on the
analysis of selection signatures.
I visited Dr. Eli Gjerlaug-Enger and Dr. Eli Grindflek at Norsvin and the
Norwegian University of Life Sciences in 2012. I thank them and the rest of
Norsvin staff for their friendliness and for the very enjoyable experience of
learning how this breeding company works and how they use near-infrared
spectroscopy technology to analyze fatty acid composition in their pig lines.
Group, to make new acquaintances, and to benefit from their knowledge on
genomic selection and the last advances in animal breeding.
I am in debt with all of them.
No vull deixar de fer extensiu al meu agraïment a totes les persones que
m’han acompanyat durant aquesta etapa de la meva vida, especialment als meus
amics doctorands, companys de fatigues amb qui compartir més que l’hora de
dinar, i molts d’ells ja feliçment doctorats. Als amics de tota la vida, per seguir
sent-hi els caps de setmana. A la família, i especialment a la cosineta Anna per
l’ajuda amb programes de disseny gràfic. A les meves àvies, els meus pares
Sadurní i Núria i la meva germana Laura per la seva paciència i suport en tot
moment. A la Nora pel seu amor.
Introduction ... 15
Objectives ... 29
Animals and Samples ... 31
Part 1 ... 33
Chapter 1. On the compositional analysis of fatty acids in pork ... 35
Part 2 ... 55
Chapter 2. Expected genetic response for oleic acid content in pork ... 57
Chapter 3. Genetic correlations of intramuscular fat content and
fatty acid composition among muscles and with subcutaneous fat
in Duroc pigs ... 71
Chapter 4. Response to selection for decreased backfat thickness at
restrained intramuscular fat content in Duroc pigs ... 83
Chapter 5. Response to selection for intramuscular oleic acid content
in Duroc pigs ... 97
Part 3 ... 107
Chapter 6. A functional variant in the stearoyl-CoA desaturase gene
promoter enhances fatty acid desaturation in pork ... 109
Chapter 7. Genome-wide association study singles out the SCD and
LEPR as the two main loci influencing intramuscular fat content and
fatty acid composition in Duroc pigs ... 135
Discussion ... 151
Conclusions ... 159
References ... 161
Introduction
Pig meat represents 36% of the total meat produced in the world, and the 51% in the European Union (FAO, 2014). Spain is the 4th pig producer in the world and produces 3M tonnes/year, which represents 3% and 15% of the world and European Union productions, respectively. In Spain, where the production of pig meat reaches the 64% of total meat, processed and dry-cured products are of great importance. Particularly, the traditional dry-cured ham is very appreciated by consumers and can
have a large added value according to its quality. Intramuscular fat (IMF) content and
fatty acid composition are relevant factors for meat quality from the organoleptic, technological, and nutritional points of view (for a review see Wood et al., 2003), and thus, they are becoming two important issues for both the pig industry and the consumers.
Intramuscular fat comprises the lipids both in the proper intramuscular adipose tissue (fat cells located along the fibres and in the interfascicular areas) and in the muscle fibres (Gandemer, 2002). Whereas the intramuscular adipose tissue has a storage function and mostly contains neutral lipids (mainly triglycerides), the principal contribution of muscle fibres to IMF is phospholipids (lipids in the cell membrane with
a structural function). Overall, the major fatty acids in pork are oleic acid (C18:1;
>30% of total fatty acids, reaching 45% in our study population), palmitic acid (C16:0;
~20%), stearic acid (C18:0; ~10%), and linoleic acid (C18:2; ~10%). Both IMF
content and composition are known to be interrelated and affected by several factors, including genetics, which makes them susceptible to being genetically improved through selection.
I.1. INTRAMUSCULAR FAT AND MEAT QUALITY I.1.1. Organoleptic quality
that contribute to the characteristic flavor of pork (Mottram, 1998; Cameron et al., 2000; Gandemer, 2002). Some reports suggested that there is a threshold above which further increases of IMF levels do not improve sensory attributes. It has been estimated in 1.5% (Fortin et al., 2005), 2% (Bejerholm & Barton-Gade, 1986), or 2.5−3% (DeVol et al., 1988).
Nonetheless, the most important is the consumer acceptability of meat. Kempster et al. (1986) reported that although the meat from fat carcasses was juicier, less tough, and more flavorful than that from lean carcasses, no differences were found in consumer acceptability. Similarly, in the experiments by Fernandez et al. (1999a), a trained sensory panel gave higher juiciness and flavor scores to loin chops with IMF levels above approximately 2.5%. When the same chops were evaluated by non-trained consumers (Fernandez et al., 1999b), those with IMF levels of 2.5−3.5% were more favorably evaluated for both tenderness and taste, but it was observed that higher IMF levels could lead to rejection of the raw chops due to more visible fat and fat-associated health concerns (Fernandez et al., 1999b; Brewer et al., 2001). Marbling is the term used to refer to the visible fat in meat, in the form of white streaks of fat between the muscle fibres. It is only a part of the total IMF, but strongly related to total content, and it affects the consumer perception of meat (Brewer et al., 2001). Several studies determined the optimum IMF levels for consumer acceptability. It varies depending on cultural preferences but also on the kind of product. For example, for fresh pork, the optimum has been located at 1.5−3.5%, but for high-quality Iberian dry-cured products levels up to 12% are appreciated (Ventanas et al., 2007).
The composition of IMF also affects the organoleptic quality of meat. In general, SFA and MUFA are positively related to better attributes, in opposition to PUFA. This holds true for flavor, tenderness, and juiciness (Cameron & Enser, 1991; Cameron et al., 2000; Ruiz-Carrascal et al., 2000). In particular, Cameron et al. (2000) reported positive correlations of C18:1 with pork flavor and overall acceptability (0.36−0.40). However, because IMF content and composition are interrelated (Section I.2.1), it remains uncertain whether this reflects the effect of IMF content instead of the fatty acids themselves.
I.1.2. Technological quality
by lipolytic enzymatic activity. Although lipid oxidation is an important reaction in the development of flavor of cooked pork, it affects negatively the product shelf life, causing problems of fat rancidity.
I.1.3. Nutritional value
Meat is a major source of fat in the diet and its fatty acid composition determines its nutritional value. Whereas total fat intake is clearly associated with diseases like obesity, no evidence for significant effects on cardiovascular disease or cancer incidence have been found (FAO, 2010). Rather than the total amount of fat, it is its fatty acid composition that has an impact on the risk of cardiovascular disease. The intake of SFA has been widely associated with increased low density lipoprotein
(LDL) and total cholesterol levels in blood, considered indicators for the risk of
cardiovascular disease (Williams, 2000; FAO, 2010). Reducing the total fat intake has been proved to be an inefficient strategy to overcome this problem (Hooper et al., 2012). Meta-analyses indicated that isocaloric substitutions of dietary SFA with carbohydrates have not succeeded in modifying the ratio between total and
high-density lipoprotein (HDL) cholesterol in blood (Micha & Mozaffarian, 2010). On the
other hand, isocaloric replacements of SFA with unsaturated fatty acids can reduce the cholesterol levels and the risk of cardiovascular diseases (Hooper et al., 2012). Particularly, replacing SFA with PUFA is effective in reducing LDL and total cholesterol and increasing HDL cholesterol and in reducing cardiovascular disease (Hu et al., 2001; Stewart et al., 2001; Micha & Mozaffarian, 2010). Results regarding the effects of replacement with MUFA are often mixed and contradictory. Some experiments proved that products with MUFA-enhanced compositions can be successful in reducing blood cholesterol levels in humans (Williams, 2000). A meta-analysis by Clarke et al. (1997) indicated that isocaloric substitutions of dietary SFA with MUFA succeeded only in increasing HDL cholesterol (about as much as PUFA) but failed to decrease LDL and total cholesterol. Substitutions of carbohydrates with MUFA resulted in increased HDL cholesterol levels without affecting LDL cholesterol (Hu et al., 2001) or in decreased LDL cholesterol without affecting HDL cholesterol (Micha & Mozaffarian, 2010). Overall, replacement of SFA with PUFA has had better results on blood cholesterol levels than replacement with MUFA. The FAO (2010) considered that there is convincing evidence that replacing SFA with PUFA reduces the risk of cardiovascular disease, and reckons that a similar effect may be expected for MUFA despite insufficient evidence.
Regarding PUFA, the omega-3 and omega-6 PUFA have to be distinguished.
Both are essential in humans, i.e., they cannot be synthesized de novo and must be
PUFA are widely regarded as beneficial for human health and have chemoprotective properties, some unfavorable effects have been reported for the omega-6 PUFA if their
intake is excessive. These PUFA, and mainly arachidonic acid (C20:4), can easily
oxidise and their peroxidation products could have adverse health effects such as increasing the risk of breast cancer development (Jiménez-Colmenero et al., 2001; de Lorgeril & Salen, 2012). Because the susceptibility to peroxidation increases with the number of double bonds of the molecule, Christophersen & Haug (2011) suggested replacing SFA with C18:1 instead of PUFA to overcome the adverse properties of the peroxidised products derived from PUFA.
Social concerns about the effects of fatty acid composition on health find their expression in the recommendations of national and international health authorities. The
Food and Agriculture Organization and the World Health Organization of the United
Nations (FAO, 2010) recommended a fat intake of 15−35% of total energy intake, a maximum SFA intake of 10% of total energy, and a PUFA intake of 6−11% of total energy (2.5−9% and 0.5−2% for omega-6 and omega-3 PUFA, respectively). No limits for MUFA intake were included in these recommendations. The MUFA intake can cover a wide range of values depending on total fat, SFA, and PUFA intakes. More recently, in 2011, Denmark was the first country to apply a "fat tax" of 2 €/kg of saturated fat on products that exceeded 2.3% of SFA (BBC News, 2011). Although it was abolished one year later due to the extra costs for the producers and the inflated prices for the consumers (BBC News, 2012), this is the first known attempt to regulate the fatty acid composition of food rather than only providing guidelines.
I.1.4. Intramuscular oleic acid and meat quality
and meat are not directly priced based on its fat composition, meat products with better sensory attributes and a healthier fatty acid profile might find good acceptance in niche high-quality markets (Knap, 2014).
I.2. MAIN FACTORS AFFECTING INTRAMUSCULAR FAT COMPOSITION
Intramuscular fat content and composition are affected by several factors including diet, breed, sex, age, or tissue, among others. Because there exists a relationship between IMF content and its fatty acid composition, the effect of the aforementioned factors on IMF composition is difficult to separate from the effect of IMF content (De Smet et al., 2004; Wood et al., 2008). The diet is the factor with the greatest effect on fat composition. Because of this, multiple studies investigated diet-based strategies to modify the pork fatty acid profile, but their effectiveness regarding IMF composition is limited.
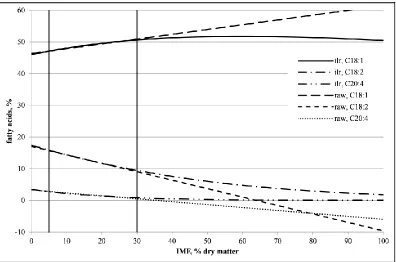
I.2.1. Relationship between fat content and composition
Fat depots can be divided into two fractions: neutral lipids (mainly triglycerides) and phospholipids. Because phospholipids are a constituent of cell membranes in muscle fibres, their amount in muscle remains almost constant throughout fattening
(Wood et al., 2008). In the case of subcutaneous fat (SF), the proportion of
phospholipids is low and unimportant. As the adipose tissue develops, the endogenous synthesis of SFA and MUFA increases and results in a greater accumulation of neutral lipids in the adipocytes. This leads to a differential composition of these two fractions. The phospholipids have a higher PUFA content than the neutral lipids (Leseigneur-Meynier & Gandemer (1991) reported values of 33−40% and 7−15%, respectively) and, particularly, C20:4 content is also proportionally higher in the phospholipid fraction with respect to the other PUFA. When IMF content increases, so does the neutral lipids fraction (and so, SFA and MUFA), while the phospholipids fraction (and so, PUFA) relatively decreases. Thus, the SFA and MUFA are positively correlated with the IMF content, and the PUFA negatively (e.g., Cameron & Enser, 1991; Yang et al., 2010). Also, because SFA and MUFA are mostly synthesized endogenously, the correlations among them are positive (mean value reported by Cameron & Enser (1991): 0.59), but they are negatively correlated with PUFA (−0.62), which, on the other hand, have a dietary origin and are also positively correlated among them (0.70).
I.2.2. Diet
are deposited in SF and in muscle as they are intaken. As a consequence, pig adipose tissues reflect the fatty acid composition of the diet. Feeds with supplementary fatty acids have been proved a successful strategy in modifying the composition of fat in pig. There has been particular interest for omega-3 PUFA. Because in pigs C18:2 and C18:3 are essential fatty acids (i.e., they cannot be synthesized endogenously), their contents can be easily modified by the diet. Reported experiments indicate that it is possible to increase the C18:2 content from 10-15% to over 30% only by supplementing it in the diet (Wood et al., 2003), but then adverse consequences on sensory attributes can appear. Similarly, the C18:1 content can also be modified by the diet, without negatively altering the organoleptic quality (Rhee et al., 1990; Myer et al., 1992; Klingenberg et al., 1995). The paragon of this strategy is the acorn-fed Iberian pigs, whose fresh ham can reach C18:1 contents up to ~55% (Tejeda et al., 2002). However, because the C16 and C18 SFA and MUFA can be synthesized endogenously, their final content is less affected by the diet than the PUFA content (Wood et al.,
2008). In pigs, the de novo synthesis could produce 86% of total deposited
non-essential fatty acids (Kloareg et al., 2007). This is likely to happen especially in
genetically fatter pigs where de novo synthesis has a greater relative impact, although
de novo synthesis could be reduced when high amounts of fat are fed (Flachowsky et al., 2008).
Another downside of this approach is that it has been observed that the fatty acid supplementation in the diet is less effective in modifying the IMF composition than that of the SF (Duran-Montgé et al., 2008; Flachowsky et al., 2008), probably because of the higher neutral lipids content of SF (the composition of structural lipids in IMF is more stable). For example, in a study by Klingenberg et al. (1995) pigs were fed during 8 weeks either with a control diet containing beef tallow or with an experimental diet containing high-oleic acid sunflower oil. The C18:1 content of the experimental diet was 1.92 folds that of the control, but C18:1 of animals in the experimental group resulted to be only 1.07-fold in IMF and 1.18-fold in SF. In this experiment, diet also
affected the activity of the stearoyl-CoA desaturase (SCD), responsible of desaturing
C18:0 into C18:1 and, consequently, the desaturation index C18:1/C18:0, in SF but not in IMF. Other experiments provided mixed results. In the trials by Mas et al. (2010, 2011), a high-oleic diet with 1.53 folds the C18:1 of the control treatment was fed to crosses of Landrace × Large White with either Pietrain or Yorkshire. While in one trial C18:1 in IMF increased more than in SF (1.13 vs. 1.08 folds those of the control treatment, respectively), in the other a significant increase was found only in SF.
low-protein diets, the intramuscular SCD low-protein expression and activity were also increased, resulting in increased desaturation index C18:1/C18:0 in muscle. Wang et al.
(2012) provided further evidence of the up-regulation of the SCD gene expression in
low-protein diets. Interestingly, the expression of lipogenic genes was up-regulated and
that of lipolytic genes down-regulated. As a consequence of the increased IMF de novo
synthesis, C18:1 and MUFA contents increase (Wang et al., 2012; Wood et al., 2013).
Cost of the high-oleic raw ingredients and penalty in the feed conversion ratio are other factors that may limit the application of these diet-based strategies.
I.3. GENETIC STRATEGIES TO IMPROVE INTRAMUSCULAR FAT CONTENT AND COMPOSITION
During the last decades, most breeding schemes have focused on performance traits, such as average daily gain, feed conversion ratio, and lean content. Due to the negative genetic correlation of IMF with carcass leanness (from −0.55 to −0.07, as reviewed by Sellier, 1998) and positive with carcass fatness (from 0.04 to 0.60, according to the same review), these breeding programs have reduced IMF content in pig meat below the recommended values (Bejerholm & Barton-Gade, 1986; DeVol et al., 1988; Wood et al., 2008). This led to a diminution in the sensory attributes of pork. During the 1970s and 1980s, some authors already alerted that the improvement of lean content in pig meat was leading to poorer meat sensorial quality (Judge, 1972, as cited by Martin & Fredeen, 1974; Kempster et al., 1986). However, despite of the positive genetic correlation between IMF and pork overall acceptability (from 0.54 to 0.68; Sellier, 1998), acceptability by consumers was not negatively affected (Kempster et al., 1986). Schwab et al. (2006) used frozen semen of Duroc sires from the 1980s to compare the meat quality of their offspring with that of current sires. Results showed that improvement of the leanness during the last decades had been accompanied by a reduction of IMF and instrumental tenderness, and by worse flavor scores. In a similar way, in another Duroc line selected for lean growth efficiency, a reduction of IMF content was observed together with reduced meat quality despite that a causal link between them was not established (Lonergan et al., 2001). This was also observed in Large White by Cameron et al. (2000), who showed that selection for the components of efficient lean growth reduced IMF and increased its PUFA content, but, in this case, unfavorable changes in flavor and acceptability were very low, maybe because IMF level was already very low (around 1%).
The new challenge for pig industry is to improve simultaneously the performance and meat quality traits or, at least, to improve some of them without penalizing the others. While diet modification is a feasible strategy, genetics can be an equally effective complementary approach.
I.3.1. Duroc crosses
The Duroc breed is characterized by its high IMF in relation to the other common breeds (Large White, Landrace, and Pietrain) and, because of this, it has been widely used in commercial crosses to improve meat quality (Oliver et al., 1994). In Spain, the Duroc breed is also used both as purebred and as Iberian-crossed (BOE, 2014) for dry-cured ham production. Duroc (sire) × Iberian (dam) crosses are aimed to improve production performance of Iberian pigs without penalyzing their IMF content as much as crossing with leaner breeds could (Tejeda et al., 2002; Ventanas et al., 2007).
I.3.2. Direct selection
Because there exists genetic variance within breed (De Smet et al., 2004; Cilla et al., 2006; Solanes et al., 2009), it is possible to select for IMF content and composition traits. The heritability of IMF has been found to be high, as well as that of fatty acids content. A wide range of heritability estimates have been reported for IMF, from 0.26 to 0.86, with an average of 0.50 (Sellier, 1998). Selection experiments have proved that IMF responds to selection but at the expense of increasing carcass fatness. In the experiment by Schwab et al. (2009), where IMF was selected without restrictions, IMF increased by 2.12% after six generations, but there were unfavorable correlated
responses for BT (+6.17 mm) and loin muscle area (−3.62 cm2). On the other hand,
selection for IMF did not affect growth performance and the meat of selected animals showed greater instrumental tenderness and best flavor scores. It has been argued that, because the unfavorable genetic correlation between IMF and leanness traits is moderate, there is room for independent manipulation of IMF and carcass lean growth (Clutter, 2011). Indeed, quite low genetic correlations have been reported for IMF with BT (0.24 to 0.64; Suzuki et al., 2005b; Solanes et al., 2009; Schwab et al., 2010; Yang et al., 2010), loin muscle area (−0.15 to −0.27; Schwab et al., 2010), and carcass lean meat content (0.02 to −0.38; Knapp et al., 1997). However, such a selection objective has been proved difficult in practice. After seven generations of selection, Suzuki et al. (2005b) achieved more than the desired genetic gain for IMF (+1.2%) but renounced to BT reduction.
Cameron (1990) and Cameron & Enser (1991), who, using Duroc and Large White data, estimated a high heritability for C18:1 in SF (0.69) but a much lower one for C18:1 in loin IMF (0.28). Like IMF, C18:1 had an unfavorable correlation with lean weight (−0.41; Cameron & Enser, 1991). However, it was not until the last decade that genetic parameters of fatty acids were further studied for different breeds, genetic lines, adipose tissues, and analytical methods. The unweighted average heritability for C18:1 across previous studies was 0.38 (range: 0.26−0.58) in IMF, mostly in loin (Suzuki et
al., 2006; Casellas et al., 2010; Ntawubizi et al., 2010; Sellier et al., 2010), 0.47 (range: 0.26−0.67) in SF (Fernández et al., 2003; Suzuki et al., 2006; Sellier et al.,
2010; Gjerlaug-Enger et al., 2011), 0.44 in intermuscular fat (Suzuki et al., 2006), and 0.69 in perirenal fat (Sellier et al., 2010). Some of these studies, however, used few and heterogeneous data and were designed for other purposes than estimation of genetic parameters, which makes some of the estimates not conclusive enough. The few available genetic correlation estimates for intramuscular C18:1 indicate a correlation structure similar to that for IMF, being 0.20−0.25 with average daily gain, −0.75 with carcass lean meat content, −0.06 with BT, 0.22 with loin muscle area, and only 0.10 with IMF (Suzuki et al., 2006; Ntawubizi et al., 2010). Overall, the genetic parameter estimates indicate that selection for C18:1 should be effective, but to our knowledge, there are no reports of the response of C18:1 to direct selection, and only some results showing a slight favorable correlated response after selection for IMF (Burkett et al., 2008).
The main problem for including IMF and fatty acid composition traits in the selection objectives of the breeding companies is that they are difficult to measure. Determination by chemical methods such as gas chromatography is the most accurate but laborious, time-consuming, and expensive. Therefore, it may be unsuitable if a large number of records are needed, for example, for accurate genetic evaluations. A faster and more cost-effective method using flow injection analysis/mass spectrometry has been developed specifically for intramuscular C18:1 (Muñoz et al., 2011).
However, it is still difficult to measure these traits in vivo in the selection candidates.
Biopsies (Bosch et al., 2009) allow the determination of both IMF and fatty acid composition in live pigs but they are likely to be restricted to experimental purposes due to ethical concerns. During the last years, several technologies have been developed for the indirect determination of these traits. Real-time ultrasound predicts IMF in vivo (Newcom et al., 2002, 2005), while computed tomography predicts IMF in
carcasses but it does not seem reliable in vivo (Kongsro & Gjerlaug-Enger, 2013). The
in all post-mortem measurements, full traceability of carcasses or primal cuts, which in practical terms can be rather difficult to achieve in most current pig breeding schemes.
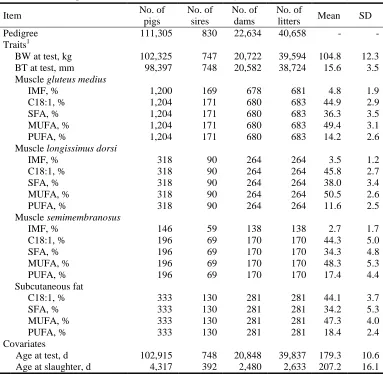
Due to the difficulty and cost of sampling muscles of interest, measures of IMF and C18:1 are usually taken on a single muscle, mostly the loin, or on SF. However, it is known that the pattern of fatty acid deposition may differ between IMF and SF (Duran-Montgé et al., 2008; Sellier et al., 2010; Bosch et al., 2012), across muscles (Sharma et al., 1987; Leseigneur-Meynier & Gandemer, 1991; Kim et al., 2008), and even among locations within a specific tissue (Sharma et al., 1987, Faucitano et al., 2004; Franco et al., 2006). Thus, to develop adequate recording and genetic evaluation schemes for IMF and fatty acid composition traits, there is a need to know the correlation structure of these traits across valuable muscles and with SF. The few reports available giving phenotypic correlations of fatty acids contents in different tissues show positive but low-to-moderate values (0.19−0.57 between fatty acids in IMF and SF; Suzuki et al., 2006; Yang et al., 2010). Regarding C18:1, the phenotypic correlation between its content in IMF and in SF has been estimated to be 0.33−0.45 and the genetic correlation 0.66−0.72 (Suzuki et al., 2006; Yang et al., 2010). A
phenotypic correlation of 0.35 was found between C18:1 in muscles longissimus dorsi
and gluteus medius (Rauw et al., 2012), but genetic correlations between muscles are not available and, therefore, it remains unclear to what extent selection for C18:1 based on records from a particular muscle or SF would be successful in modifying C18:1 in other muscles.
I.3.3. Marker-assisted and genomic selection
Genetic markers have been proposed as a useful tool to select for traits that are difficult to measure in the selection candidates, such as meat quality traits. Under a marker-assisted selection scheme, genetic lag and prediction error are expected to be reduced in comparison to selection schemes based on phenotypes of slaughtered littermates (Grindflek et al., 2001). During the last decades, a lot of efforts have been
put into the detection of quantitative trait loci (QTL) affecting IMF content and fatty
validated in purebred lines, markers have not been introduced in commercial breeding programs (Dekkers, 2004, 2012). The onset of high-density genotyping arrays has enabled a more precise scanning of the genome to detect QTL and quantitative trait
nucleotides (QTN). The first genome-wide association studies (GWAS) for fatty acid
composition in swine have already been performed in Iberian × Landrace (Ramayo-Caldas et al., 2012; Muñoz et al., 2013b) and in White Duroc × Erhualian and Chinese Sutai pigs (Yang et al., 2013). This technology can also be used to make genomic predictions of breeding values (Meuwissen et al., 2001), but the accuracy of genomic prediction for IMF content and fatty acid composition in swine has not been assessed yet.
To date, association with fatty acid traits has been reported for some candidate
genes. One of the most promising is the SCD gene. Stearoyl-CoA desaturase has a
direct role in the MUFA biosynthesis pathway as it is the responsible for catalyzing the
desaturation at the Δ9
position of stearoyl-CoA and palmitoyl-CoA into oleoyl-CoA
and palmitoleoyl-CoA, respectively. The SCD gene maps to Sus scrofa chromosome
(SSC) 14 at 120.96−120.98 Mb, which co-localizes with some previously detected QTL for the C16 and C18 SFA and MUFA in purebred and crossed Duroc (Sanchez et al., 2007; Quintanilla et al., 2011; Uemoto et al., 2012c). Findings so far support that
there is genetic variation in the SCD gene affecting fatty acid composition of muscle
and adipose tissue. Several single nucleotide polymorphisms (SNPs) in the SCD
promoter region have been associated to C16 and C18 SFA and MUFA content both in IMF and SF, but results are not conclusive yet, as either the location of haplotypes is not coincident (Uemoto et al., 2012b; Maharani et al., 2013), favorable alleles are swapped (Renaville et al., 2013), or even no association was found (Bartz et al., 2013). Suzuki et al. (2006) suggested that a selection strategy for fatty acid composition
targeting SCD might be effective, but genetic markers in the SCD gene will not be
suitable for implementation in breeding schemes until the association between these SNPs and pork fatty acid composition is further validated and better understood.
Other functional candidate genes that at some point have been found to affect
fatty acid composition include the microsomal triglyceride transfer protein (MTTP)
(Estellé et al., 2009), the acetyl-CoA carboxylase α (ACACA) (Gallardo et al., 2009),
the heart fatty acid binding protein (FABP3) (Lee et al., 2010), the leptin receptor
(LEPR) (Galve et al., 2012), the elongase of very long chain fatty acids 6 (ELOVL6)
(Corominas et al., 2013), the insulin-like growth factor 2 (IGF2) (López-Buesa et al.,
2014), and the melanocortin 4 receptor (MC4R) (López-Buesa et al., 2014).
traits (Weigel et al., 2009; Vazquez et al., 2010). The great cost of genotyping large amount of individuals in commercial conditions and the shorter generation interval than in cattle are some factors often referred as limiting the implementation of genomic selection schemes in the pig industry (Blasco & Toro, 2014). Low-density marker panels could reduce the genotyping costs, thereby offering an attractive opportunity.
I.4. IN THIS THESIS DISSERTATION
A priority of the Pig Breeding and Genetics Group of the University of Lleida is to carry on research on the genetic selection for IMF content and fatty acid composition in pig for the ultimate benefit of consumers and the industry. The present thesis dissertation has been developed in the frame of this on-going research and focuses mainly on exploring the genetic strategies for improving IMF and C18:1 of pork. It comprises seven chapters that are divided into three parts.
Part 1 comprises Chapter 1 and deals with the proper methodology for the statistical analysis of fatty acid composition. A fact about fatty acid compositions that has been widely ignored in meat science research is that from the mathematical point of view they are, as the name itself indicates, compositional data. Compositional data have specific mathematical properties because they represent relative, rather than absolute, information. Therefore, they should not be analyzed using standard statistical techniques that are defined in the real space, which has an absolute scale. Although specific methods for compositional data have been developed since the 1980s (Aitchison, 1986), there is no reference in the literature where they have been used for fatty acid data in meat research. In Chapter 1, we discussed the implications of adopting or not the compositional data statistical approach to analyze fatty acid compositions.
experiment specifically conceived to increase C18:1, as well as the correlated response of C18:1 to the selection described in Chapter 4.
Part 3 explores marker-assisted selection as a strategy to enhance the genetic responses of IMF and C18:1. Here, it is hipothesized that there are nucleotide polymorphisms in candidate genes with potential for being used as genetic markers for IMF and C18:1. Chapter 6 includes the search and validation of genetic variants in the
SCD gene, the most relevant one in the biosynthesis of C18:1. Then, a GWAS is
performed to detect other polymorphisms associated with IMF and fatty acid composition traits across the whole genome (Chapter 7). Chapter 7 concludes with a discussion on the use of genomic data for improving breeding value estimation and selection for IMF and C18:1.
Finally, in the Discussion section, opportunities for genetic breeding value evaluation combining phenotypic records on slaughtered relatives and information from genetic markers are considered. In light of the results obtained in Parts 2 and 3, several scenarios are discussed on how to implement selection for IMF and C18:1 in practice.
Objectives
The main objective of this research was to analyze the genetic determinism of
intramuscular fat (IMF) content and fatty acid composition, particularly of oleic acid
(C18:1) content, in pork. A second objective was to find strategies to genetically improve IMF and C18:1 in the context of a breeding programme of a Duroc line aimed at producing high quality fresh and cured pork products.
For this purpose the following specific objectives were formulated:
1. To examine the implications of using a compositional data approach in the
statistical and genetic analyses of fatty acid compositions.
2. To estimate the genetic parameters of IMF and C18:1 and their expected
selection responses if other economically important traits are included in the selection objective.
3. To prove experimentally whether backfat thickness and carcass lean growth
can be modified regardless of IMF and C18:1.
4. To prove experimentally whether C18:1 responds to selection.
5. To assess how selection for IMF and C18:1 in a particular muscle or
subcutaneous fat affects these traits in other muscles and fat tissues.
6. To search sequence variations in the stearoyl-CoA desaturase (SCD) gene
associated with saturated and monounsaturated fatty acids content.
7. To identify other candidate regions associated to IMF content and fatty acid
composition by means of a genome-wide association study.
8.
To explore the use of genetic markers and genomic selection as a way toAnimals and Samples
Data from a purebred Duroc line were used for the analyses. This line is primarily used for producing high quality dry-cured hams. The line was completely closed in 1991 and since then it has been selected for an index including body weight
(BW), backfat thickness (BT), and intramuscular fat (IMF) content (Tibau et al., 1999;
Solanes et al., 2009). The data set currently consists of 119,390 pedigree-connected pigs, from which 110,855 have at least one recorded trait. Pigs with records were born from 1996 to 2013. At approximately 75 d of age, piglets were moved to the fattening units, where they were penned by sex (8 to 12 pigs/pen) until slaughter. All pigs were performance-tested at an average age of 180 d for BW (n=110,165) and BT (n=106,276). Backfat thickness was ultrasonically measured at 5 cm off the midline at the position of the last rib (Piglog 105, SFK-Technology, Herlev, Denmark). During
the test period, pigs had ad libitum access to commercial diets.
Since 2002, 1,391 of the purebred barrows used for producing dry-cured ham were taken for recording IMF and C18:1. Barrows were castrated within the first week of age. Two barrows per litter were taken and raised in 17 batches. From 160 d onwards, barrows were fed a commercial pelleted finishing diet (Esporc, Riudarenes, Girona, Spain). Feed composition was similar along the years, with an average composition of 17.2% crude protein, 5.8% fiber, and 6.5% fat (C16:0, 18.0%; C18:0, 6.9%; C18:1, 34.4%; and C18:2, 29.7%). Feed in each batch was analyzed in triplicate as described in Cánovas et al. (2009). At the end of the finishing period, the barrows were slaughtered in the same commercial slaughterhouse at around 210 d (at ~125 kg
of BW). After slaughter, the carcass weight (CW) and the carcass length were
measured. The carcass length was measured from the anterior edge of the symphysis pubic to the recess of the first rib. Carcass BT and loin thickness at 6 cm off the midline between the third and fourth last ribs were measured by an on-line ultrasound automatic scanner (AutoFOM, SFK-Technology, Herlev, Denmark). The carcass lean percentage was estimated on the basis of 35 measurements of AutoFOM points by using the official approved equation (OJ, 2001) and the carcass lean weight was calculated using CW and lean percentage. Immediately after slaughter, samples of
subcutaneous fat (SF; n=343), muscle semimembranosus (SM; n=200), and liver
(n=96) were collected. After chilling for about 24 h at 2ºC, each carcass was divided into primal cuts and the left side ham was weighed. Each ham was trimmed according to customary procedure used for manufacturing traditional dry-cured Spanish ham.
Immediately after quartering, samples of at least 50 g of muscle gluteus medius (GM;
n=1,383) were collected from the left side ham. A section of around 1 kg from the left
loin (muscle longissimus dorsi; LD) of each carcass at the level of the third and fourth
collected at the same location than either the LD (n=210) or the GM (n=133) samples.
Additional samples of muscle latissimus dorsi (LT; n=85) were collected from the left
side shoulder. Samples were immediately vacuum-packaged, and stored in deep-freeze conditions (at −20ºC) until required for IMF and C18:1 determination. Storage time does not affect fatty acid composition (De Pedro et al., 2000).
After muscle samples were completely defrosted and vacuum drip losses were eliminated, the dissected muscle, trimmed of subcutaneous and intermuscular fat, was minced. A representative aliquot from the pulverized freeze-dried muscle was used for fat analysis. Intramuscular fat content and composition was determined in duplicate by quantitative determination of the individual fatty acids by gas chromatography (Bosch et al., 2009). Fatty acid methyl esters were directly obtained by transesterification using a solution of 20% boron trifluoride in methanol (Rule, 1997). Methyl esters were
determined by gas chromatography using a capillary column SP2330
(30 m × 0.25 mm; Supelco, Bellefonte, PA) and a flame ionization detector with helium as carrier gas at 1 ml/min. Runs were made with a constant column head pressure of 172 kPa. The oven temperature program increased from 150 to 225°C at 7°C/min, and injector and detector temperatures were both 250°C. Quantification was
carried out through area normalization after adding into each sample 1,2,3-tripentadecanoylglycerol as internal standard. Intramuscular fat content was
calculated as the sum of each individual fatty acid expressed as triglyceride equivalents (AOAC, 1997) and expressed as percentage of fresh matter. Fatty acids were identified by comparing their relative retention times with those of the external standard and confirmed by comparing their mass spectra to the computer library of the gas-liquid chromatography/mass spectrometry databases Wiley 275 K and NBS 75 K (Agilent Technologies, Wilmington, DE). Fatty acids were analyzed on a simple quadrupole instrument (GC/MSD 6890N-5973N, Agilent Technologies, Wilmington, DE) equipped with an electron ionization source using the same temperature program as described above. The scanned mass range of fatty acids was m/z 35 to 450 and the scanning rate 3.46 scans/s. The complete profile for each sample included saturated
(SFA; C14:0, C16:0, C18:0, and C20:0), monounsaturated (MUFA; C16:1n-7,
C18:1n-9, and C20:1n-9), and polyunsaturated (PUFA; C18:2n-6, C18:3n-3, C20:2n-6,
Chapter 1.
On the compositional analysis of fatty acids in pork
R. Ros-Freixedes & J. Estany
Departament de Producció Animal, Universitat de Lleida − Agrotecnio Center, 191 Av. Alcalde Rovira Roure, 25198 Lleida, Catalonia, Spain.
The content of this chapter was published in Journal of Agricultural, Biological, and Environmental Statistics (2014), 19: 136−155. DOI: 10.1007/s13253-013-0162-x
The authors wish to thank Dr. Juan José Egozcue, Univeristat Politècnica de Catalunya, for his helpful advice.
1.1. INTRODUCTION
The quality of fat is a feature becoming increasingly important for both the industry and consumers. Currently, there is enough evidence indicating that fat quantity and quality affect the nutritional, sensory, and technological properties of animal products, particularly pork (Wood et al., 2003; Schmid, 2010). Fat quality is chemically defined in terms of fatty acid composition, which is commonly presented as a set of percentages corresponding to the relative content of each individual fatty acid (or the sum of some of them) with respect to the total content of the fatty acids that had been determined, i.e., as a vector of positive values whose sum is a constant. Technically, this sort of data is what in statistics is known as compositional data, i.e., multivariate data where the variables represent parts of a whole (Pawlowsky-Glahn & Egozcue, 2006). Compositional data are intrinsically multivariate because each component cannot be interpreted without relating it to any of the other components. They only represent relative information and therefore standard statistical techniques, which were conceived to deal with variables measured on an absolute scale, are inappropriate. Consequently, specific methods for compositional data analysis have been developed since the 1980s (Aitchison, 1982; Aitchison, 1986; Aitchison & Egozcue, 2005; Bacon-Shone, 2011). To our knowledge there is no reference in the literature where compositional data analysis had been applied to meat quality research.
1.2. DESCRIBING THE CASE STUDY
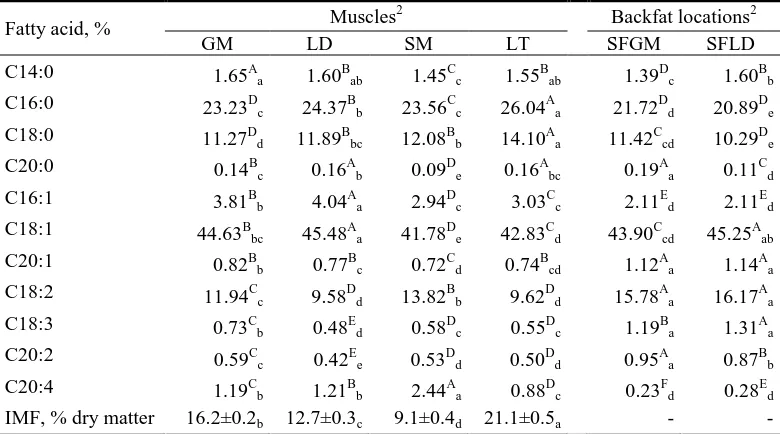
The case study comprises data from 971 purebred Duroc barrows (see Animals and Samples Section). The pigs were raised at a carcass market weight of around 95−100 kg in twelve commercial batches from 2001 to 2008 (Table 1.1). All pigs had
ad libitum access to a commercial feed and were slaughtered at the same abattoir.
There, a sample of the muscle gluteus medius (GM) was collected from the left ham of
all pigs. Moreover, in randomly chosen subgroups of them, additional samples of the
muscles longissimus dorsi (at the level of the third and fourth last ribs; LD),
semimembranosus (SM), and latissimus dorsi (LT) were also taken, as representative muscles of the loin, ham, and shoulder, respectively. Finally, two samples of the
subcutaneous backfat (SF) were obtained at the positions where GM (SFGM) and LD
(SFLD) muscle samples were taken. The number of samples per muscle and backfat
location by batch is detailed in Table 1.1. Samples were collected and analyzed for
intramuscular fat (IMF) content and fatty acid composition as detailed in the Animals
and Samples Section. The complete profile for each sample included saturated (SFA;
C14:0, C16:0, C18:0, and C20:0), monounsaturated (MUFA; C16:1n-7, C18:1n-9, and
C20:1n-9), and polyunsaturated (PUFA; C18:2n-6, C18:3n-3, C20:2n-6, and
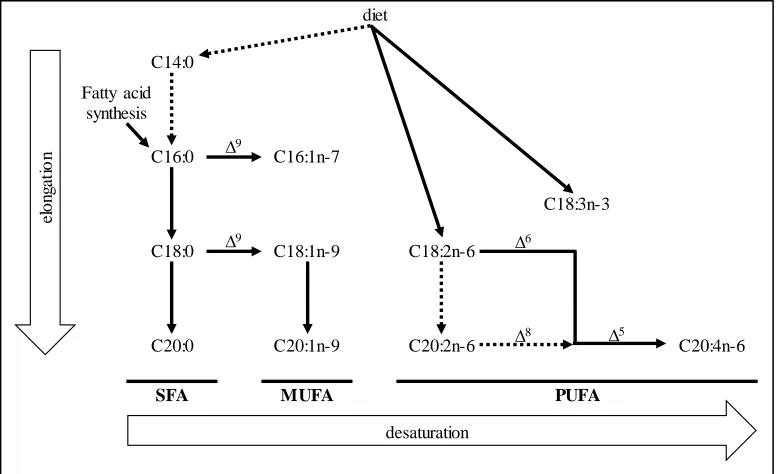
C20:4n-6) fatty acids (Figure 1.1). Because C20:0 is present at very low levels, it was not detectable in a few samples. The zero values represent a mathematical challenge for compositional data, which only represent relative magnitudes. To solve this problem several replacement strategies have been proposed (Martín-Fernández &
Table 1.1. Number of animals (n), age at slaughter (Age), carcass weight (CW), and number of samples per muscle and backfat location by batch.
Batch n Age, d (SD) CW, kg (SD) Sample
1
GM LD SM LT SFGM SFLD 1 109 215.8 (5.3) 90.9 (11.3) 109 52 51 42 15 - 2 105 214.0 (3.4) 95.9 (10.6) 104 54 54 43 15 - 3 68 203.1 (6.4) 94.7 (7.8) 66 - 27 - - 27 4 72 200.9 (8.2) 91.0 (10.2) 72 - 20 - - 48 5 112 223.2 (3.8) 104.3 (12.0) 112 24 - - - 24 6 74 220.6 (4.0) 100.1 (7.7) 73 33 - - - 32 7 32 220.7 (0.8) 100.0 (8.8) 31 31 - - - 31 8 58 195.8 (1.9) 92.0 (9.2) 58 - - - 28 - 9 51 206.5 (1.7) 97.5 (10.0) 51 - - - 30 - 10 94 230.9 (2.1) 104.0 (10.7) 93 - - - 15 - 11 110 217.5 (1.7) 107.4 (8.9) 110 - - - 15 - 12 86 204.1 (2.9) 94.2 (10.1) 85 - - - 15 - Total 971 213.8 (10.7) 98.4 (11.7) 964 194 152 85 133 162
1 GM: gluteus medius muscle; LD: longissimus dorsi muscle; SM: semimembranosus muscle;
Figure 1.1. Main metabolic pathways for the fatty acids considered in the case study (adapted from Cook and McMaster, 2002). Discontinuous arrows indicate less important pathways.
Thió-Henestrosa, 2006; Palarea-Albaladejo et al., 2007). For its simplicity, we followed here the strategy in Sanford et al. (1993) and replaced the zeros by 0.55 times the lowest measured value in each tissue before calculating the fatty acid percentages.
1.3. SETTING THE PROBLEM
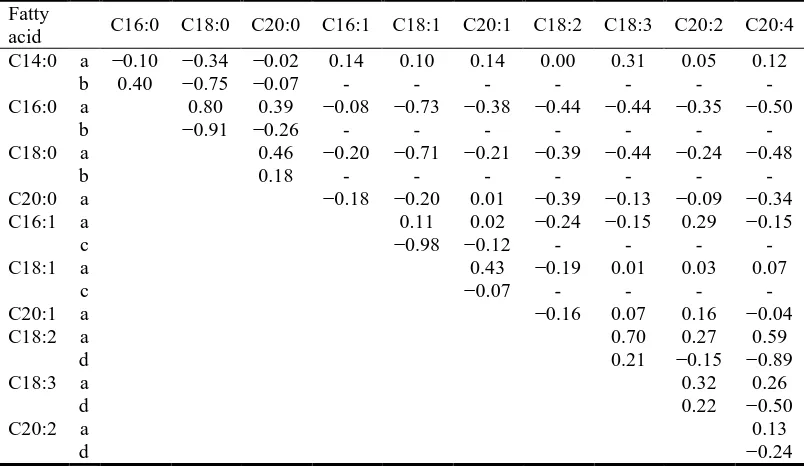
One of the drawbacks of analyzing compositional data with conventional methods is that the results can be subcompositionally incoherent (Aitchison, 1986, Chapter 3; Pawlowsky-Glahn & Egozcue, 2006). This becomes particularly evident in correlation analyses, where the correlation coefficient between two given components can differ depending on whether they are expressed relative to a set of components or another. In order to highlight this problem we calculated the correlation between pairs of fatty acids under two different compositional settings. In the first one, the correlation matrix among the complete 11-part fatty acid profile of GM was calculated (Table 1.2, rows a), while, in the second, the correlation was calculated between each SFA, MUFA, and PUFA expressed relative to the total SFA, MUFA, or PUFA, respectively, in such a way that, for instance, C14:0, C16:0, C18:0, and C20:0 summed up to 100% (i.e., the SFA subcomposition was closed). Then, the correlations among the fatty acids in each subcomposition (SFA, MUFA, and PUFA) were recalculated
diet
C14:0
C16:0 C16:1n-7
C18:3n-3
C18:0 C18:1n-9 C18:2n-6
C20:0 C20:1n-9 C20:2n-6 C20:4n-6
SFA MUFA PUFA
∆9
∆9 ∆6
∆8 ∆5
el
on
ga
ti
o
n
desaturation Fatty acid
Table 1.2. Correlations among raw fatty acid percentages in gluteus medius when expressed relative to either the full fatty acid composition (rows a) or the corresponding saturated (rows b), monounsaturated (rows c), and polyunsaturated (rows d) fatty acid subcompositions.
Fatty
acid C16:0 C18:0 C20:0 C16:1 C18:1 C20:1 C18:2 C18:3 C20:2 C20:4 C14:0 a −0.10 −0.34 −0.02 0.14 0.10 0.14 0.00 0.31 0.05 0.12
b 0.40 −0.75 −0.07 - - - - C16:0 a 0.80 0.39 −0.08 −0.73 −0.38 −0.44 −0.44 −0.35 −0.50
b −0.91 −0.26 - - - - C18:0 a 0.46 −0.20 −0.71 −0.21 −0.39 −0.44 −0.24 −0.48
b 0.18 - - - - C20:0 a −0.18 −0.20 0.01 −0.39 −0.13 −0.09 −0.34 C16:1 a 0.11 0.02 −0.24 −0.15 0.29 −0.15
c −0.98 −0.12 - - - - C18:1 a 0.43 −0.19 0.01 0.03 0.07
c −0.07 - - - - C20:1 a −0.16 0.07 0.16 −0.04 C18:2 a 0.70 0.27 0.59
d 0.21 −0.15 −0.89 C18:3 a 0.32 0.26
d 0.22 −0.50
C20:2 a 0.13
d −0.24
(Table 1.2, rows b, c, and d, respectively). As can be seen in Table 1.2, the two correlations were not consistent, with the discrepancy being particularly relevant for those between C16:0 and C18:0, C16:1 and C18:1, and C18:2 and C20:4, which changed, respectively, from 0.80 to −0.91, 0.11 to −0.98, and 0.59 to −0.89. These changes, both in magnitude and sign, are due to the fact that components in
compositional data do not vary independently. It can be proven that for a D-part
composition x = [x1, x2, ..., xD], if x1 + x2 + ... + xD = κ (where κ is a constant, often 1
or 100%), then cov(x1, x2) + cov(x1, x3) + ... + cov(x1, xD) = −var(x1). Therefore, at
least one of the covariances of x1 with the other components must be negative (Pearson,
[image:40.499.49.451.121.354.2]1.4. OVERVIEW OF COMPOSITIONAL ANALYSIS
Compositional data need to be statistically treated considering that they only carry relative information. Two general approaches have been developed to deal with them. The first is known as staying-in-the-simplex approach. It operates in the
so-called simplex space (SD, for D-part compositions) and uses the Aitchison geometry
(Aitchison, 1986, Chapter 2). The second approach resorts to log-ratio transformations (Aitchison, 1986, Chapter 7; Egozcue et al., 2003) to map the simplex to the real space, where the more familiar Euclidean geometry is used and standard statistics methods can be applied. Both approaches can be used complementarily depending on which geometrical framework is preferred. A brief description of both approaches is given below. Some software has been developed to easily process and analyze compositional data, such as the freeware CoDaPack (Thió-Henestrosa & Martín-Fernández, 2005;
Comas-Cufí & Thió-Henestrosa, 2011a,b) and the R packages compositions (van den
Boogaart et al., 2011) and robCompositions (Templ et al., 2011).
1.4.1. Staying-in-the-simplex
The simplex vector space is defined by the internal simplicial operation of perturbation, the external operation of powering, and the simplicial metric. The operations of perturbation,
(1.1),
and powering,
(1.2),
where x (y) is a D-part composition, xi (yi) are the percentages for each part (i = 1, 2,
..., D), a is a scalar, and C is the closure operator to constant κ (rescaling through
division of each part by their total sum), are the equivalent to translation and scalar multiplication in the real space, respectively. The staying-in-the-simplex approach requires an algebra that differs from the one used in standard statistics.
An example of this algebra is found in the calculation of descriptive statistics. The mean and the variance are not suitable statistics for compositional exploratory analyses (Daunis-i-Estadella et al., 2006) and therefore they are replaced in the
Aitchison geometry by the centre (g) and the variation matrix (T), respectively. The
centre or geometric mean is defined as:
(1.3),
𝐱 ⊕ 𝐲 = 𝑥1, 𝑥2, … , 𝑥𝐷 ⊕ 𝑦1, 𝑦2, … , 𝑦𝐷 = 𝐶 𝑥1𝑦1, 𝑥2𝑦2, … , 𝑥𝐷𝑦𝐷
𝑎 ⊙ 𝐱 = 𝑎 ⊙ 𝑥1, 𝑥2, … , 𝑥𝐷 = 𝐶 𝑥1𝑎, 𝑥2𝑎, … , 𝑥𝐷𝑎 = 𝐶(𝐱𝑎)
𝐠 = 𝐶 𝑥1𝑗 𝑛
𝑗 =1
1 𝑛
, 𝑥2𝑗 𝑛
𝑗 =1
1 𝑛
, … , 𝑥𝐷𝑗 𝑛
𝑗 =1
where xij are the percentages for each part (i = 1, 2, ..., D) in sample j, and n is the
number of samples. Moreover, the compositions can be centered, i.e., moved to the
barycenter of the simplex, using x ⊕ (−1 ⊙ g) = x ⊕ g−1 (Pawlowsky-Glahn &
Egozcue, 2006). Centering is equivalent to subtracting the arithmetical mean in the
Euclidean space. The variation matrix is defined as T = [τij], with τij = var[ln(Xi/Xj)],
where Xi and Xj are the data vectors for the parts i and j across samples. Low variance
of a log-ratio indicates proportionality between the parts involved. The total variability
of the dataset is the sum of the variances of all log-ratios divided by 2D:
(1.4).
1.4.2. Log-ratio transformations
The two first log-ratio transformations were introduced by Aitchison (1986, Chapters 4 and 6) and the third by Egozcue et al. (2003). These log-ratio transformations make it possible to work on compositional data in the real space using Euclidean geometry.
1.4.2.1. Additive log-ratio
The additive log-ratio (alr) transformation is written in terms of log-ratios of
D−1 components relative to an arbitrary D component:
(1.5).
This transformation has the obvious disadvantage that the results are dependent on the chosen divisor component, which in turn does not have an equivalent for further analyses. But, most importantly, the alr-transformation is not isometric, i.e., distances are not preserved in the new metric space (Filzmoser & Hron, 2009).
1.4.2.2. Centered log-ratio
The centered log-ratio (clr) transformation is written in terms of the log-ratio of
each component relative to the geometric mean of all the components of an individual:
(1.6).
total-variance= 1
2𝐷 var ln 𝑋𝑖 𝑋𝑗 𝐷
𝑗 =1 𝐷
𝑖=1
alr 𝐱 = ln𝑥1 𝑥𝐷, ln
𝑥2 𝑥𝐷, … , ln
𝑥𝐷−1 𝑥𝐷
𝐳 = clr 𝐱 = ln 𝑥1 𝐷𝑖=1𝑥𝑖
1 𝐷, ln 𝑥2 𝐷𝑖=1𝑥𝑖
1 𝐷, … , ln 𝑥𝐷 𝐷𝑖=1𝑥𝑖
In the z = clr(x) transformation all parts of the composition have a direct equivalent, so that transformed variables can be easily traced back to the originals. Although the clr transformation is isometric, it is subcompositionally incoherent. Moreover, the covariance matrix of the clr-transformed variables is singular, which difficults the use of the clr transformation in multivariate statistical analyses requiring the inversion of this matrix. The clr transformation is mostly used in exploratory analysis. The so-called clr-biplots allow for a graphical representation of the distribution of the samples based on their composition. Moreover, the depiction of links (i.e., the vectors connecting the apexes of two variable rays) provides an easy-to-interpret representation of the log-ratios between the two involved components, where their length represents the standard deviation of the log-ratios and the cosine of the angle between two links the correlation between the two involved log-ratios. A complete description of clr-biplots and their interpretation is given in Aitchison & Greenacre (2002) and Daunis-i-Estadella et al. (2006). Conclusions only should be drawn from biplots that explain a large percentage of the total variance. An example is presented in Section 1.5.1.
1.4.2.3. Isometric log-ratio
The isometric log-ratio (ilr) transforms the raw composition to its coordinates in
an orthogonal system based upon an orthonormal basis (𝚿) (Egozcue et al., 2003). If 𝚿
is chosen following a sequential binary partition (Egozcue & Pawlowsky-Glahn, 2005),
the ilr-transformed components are called balances (bk, where k = 1, 2, ..., D−1). In a
sequential binary partition, 𝚿 is constructed by successive divisions of the set of parts
into two mutually exclusive groups (parts in one group are marked with the symbol + while parts in the complementary group with the symbol −) until only one part per group is left (see Table 1.3 for an example). To be interpretable, partitions should be
based on previous knowledge and experience. Then, 𝚿 is derived replacing the
symbols + and – by 1𝑟√𝑟+𝑠𝑟𝑠 and −𝑠1√𝑟+𝑠𝑟𝑠, respectively, where r (s) is the number of
parts marked with + (−) in each balance, with blanks being zero. Then, the balances
w = ilr(x) are calculated as w = z𝚿T, or directly, in terms of normalized log-ratios
between the geometric means of the two groups, as:
(1.7),
where 𝑥𝑘+ and 𝑥𝑘− represent the subsets of rk and sk parts in group + and − of the kth
balance, respectively.
b𝑘= 𝑟𝑟𝑘𝑠𝑘 𝑘+ 𝑠𝑘ln
𝑟𝑘 𝑥𝑘𝑖+ 𝑖=1
1 𝑟𝑘
𝑠𝑘 𝑥𝑘𝑗− 𝑗 =1
Table 1.3. Sequential binary partition of the 11-fatty acid composition for ilr-transformation.
Balance C14:0 C16:0 C18:0 C20:0 C16:1 C18:1 C20:1 C18:2 C18:3 C20:2 C20:4 1 − − − − − − − + + + + 2 − + + + + + +
3 − + + − + + 4 − + − −
5 − +
6 − + +
7 − +
8 + − + +
9 − − +
10 − +
Note that, as happens with the alr transformation, there are only D−1 balances
for a D-part composition, and that the balances may be different for each 𝚿. The
balances are isometric and subcompositionally coherent and, as a result, they can be analyzed using standard statistical techniques. However, because they do not have a one-to-one relation to the original components, their interpretation is not straightforward. This can be overcome by choosing, if it exists, a sequential binary partition leading to interpretable balances or, alternatively, back-transforming them
into interpretable D-part compositions lying in the simplex. Because compositions are
intrinsically multivariate, estimates on the full set of D−1 balances (for instance, either
least squares means or regression coefficients) must be jointly back-transformed as
x = C(e𝐰𝚿) (Tolosana-Delgado & van den Boogaart, 2011). In Sections 1.5.2 and 1.5.4
examples on the application of ilr-transforming and back-transforming are presented. However, it is not possible to back-transform the standard errors associated with least square estimates, but they can be substituted by the corresponding back-transformed confidence intervals. The use of balances is the best choice for correlations (Filzmoser & Hron, 2009), but they cannot be back-transformed either. If the sequential bipartition used does not lead to the desired balances, additional log-ratios can be calculated as
linear combinations of the initial D−1 set derived from 𝚿. For example, apart from the
balances derived from the sequential bipartition in Table 1.3 (b1 to b10) we could be
interested in the log-ratios of C18:1 and C18:0:
(1.8),
or, similarly, MUFA and SFA:
(1.9).
1 2ln
C18: 1 C18: 0=
3 2 b6−
1 2b7=
3 2
2 3ln
C18: 1 · C20: 1 C18: 0 −
1 2
1 2ln
C20: 1 C18: 1
12 7 ln
C16: 1 · C18: 1 · C20: 1
3
C14: 0 · C16: 0 · C18: 0 · C20: 0
4 =
1 2 2b2−
7 6 b4+
7 2 6b5+
The inclusion of more log-ratios can enrich the interpretation of the results but then it should be noted that the covariance matrix including the new log-ratios will be singular. An example of correlation analysis using balances is given in Section 1.5.5.
1.5. ANALYZING THE CASE STUDY
The basics of compositional analysis are illustrated in five examples using the pork fatty acid composition as a case study. The first is an exploratory analysis conducted to examine the differences between IMF and backfat for fatty acid composition (Section 1.5.1). The second and third introduce the procedures to compare the distinct tissues and muscles in terms of centers (Section 1.5.2) and variation matrixes (Section 1.5.3). In Section 1.5.4 a linear regression is used to assess the effect of IMF content on fatty acid composition. Finally, Section 1.5.5 illustrates how to interpret correlations among biologically meaningful balances. In Sections 1.5.2 and 1.5.4 the compositional and the standard approaches are compared.
1.5.1. Exploratory analysis
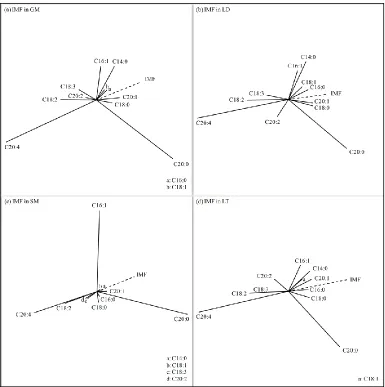
The distribution of fatty acid composition across muscles and backfat locations was first explored depicting the whole set of observations on a joint biplot (Figure 1.2).
To this purpose the dataset X was clr-transformed to Z, and then singular value
Figure 1.2. Score plot (a) and loading plot (b) of components 1 and 2 for fatty acid
composition of intramuscular fat (IMF) across muscles (GM: gluteus medius; LD:
[image:46.499.60.441.61.562.2]