Genetic studies of emotional behaviour in rats
209
0
0
Texto completo
(2) ACKNOWLEDGEMENTS We would never accomplish much if working alone. I am genuinely indebted to all those who helped and encouraged me during the four years of this project. My biggest thank you goes to my supervisors. Alberto, thank you for your support, your advice and your long skype calls whenever they were needed. Thank you for all your scientific imput in this thesis, despite being “más dura que el desierto de Tabernas”. Jonathan, thank you so much for your help, your supervision and your support during these four years. Joining the Flint lab has made my PhD an exciting and inspiring challenge, and that I have to thank to you. You have been an excellent mentor, and you have been always available and encouraging whenever things got difficult. Besides my supervisors, I am very grateful to other scientists whom have devoted time to support my work. A very special thank you goes to Richard Mott and his invaluable help, supervision and good advice in the chapter 6 of this thesis. I also want to thank David Bannerman for all the interesting discussions and support, as well as Peter Oliver for his advice and help. And a very special thank you goes to James Groves, who took lots of his time to teach me the most elemental concepts of molecular genetics, who generously shared his work and his knowledge, and always replied to all my calls for help. In the Flint group I need to thank everyone for all those little things that made everything better: Martina, GJ, Mona, James C., Amelie, Jerome, Andrew, Rosie, Cai Na, Jon Khron, Martin, Binnaz, Jessie, Leo, Rebekah, Amarjit and very specially Polinka for all her help. No me imagino cómo habrían sido todas las perfusiones e inyecciones sin ti. Y que hubiera hecho sin los cafés, y tus buenos consejos! I also want to mention Kirandeep Ghataorhe, Agnès perquè quan tu hi eres tot era MOLT més guai i no m’he refet mai!, and Regina per els “tu, tranquila”, els bons consells, i les tardes de Patisserie Valerie. A big shout out goes to “the house”. Robbie (maw), Kiran (coolio), Na (and how to kill a cow with a butter knife) and Maria (la Suciu!). You guys have been a big source of fun and good times, interesting scientific discussions, and life-‐saving cups of rooibos. Vull també agraïr al departament de Medicina Legal i Psiquiatria de la UAB el seu suport i la seva ajuda en tot moment, i mencionar especialment la Glòria, la Regina, el Toni, la Marta, i l’Esther. Tot i que definitivament hem rigut més junts que treballat junts, és molt especial trobar un grup de gent tan espectacular. Des dels “No me cuentes tus penas”, als berenars de la tarda, Amsterdam, Milà, i els moments d’estabulari dels inicis... sou el millor! And at risk of getting way too sentimental, a big thank you goes to those friends and family whom make my life better just by being in it: Adriana, Jared, Maria, Mitus i els meus pares (Anna i Guillem). . 2 .
(3) This work has received generous suport from the FPI scholarship (BES-‐2010-‐ 032398), the Wellcome Trust Centre for Human Genetics and University of Oxford, as well as the European projects/consortiums “EURATRANS” (grant agreement HEALTH-‐F4-‐ 2010-‐241504) and “EURATools (grant LSHG-‐CT-‐2005-‐ 019015), and from the MICINN (projects PSI2009-‐10532 and PSI2013-‐41872-‐ P), the “Fundació La Maratò TV3” (ref. 092630/31) and the “Direcció General de la Recerca” (ref. 2009SGR-‐0051). . . . . 3 .
(4) . . . 4 .
(5) Abbreviations . BAC: bacterial artificial chromosome BBB: blood brain barrier CA, CA1-‐CA3, CA2: Cornus Ammonis, subfields 1, 2 and 3 CY5: cyanine DAPI: 4',6-‐diamidino-‐2-‐phenylindole DNA: deoxyribonucleic acid DPX: Dibutyl phthalate in xylene DT: diphtheria toxin ES: embryonic stem cells FLP, Flpo: flippase, flipase O fMRI: functional magnetic resonance image FRT: flippase recognition target GABA: γ-‐Aminobutyric acid GFP: green fluorescent protein HB-‐EGF, EGF: heparin-‐binding epidermal-‐growth-‐factor-‐like growth factor hDTR: human diphtheria toxin receptor HPA: hypothalamus-‐pituitary-‐adrenal HS: heterogeneous stock IP: intraperitoneal LTP: long term potentiation MLS: membrane localisation signal NIH-‐HS: National Institute of Health-‐ Heterogeneous Stock NLS: nuclear localisation signal . . 5 .
(6) NMDA: N-‐methyl-‐D-‐aspartic acid pA: synthetic simian virus-‐40-‐polyadenilation signal PBS: phosphate buffered saline PCR: polymerase chain reaction POE: parent-‐of-‐origin effect QTL: quantitative trait locid RNA: ribonucleic acid SEM: standard error median SSR: site-‐specific recombination TRECK: toxin receptor mediated cell knockout TRITC: Tetramethyl Rhodamine Iso-‐Thiocyanate TUNEL: Terminal deoxynucleotidyl transferase dUTP nick end labeling UV: ultraviolet WT: wild type . . . . 6 .
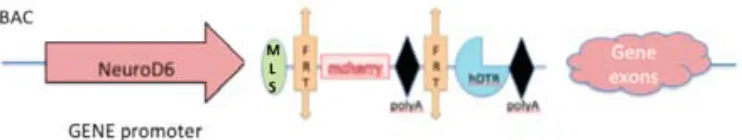
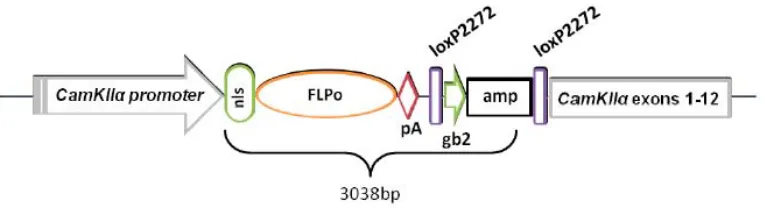
(7) INDEX . 1. ABSTRACT/RESUM.....................................................................................................11 2. GENERAL INTRODUCTION........................................................................................14 2.1. INTERVENTIONAL STUDY: GENETIC MANIPULATION OF THE BRAIN.....17 2.1.1. The hippocampus and the hippocampal formation: anatomy and morphology...............................................................................................................18 2.1.1.1. The hippocampus proper.............................................................................20 2.1.1.1.1. The dentate gyrus............................................................................20 2.1.1.1.2. The CA sub fields..............................................................................21 2.1.2. Hippocampal Connectivity....................................................................................22 2.1.2.1. The CA1-‐CA3 connectivity..............................................................................24 2.1.3. The function of the hippocampus......................................................................25 2.1.3.1. The declarative memory theory.................................................................................26 2.1.3.2. The cognitive map theory.............................................................................................28 2.1.3.3. The configural association theory.............................................................................30 2.1.3.4. The behavioral inhibition theory...............................................................................31 2.1.4. Brain interventions..................................................................................................33 2.1.4.1. Physical and chemical lesions..........................................................................33 2.1.4.2. Genetically modified models............................................................................34 2.1.4.2.1. Mice models.........................................................................................................34 2.1.4.2.2. Rat models............................................................................................................36 2.2. OBSERVATIONAL STUDY: GENETIC ANALYSIS OF BEHAVIOUR IN RODENTS.............................................................................................................................38 2.2.1. QTL mapping...............................................................................................................38 2.2.2. The rat heterogeneous stock.............................................................................40 2.2.3. Coping styles............................................................................................................42 3. AIM AND SCOPE............................................................................................................45 4. THE NEUROD6 TRECK RAT MODEL VALIDATION.............................................48 4.1. INTRODUCTION TO TRECK MODELS........................................................................49 4.1.2. The NeuroD6 hDTR rat........................................................................................51 4.1.2.1 The NeuroD6 hDTR construct.........................................................51 4.1.3 The CamkIIα-‐Flpo Rat...........................................................................................53 4.1.3.1 The CamkIIα-‐Flpo construct............................................................54 4.1.4. Generation of the Models...................................................................................55 . 7 .
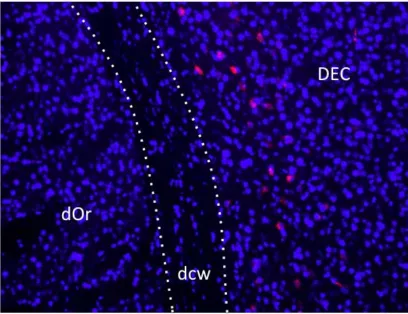
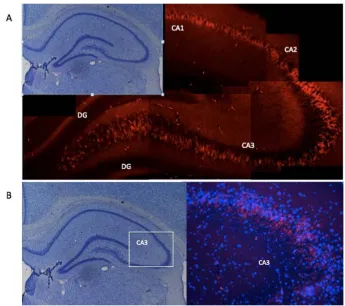
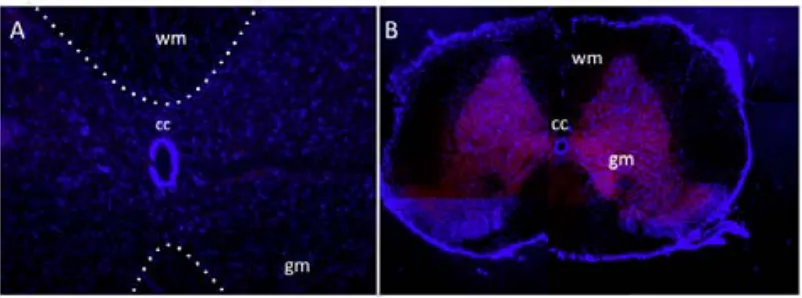
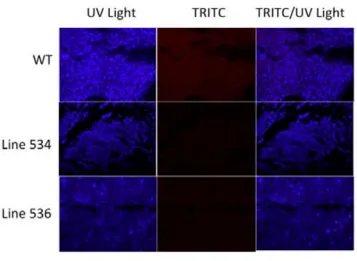
(8) 4.2. STUDY 1: VALIDATION OF THE NEUROD6-‐HDTR RAT MODEL.....................56 4.2.1. Genotyping through PCR...................................................................................................56 4.2.2.Visualization of the mCherry protein.............................................................56 4.2.2.1. Brain, Retina and Spinal Cord.........................................................58 4.2.2.1.1. Expression in the brain...................................................58 4.2.2.1.1.1. The entorhinal cortex....................................58 4.2.2.1.1.2. The secondary visual cortex.......................60 4.2.2.1.1.3. The CA1-‐CA3 fields.........................................61 4.2.2.1.1.4. The hilus..............................................................62 4.2.2.1.2. Expression in the retina..................................................63 4.2.2.1.3. Expression in the spinal cord.......................................64 4.2.2.2. Visualization in other body organs..............................................65 4.3. STUDY 2: VALIDATION OF THE NEUROD6 TRECK MODEL.............................69 4.3.1. Insertion of both constructs in the rat genome........................................69 4.3.2. Recombination and expression of both transgenes in the brain.......70 4.3.2.1. Assessing recombination using PCR product size.................71 4.3.2.1.1. Results comparing hippocampus samples.............73 4.3.2.1.2. Results comparing diverse body organs.................75 4.3.2.2. Assessing recombination through presence of mCherry...77 4.4. DISCUSSION..........................................................................................................................78 4.4.1. Validation of the NeuroD6 hDTR model.......................................................79 4.4.1.1. Expression in unexpected areas in the brain..........................80 4.4.1.2. Autofluorescence in Spleen and Kidneys..................................81 4.4.2. Validation of the NeuroD6 TRECK rat model.............................................81 4.4.2.1. Using the EXON and SPAN primers.............................................81 4.4.2.2. Histological analysis of mCherry expression..........................83 4.5. CONCLUSION........................................................................................................................84 5. DIPHTHERIA TOXIN EXPERIMENTS......................................................................86 5.1. INTRODUCTION........................................................................................................................87 5.2. STUDY 3: DIPHTHERIA TOXIN EXPERIMENTS.....................................................89 5.2.1. Experiment 1: Medium dosage testing........................................................................89 5.2.1.1. Experimental design...........................................................................90 5.2.1.2. Results......................................................................................................91 5.2.1.3. Perfusion day 7 versus perfusion day 28..................................94 5.2.2. Experiment 2: Acute high and low diphtheria toxin dosing................95 5.2.2.1. Experimental design........................................................................................................95 5.2.2.2. Results......................................................................................................96 5.2.3. Experiment 3: Toxin infusion...........................................................................98 5.2.3.1. Results......................................................................................................98 5.2.4. Experiment 4: Lower and more frequent dosing.....................................99 5.2.4.1. Results...................................................................................................100 5.2.5. Validation: Histological analyses with fluorescein staining.............101 . . 8 .
(9) 5.3. DISCUSSION.......................................................................................................................103 5.3.1. Toxin administration route and rate..........................................................104 5.3.2. Toxin dose concentration................................................................................106 5.3.3. Perfusion time......................................................................................................107 5.3.4. Assessment of apoptosis..................................................................................108 5.3.5. Limitations.............................................................................................................109 5.3.6. Future work...........................................................................................................112 5.4. CONCLUSION......................................................................................................................113 6. PARENT-‐OF-‐ORIGIN EFFECTS IN THE HS RATS COMPLEX TRAITS..........114 6.1. MISSING HERITABILITY OF COMPLEX TRAITS.................................................115 6.1.1. Introduction...........................................................................................................115 6.1.2. Parent of origin effects......................................................................................117 6.1.3. Coping styles..........................................................................................................118 6.1.4. Emotional characterisation of the HS rats................................................119 6.1.5. Aim.............................................................................................................................121 6.2. ESTIMATING POE HERITABILITY IN THE HS RATS.........................................122 6.2.1. The HS rat study...................................................................................................122 6.2.2. Phenotypic measures.........................................................................................123 6.2.2.1 Behavioural measures...................................................................................................124 6.2.3 Estimating Parent-‐of-‐origin heritabilities.................................................125 6.3. RESULTS..............................................................................................................................128 6.3.1. Parent-‐of-‐origin effects in heritability of complex traits...................128 6.3.2. Confounding with family structure and analysis of parental effects......................................................................................................................130 6.3.3. Heritability of behavioural phenotypes.....................................................131 6.3.3.1. Parent-‐of-‐origin effects...................................................................131 6.3.3.2. Parental effects...................................................................................133 6.3.3.3. Parent-‐of-‐origin effects in the heritability of passive-‐active coping style.........................................................................................134 6.4. DISCUSSION........................................................................................................................135 6.4.1. Parent of origins in the HS population: mice and rats.........................135 6.4.2. Parent-‐of-‐origin is confounded.....................................................................136 6.4.3. Parent-‐of-‐origin effects in the behavioural measures and in the heritability of coping styles..............................................................................137 6.4.4. Conclusion..............................................................................................................139 7. CONCLUSIONS AND LIMITATIONS.......................................................................140 7.1. THE INTERVENTIONAL APPROACH: THE NEUROD6 TRECK RAT MODEL..........................................................................................................................................141 . . 9 .
(10) 7.2. THE OBSERVATIONAL APPROACH: POE IN THE HERITABILITY OF COMPLEX TRAITS....................................................................................................................145 7.3. FINAL CONCLUSIONS....................................................................................................148 8. MATERIAL AND METHODS....................................................................................149 8.1. INTERVENTIONAL APPROACH: VALIDATION OF THE NEUROD6 TRECK RAT MODEL MATERIAL AND METHODS......................................................................150 8.1.1. Molecular methods............................................................................................150 8.1.1.1. Genotyping.........................................................................................................150 8.1.1.1.1. DNA extraction.............................................................................................150 8.1.1.1.2. PCR amplification...........................................................151 8.1.1.1.2.1 Primer sequences..........................................151 8.1.1.1.2.2. Short range PCR protocol.........................152 8.1.1.1.2.3. Long range PCR protocol..........................153 8.1.1.1.2.4. Electrophoresis.............................................153 8.1.1.2. Toxin preparation.............................................................................154 8.1.1.3. Osmotic mini pump priming........................................................154 8.1.2. Animal procedures.............................................................................................154 8.1.2.1. Breeding and colony management............................................154 8.1.2.2. Toxin dosing........................................................................................155 8.1.2.2.1. Injection and anesthesia..............................................155 8.1.2.2.2. Subcutaneous pump implantation surgery.........156 8.1.2.3. Perfusion and organ harvesting.................................................157 8.1.2.3.1. Perfusion............................................................................157 8.1.2.3.2. Fresh tissue harvesting................................................158 8.1.3. Histology.................................................................................................................158 8.1.3.1. Tissue preparation: slicing and slide mounting..................158 8.1.3.2. Inmunohistochemistry and stainings......................................159 8.1.3.2.1. Dapi counterstaining.....................................................159 8.1.3.2.2. Nissl staining.....................................................................159 8.1.3.2.3. NeuN antibody staining................................................159 8.1.3.2.4. Fluoro-‐Jade staining......................................................160 8.1.3.2.5. Tunel fluorescent staining..........................................161 8.1.4. Microscopy, image capture and image analysis.....................................162 8.1.5. Image processing and cell counting............................................................163 8.2. THE OBSERVATIONAL APPROACH: POE IN THE HERITABILITY OF COMPLEX TRAITS MATERIAL AND METHODS...........................................................163 8.2.1. Animals and breeding scheme.......................................................................164 8.2.2. Behavioural testing.............................................................................................164 8.2.2.1. Elevated Zero Maze..........................................................................164 8.2.2.2. Actimmetry (automated novel-‐cage activity) ......................165 8.2.2.3. Two-‐way active shuttle-‐box avoidance acquisition...........165 8.2.3. Other phenotypic measures..........................................................................................166 8.2.4. Data analysis..........................................................................................................172 8.2.4.1. Phenotypes and genotypes...........................................................172 . . 10 .
(11) 9. BIBLIOGRAPHY..........................................................................................................173 10. LIST OF FIGURES AND TABLES..........................................................................193 11. APENDIX....................................................................................................................196 11.1. Parent of origin effects heritabilities in the HS rats.......................................196 11.2. Parental heritabilities in the HS rats.....................................................................202 . . 11 .
(12) . 1. ABSTRACT/RESUM . . . . . 12 .
(13) 1. ABSTRACT/RESUM The present work explores two approaches to the study of behaviour through genetics. The first approach is an interventional transgenic model that aims to study the behavioral function of the Cornus Ammonis (CA) sub region in the hippocampus. I describe the steps to validate an interventional model using a diphtheria-‐induced cell knockout rat, and our results confirm the insertion of the transgenic construct and a partial expression. We report the results and discuss the feasibility of the model. The second approach is an observational study of the heritability of complex traits such as anxious behaviour analysing phenotypic and genotypic data. Using a large sample of outbred heterogeneous stock rats, I describe how the heritability of complex traits has a parent-‐of-‐origin effect in rats, and focus the analysis on coping style behaviour. Aquest treball doctoral explora dues aproximacions a l’estudi de la conducta a través de la genètica. La primera és una aproximació de caire intervencionista l'objectiu de la qual és estudiar la funció conductual de la regió del Cornus Ammonis (CA) a l’hipocamp utilitzant un model transgènic. La tesi descriu els processos per a validar aquesta aproximació mitjançant un model d’ablació cel.lular induïda per la toxina diftèrica, i els nostres resultats demostren la inserció del constructe i una expressió parcial. Describim els resultats tot analitzant la viabilitat d’aquest model per a l’estudi de la conducta. . . 13 .
(14) La segona aproximació és un estudi observacional de l’heretabilitat dels trets complexos com el comportament ansiós mitjançant l’anàlisi de dades genotípiques i fenotípiques. Analitzant una llarga mostra de rates heterogènies describim com l’heretabilitat dels trets complexos té un efecte lligat al parent d’origen (parent-‐of-‐origin effect) en rates, i centrem l’anàlisi en les conductes i estratègies d’enfrontament davant d’estímuls estressants (coping style). . . . 14 .
(15) . 2. GENERAL INTRODUCTION . . . . . 15 .
(16) 2. GENERAL INTRODUCTION The relationship between behaviour and the brain has been widely explored through observational and interventional models. Observation has been key in the origin of science, when examining naturally occurring events and their relationships was fundamental to inferring their connection. To understand the structure of a causal system, there are two basic approaches that will provide knowledge. The observational approach makes inferences based on sampling the system’s autonomous behaviour, and the interventional approach will collect samples conditioned on the particular values of one or more variables that have been manipulated (Steyvers et al. 2003). Neuroscience has been and is still largely an observational discipline. Most theories of brain function arise from interpreting observations of the structure of the brain, and the characteristics associated with brain injuries. The scope of modern neuroscience includes among others the study of molecular, physiological, genetic, developmental, functional, medical and evolutionary aspects of the nervous system. Each of these fields contributes a wide array of observational but also interventional techniques to study brain function. In this context, molecular and statistical genetics have developed several methodologies to tackle the relationship between genes and physiological function. Not only understanding the relationship between genome and phenome provides information on the function and structure of the brain . . 16 .
(17) and its afflictions, but manipulating the genome also provides a valuable interventionist approach. The consequences of genetic manipulation help understand the relationship between brain, function and malfunction. This thesis explores two approaches to the study of behaviour through genetics. The first approach is an interventional transgenic model that aims to study the behavioral function of the Cornus Ammonis (CA) sub region in the hippocampus. The second approach is an observational study of the heritability of complex traits such as conditioned and unconditioned anxious behaviour (which is known to be hippocampus dependent) analysing phenotypic and genotypic data. This chapter will introduce the rationale for both approaches. It describes what is known about the function of the hippocampus and its connections to anxiety and why a rat cellular ablation model was thought to be useful. It also provides an overview of the strategies available for selectively inactivating neurons and introduces the model that forms the basis of the interventional approach of this thesis. The chapter also presents the heterogeneous rat stock and why this particular model is advantageous when studying Quantitative Trait Loci (QTL). It will also describe how genotypic and phenotypic data provide insight about the heritability of behavioural traits and their genetic basis. . . . 17 .
(18) 2.1. INTERVENTIONAL STUDY: GENETIC MANIPULATION OF THE BRAIN Only recently have tools become available that make possible the type of interventionist science that other disciplines have enjoyed. One of the reasons for the relatively late appearance of these tools is the difficulty when attempting to dissociate individual components of brain function. In 1664, the anatomist Thomas Willis published the first description of the anatomy of the brain and suggested that different brain areas could control different functions; but it was not until physician Paul Broca’s work in the middle of the 19th century with aphasic patients that there was evidence that a highly specific disorder was connected to a specific cortical area (Gross, 1987). He observed that patients with similar symptoms had lesions in the left frontal cortex, in the exact same region. The study of memory and learning from a strict psychological point of view started arousing interest, and in 1901 Willard Small initiated systematic studies on animal learning using mazes. He was the first to use a rat and a maze for behavioral testing. By 1913, John Watson had accumulated enough evidence from rats learning experiments on mazes to conclude that learning could be understood in terms of stimuli and response associations. Studies with animals not only provide the chance to manipulate the environment but also to manipulate the brain, and the consequences of said manipulation can be observed. In the study of the hippocampus, animal models have been widely used in a great variety of interventions. . . 18 .
(19) 2.1.1 The hippocampus and the hippocampal formation: anatomy and morphology The hippocampus is a brain structure located in the medial temporal lobe, on the floor of the lateral ventricle. While there is no universal agreement of which structures should be included in the hippocampal formation (David G. Amaral, Ishizuka, and Claiborne 1990; Witter and Amaral 2004; Andersen et al.), in this thesis I will refer to the hippocampal formation as the group of structures including the hippocampus proper (which is divided into CA1, CA2 and CA3 and the dentate gyrus), the subiculum, the parasubiculum, the presubiculum and the entorhinal cortex. The rat hippocampus is located in the temporal lobe under the corpus callosum at its most frontal point (the septal pole, sometimes referred as dorsal hippocampus) and it extends caudally resembling a C or a banana, the inferior part (the temporal pole) being referred as the ventral hippocampus (fig. 1A). . . 19 .
(20) e2pa 6U6 ! a s ed2 n1 mW a m a edYcWns ed2 mW Wevvn l vpc un mend d cW v 6 nac u d i dma uWevvn l vpc a e11 a dme m 6 vm 1anl é 6 6 l a u d emm aYUHH3! 6 ! e mpa n1 eccucmeded2 cWns ed2 ma dci ac c mend und2 mW c vmnOm l vna uL nac ui dma u hec n1 mW Wevvn l vpc cWns ed2 mW vncemend n1 mW e11 a dm uu u f ac6 UY òY ER nadpc l l ndec cp 1e u UY ò d EY R dmm 2f apcY WR WeupcY vR vf a l e u d pandcY 2R 2a dpu a d pandc6. òï.
(21) The focus of this thesis will be on the hippocampus proper, specifically the CA1-‐ CA3 subfields. A comprehensive review of all the findings related to the hippocampus anatomy, physiology, morphology and connectivity can be found in The Hippocampus Book, (Andersen et al. (2007). 2.1.1.1. The Hippocampus proper The hippocampus proper is a sub structure of the hippocampal formation that contains the dentate gyrus and the CA1-‐CA3 subfields (fig. 1B). While describing briefly the dentate gyrus morphology, this section mostly focuses in the CA morphology and cytoarchitecture. 2.1.1.1.1. The dentate gyrus Three different cell layers compose the dentate gyrus. The molecular layer is sparse in cells and the granular cell layer is a dense, four to eight cell thick layer. Together they form the fascia dentata, which resembles a flat V shape. They enclose the polymorphic cell layer, also called the hilus, which is the third layer of the dentate gyrus. The hilus contains the mossy cells, which are covered by very large and complex spines, named thorny eferescences, but much denser that the ones in the CA3 pyramidal cells (David G. Amaral, Scharfman, and Lavenex 2007). The granular cell layer is one of the few places in the brain where new cells are continuously generated (fig. 1B). . . 21 .
(22) 2.1.1.1.2. The CA sub fields The CA constitutes the pyramidal layer, which is the biggest cellular layer of the hippocampal formation and it is formed almost entirely of pyramidal neurons. The presence of pyramidal neurons in the forebrain areas (as cortex, hippocampus, and amygdala) but not in other structures such as the olfactory bulb, the midbrain or the spinal cord suggests they are related to higher cognitive functions (Spruston 2008). Pyramidal neurons have a basal dendritic tree that extends to the substratum oriens, and an apical dendritic tree that extends into the hippocampal fissure (Witter and Amaral 2004). They are covered with thousands of dendritic spines, some of them which can contain multiple synapses (Spruston 2008) and they are the most abundant cell type in the hippocampus. Lorente de Nó (1934), one of Ramón y Cajal students, appreciated anatomical differences through the layer and suggested three divisions: CA1, CA2 and CA3 (fig. 1B). These divisions have proved not only to relate to anatomical differences but also to different connectivity within the layer. He also noted sub divisions within the CA3 into three parts (CA3 a, b and c) and within the CA1 (also in three parts). However more recent literature suggest there is no reason for these further subdivisions despite some subtle morphological differences (Ishizuka, Cowan, and Amaral 1995). . . 22 .
(23) Pyramidal cells in the CA3 are large, with extensive dendrites, but the whole sub region is very heterogeneous. The CA3 pyramidal neurons close to the dentate gyrus have a dendritic length of approximately 9300 μm (the smallest of all the layer) and this length seems to increase up to the largest dendritic length of all the CA, 15800 μm next to the CA2 (Ishizuka, Cowan, and Amaral 1995; Witter and Amaral 2004; Andersen et al. 2007). The CA2 pyramidal neurons have similar body cells to CA3 (Witter and Amaral 2004), but they lack thorny excrescences on their proximal dendrites (Ishizuka, Cowan, and Amaral 1995). The CA2 section differs from CA3 more in connectivity than in morphology, but this will be further explained in section 2.1.2.1 of this chapter. The pyramidal cell bodies of CA1 are smaller than the ones in CA2 or CA3, but they are very homogeneous through the whole CA1 sub region both in cellular body size and dendritic length (Pyapali et al. 1998; Ishizuka, Cowan, and Amaral 1995). These differences between the neuronal morphology of the very same layer suggest some sort of functional differentiation within this hippocampal structure, suggestion that is emphasized by its connectivity pattern. 2.1.2 Hippocampal connectivity The hippocampal formation connectivity has certain characteristics that are rare in the rest of the brain. It receives multiple external inputs, but also has a rich and multiple internal circuitry. Most of its connections are internal, such as . . 23 .
(24) contralateral and ipsilateral connections, as well as collateral (for instance in CA2 and CA3). Another main distinction is the lack of reciprocal connections between some areas, creating a unidirectional pathway that describes a loop through all the hippocampal formation. This loop is known as the trisynaptic pathway as it involves three synapses. The major external input enters the hippocampal formation at the entorhinal cortex, and connects to synapse at the granular cells of the molecular layer of the dentate gyrus. The mossy fibers project from the molecular layer to synapse in the pyramidal cells of CA3. CA3 projects to CA1 via the Schaffer collateral connections and synapses in the pyramidal cells. From the pyramidal cells of CA1, the pathway continues to the subiculum, which has the major output in the entorhinal cortex, closing the trisynaptic loop. However, it is important to take into account that there are parallel connections to the trisynaptic pathway that terminate in different areas of the hippocampal formation (Witter and Amaral 2004). One example is the connections from the entorhinal cortex to the CA3, where the pyramidal cells in the CA3 receive connections from the entorhinal cortex monosynaptically and disynaptically via the dentate gyrus (the trisynaptic pathway) at the same time. This monosynaptic connection is known as the temporo-‐ammonic pathway. It is unknown if these connections happen in the same cell at the same time. Another important input comes also from the entorhinal cortex to connect with the dentate gyrus, with a topographical structured connectivity. The perforant . . 24 .
(25) pathway connects the lateral sections of the entorhinal cortex with the septal pole of the dentate gyrus, whereas the medial sections have more connections with the temporal pole. This differentiation between the poles connectivity has been linked with differences in function (Bannerman et al. 2004; Kjelstrup et al. 2002). 2.1.2.1. The CA1-‐CA3 connectivity . The CA1-‐CA3 subfields of the hippocampus receive inputs from multiple sources, but its most important connections are within the hippocampus. The CA3 subfield receives inputs from outside of the hippocampal formation such as the amygdala and the septum, and within the hippocampus from the dentate gyrus via the mossy fibers and the entorhinal cortex. However the most characteristic display of the CA3 is the associational and commissural connections with CA2, CA1 and CA3 itself. All CA3 pyramidal cells send projections to all the sections of the CA within the ipsilateral hippocampus by collateral axons, called the associational connections between CA3 and CA2-‐CA3, and the Schaffer collaterals between CA3 and CA1. All of these connections demonstrate a systematic gradient-‐like projections pattern (Andersen et al., 2007). At the same time, CA3 connects with the same fields in the contralateral hippocampus, called the commissural connections. Some fibers will also innervate the polymorphic layer of the dentate gyrus. . . 25 .
(26) The CA2 subfield has a very similar connectivity pattern as CA3. It also participates in the commissural and associational connections, innervating the ipsilateral and contralateral CA3, CA2 and CA1 fields; and also in the connections with the polymorphic layer of the dentate gyrus. However CA2 is the only sub field that receives a prominent innervation from the posterior hypothalamus and the only subfield not to receive inputs from the amygdala. The CA1 subfield receives input from the septum, the entorhinal cortex, the perirhinal cortex, and the amygdala. From within the hippocampus proper, CA1 main inputs are the innervations from CA2 and mostly CA3. The CA3 innervations, named the Schaffer collaterals are part of the trysinaptic loop. CA1 itself lacks the associational connections that are so prominent in CA3 and CA2, but raises important output pathways. The first is a topographically organized projection to the subiculum, the presubiculum, and the postsubiculum (Fanselow and Dong 2010). The second is the cortical connections, since it is the only subfield to send connections to the entorhinal, perirhinal and retrosplenial cortex and also to the medial frontal lobe. Besides the cortical projections, it also sends fibers to the lateral septal nucleus and the amygdala. 2.1.3 The Function of the Hippocampus The hippocampus anatomy and physiology has many particularities that point at high cognitive and singular functions. The granular cell layer of the hippocampus is one of the few places in the brain where new cells are continuosly generated. . . 26 .
(27) This neurogenesis creates de novo neurons that generate axons and dendrites to fully integrate in the brain circuitry. The hippocampal connectivity pattern presents unique features as the trisynaptic loop or the recurrent synapses in CA3. The presence of large pyramidal cells which are present in the forebrain areas (as cortex, hippocampus, and amygdala) but not in other more primitive brain structures such as the midbrain or the spinal cord suggests they are related to high cognitive functions (Spruston, 2008). Besides the anatomical and morphological particularities, studies with the aim to define hippocampal function have raised different theories. There is evidence that neurogenesis can be influenced by external factors such as exercise (van Praag, Kempermann, and Gage 1999) or stress (Gould et al. 1997), but there is no clear role of how this de novo cells contribute to hippocampal function since several studies report contradictory information (Kempermann, Wiskott, and Gage 2004; Groves et al. 2013a; Shors et al. 2001; Deng, Aimone, and Gage 2010). While they are backed up by scientific research, numerous findings challenge the accuracy of these theories at explaining sufficiently the hippocampus function. 2.1.3.1 The declarative memory theory Following Scoville and Milner’s report of the side effects of surgery to palliate epilepsy, the theory that the hippocampus subserved declarative memory gained ground. The surgery sectioned the medial temporal lobe bilaterally to an extension of 8 cm, damaging the hippocampal formation and the amygdala to some extent. The patient, H.M., showed complete anterograde amnesia and a . . 27 .
(28) three year retrograde amnesia, but had intact cognitive function, language, and procedural memory. It was concluded that the hippocampus had a role in information retention (Scoville and Milner 1957). This paper suggested for the first time that memory was not a disseminated brain function but was specific to a brain region, and that there were different types or divisions of memory functions. The declarative memory theory sets the hippocampus as the core where semantic and episodic memory processes take place (Eichenbaum 2011). This type of memory is very different from procedural memory, which is memory for learned abilities or automated behaviors such as riding a bike or playing the piano, which cannot be explained easily with words but can be demonstrated without difficulty. In comparison, declarative memory is memory of facts or episodes that can be explained with words, for instance semantic memory is the knowledge of facts such as “Italy is a country in Europe”, whereas episodic memory is the knowledge of events of one individual’s life such as “last summer I spend my holidays in Italy”. The case of the HM patient was consistent with this separation between declarative memory, which was impaired since the surgery, and procedural memory that he had intact. However, later studies with animal models point to a necessary cortex-‐ hippocampus interaction for the consolidation of long term memories (Frankland et al. 2001; Eichenbaum 2011) and a necessary role of the cortex for conservation of long term memories (Wang and Morris 2010; Eichenbaum 2011; Winocur, Moscovitch, and Sekeres 2007). While it is established that the hippocampus works with other necessary brain structures to encode and . . 28 .
Figure
+7


Documento similar
Keywords: Metal mining conflicts, political ecology, politics of scale, environmental justice movement, social multi-criteria evaluation, consultations, Latin
The tentative spin and parity assignment to the observed levels in 44 S is based on the comparison between the calcu- lated and experimental (i) excitation energies, (ii)
Even though the 1920s offered new employment opportunities in industries previously closed to women, often the women who took these jobs found themselves exploited.. No matter
Government policy varies between nations and this guidance sets out the need for balanced decision-making about ways of working, and the ongoing safety considerations
We seek to characterize the transport in a time-dependent flow by identifying coherent structures in phase space, in particular, hyperbolic points and the associated unstable and
Method: This article aims to bring some order to the polysemy and synonymy of the terms that are often used in the production of graphic representations and to
Although some public journalism schools aim for greater social diversity in their student selection, as in the case of the Institute of Journalism of Bordeaux, it should be
In the “big picture” perspective of the recent years that we have described in Brazil, Spain, Portugal and Puerto Rico there are some similarities and important differences,
