Empirical essays on labour productivity
in EU manufacturing
Carolina Hintzmann Colominas
ADVERTIMENT. La consulta d’aquesta tesi queda condicionada a l’acceptació de les següents condicions d'ús: La difusió
d’aquesta tesi per mitjà del servei TDX (www.tdx.cat) i a través del Dipòsit Digital de la UB (diposit.ub.edu) ha estat autoritzada pels titulars dels drets de propietat intel·lectual únicament per a usos privats emmarcats en activitats d’investigació i docència. No s’autoritza la seva reproducció amb finalitats de lucre ni la seva difusió i posada a disposició des d’un lloc aliè al servei TDX ni al Dipòsit Digital de la UB. No s’autoritza la presentació del seu contingut en una finestra o marc aliè a TDX o al Dipòsit Digital de la UB (framing). Aquesta reserva de drets afecta tant al resum de presentació de la tesi com als seus continguts. En la utilització o cita de parts de la tesi és obligat indicar el nom de la persona autora.
ADVERTENCIA. La consulta de esta tesis queda condicionada a la aceptación de las siguientes condiciones de uso: La
difusión de esta tesis por medio del servicio TDR (www.tdx.cat) y a través del Repositorio Digital de la UB (diposit.ub.edu) ha sido autorizada por los titulares de los derechos de propiedad intelectual únicamente para usos privados enmarcados en actividades de investigación y docencia. No se autoriza su reproducción con finalidades de lucro ni su difusión y puesta a disposición desde un sitio ajeno al servicio TDR o al Repositorio Digital de la UB. No se autoriza la presentación de su contenido en una ventana o marco ajeno a TDR o al Repositorio Digital de la UB (framing). Esta reserva de derechos afecta tanto al resumen de presentación de la tesis como a sus contenidos. En la utilización o cita de partes de la tesis es obligado indicar el nombre de la persona autora.
WARNING. On having consulted this thesis you’re accepting the following use conditions: Spreading this thesis by the
Caro
li
na
H
in
tz
m
ann
Co
lo
mi
na
s
PhD in E
conomic
s
Carolina Hintzmann Colominas
Empirical essays on labour
Thesis title:
Empirical essays on labour productivity
in EU manufacturing
PhD student:
Carolina Hintzmann Colominas
Advisors:
Josep Lladós-Masllorens
Raúl Ramos-Lobo
Date:
July 2015
v
Acknowledgements
There are many people whom I thank for their support and help in the preparation of this thesis. To them I dedicate these lines.
First of all, I would like to express my deepest and heartfelt gratefulness to my advisors Josep Lladós and Raúl Ramos, whose contribution in stimulating suggestions, encouragement, support and dedication helped me to complete this dissertation. They have been always available to clarify my doubts despite the busy schedules. It has been a great opportunity to learn from their research expertise. I am also very thankful to my tutor Núria Bosch, for her support and confidence. I extend my sincere word of thanks to all and each one of the members of the Business and Economic Studies of the Universitat Oberta de Catalunya. Thank you so much for being there sharing laughs and tears. Particularly, thank you very much from the bottom of my heart to the head of our Department, Àngels Fitó; for her confidence, support and positive attitude. I also want make my gratefulness extensive to all the members of the Universitat Oberta de Catalunya, with whom I might have shared some moments during this long journey.
I also thank the support of my former colleagues of the Econometric Department and Public Finance Department of Faculty of Economics of the Universitat de Barcelona. At this point, specifically, I want to express my thankfulness to Alex Esteller. I am also grateful for the valuable comments and support of Jose García. Additionally, I want to thank the help and advice of Jordi Roca, from the UB-Economics.
Finally, I owe a lot to my family and my friends. They have been an important pillar, without their love and encouragement I probably would not have been able to finish this thesis.
vii
Table of contents ... vii
List of Tables ... ix
List of Figures ... xi
Chapter 1: Introduction ... 1
1.1. Background and motivation ... 1
1.2. Objectives ... 7
1.3. Structure of the thesis ... 8
1.4. References ... 11
Chapter 2: An analysis of differences in labour productivity ... 15
2.1. Introduction ... 15
2.2. Data ... 16
2.3. Main sources of Gross Value Added per Capita in Manufacturing ... 17
2.4. Changes in Manufacturing Specialization ... 24
2.5. Conclusions ... 30
2.6. References ... 33
2.7. Appendix 2.A ... 35
Chapter 3: Decomposition of labour productivity: the role of sectoral structure ... 37
3.1. Introduction ... 37
3.2. Data ... 39
3.3. Decomposition of aggregate Productivity Changes in Rate and in Level Effect 40 3.4. Decomposition of aggregate productivity changes in three components: Structural change, productivity differential and allocative ... 42
3.5. Conclusions ... 47
viii
Chapter 4: Intangible assets and labour productivity growth ... 53
4.1. Introduction ... 53
4.2. Background literature ... 57
4.3. Data and empirical evidence ... 61
4.3.1. Data ... 61
4.3.2. Empirical evidence ... 63
4.4. Conclusions ... 74
4.5. References ... 81
4.6. Appendix 4.A. ... 87
Chapter 5: Concluding remarks and future research ... 91
5.1. Concluding remarks and policy implications ... 91
5.2. Future research ... 99
5.3. References ... 103
ix
Table12.1. Gross Value-Added per Capita Decomposition in Manufacturing. Spain
and Germany, 1993-2007 ... 19
Table22.2. Labour Productivity. Spain - Germany, 1993-2007 ... 28
Table32.A.1. Industry taxonomy and ISIC classification ... 35
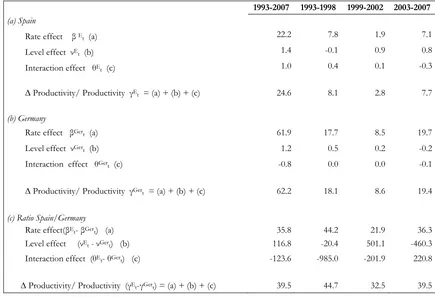
Table43.1. Decomposition of aggregate productivity change. Manufacturing industry: Spain and Germany, 1993-2007 ... 42
Table53.2. Shift-share analysis. Spain - Germany, 1993-2007 ... 44
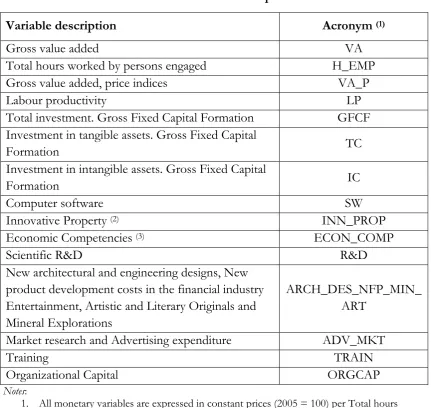
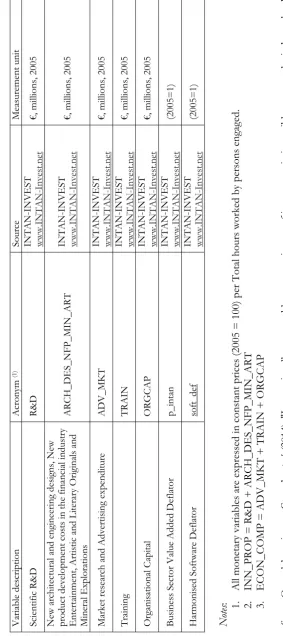
Table64.1. Variable description ... 64
Table74.2. Estimation results for all countries, 1995-2010 ... 68
Table84.3. Estimation results for Group 1: Austria, Finland, Germany, Netherlands and Sweden ... 71
Table94.4. Estimation results for Group 2: Belgium, France, Italy and Spain ... 72
Table104.A.1. Data sources and variable description, 1995-2010 ... 87
xi
Figure12.1. GVA per Capita in total Economy. Germany and Spain, 1993-2007 .... 20
Figure22.2. GVA per Capita decomposition. Spain minus Germany ... 20
Figure32.3. GVApc, Labour Productivity and Number of Hours Worked by Engaged Person. Spain minus Germany, 1993-2007 ... 24
Figure42.4. Structural change index L0T ... 26
Figure52.5. Index of differences in industries’ composition, L E-Ger. ... 27
Figure62.6. Ratio Labour Productivity Spain/Germany (in %) 1993 and 2007 ... 27
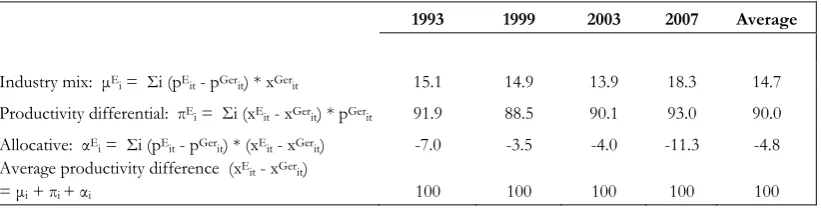
Figure73.1. Weight of each component μiE, πiE and αiE on the productivity differential (in %). Spain and Germany, 1993-2007 ... 47
1
Chapter 1: Introduction
1.1. Background and motivation
The European Union (EU) manufacturing’s share in gross domestic product (GDP) has continuously declined over a number of years reaching its trough in the mid of 2009 (Veugelers, 2013 and European Competitiveness Report, 2013). The financial crisis that began in 2008 accelerated this decline. Whereas EU manufacturing recovered earlier from its dip in 2009 than the United States (US), since the end of 2011, EU has been lagging behind. The recovery in the two previous recessions since 1990 was also faster in the US than in EU. Despite its decreasing and small share of value added and employment, manufacturing industry is still playing an important role in the EU economy, being a driver of exports, research and development (R&D) and innovation. In contrast to the reduced domestic demand due to public and private debt problems, demand for EU exports has grown. As Veugelers (2013) affirms, a new and decisive discussion on the future of manufacturing has arisen in Europe, the United States and Japan. In comparison to services, EU manufacturing is relatively reducing its weight in GDP, but the crisis that started in 2008 has changed the perceptions of the role of the manufacturing industry. It brought back into the center of the scene the benefits of a strong and stable manufacturing base.
2
As Dhèret (2014) states de-industrialisation is no longer perceived as a natural process of economic development and the focus on the services sector has somewhat faded away due to several factors. The high volatility of financial markets and the recent bursting of the financial sector have obviously contributed to revive the interest in manufacturing. This change is also explained by some strong evidence showing that manufacturing is an essential pillar of the economy as "additional final demand in manufacturing generates around half as much additional final demand elsewhere in the economy" (European Competitiveness Report, 2013).
Innovation and specialised service inputs are becoming key factor in manufacturing production. Particularly, specialized service inputs increased their relevance for product differentiation and quality improvements of manufactures allowing companies to charge higher prices and to generate higher value added. All this is indicative for the increasing interlinkages between manufactures and services, so the discussion is no longer on which of these sectors should become the key driver of economic growth, but how to collaborate efficiently.
So, among the main arguments in favour of a strong manufacturing base are that manufacturing industry is an important source of innovation and technological progress, and, too, because of its increasing interlinkages with services. Furthermore, manufactures tend to invest more in innovation activities than services industries. Indeed, according to European Competitiveness Report (2013), manufacturing represents the major source of investment in R&D (65.3% between 2008 and 2010), a key source of exports (67% of Europe's exports) and a main driver for employment in other sectors, including services (each additional job in manufacturing creates 0.5-2 jobs in other sectors). Another common argument for the relevant role of manufacturing is that labour productivity growth is higher in this sector than in the rest of the economy. This argument is strongly related to that of innovation, because R&D and innovation nourish technological progress and labour productivity growth. It also shows the particularity that the sector of origin of technological progress is not necessarily the one that benefits most intensively from new technologies.
3
end of the 1990s and around 2006–2007. Finally, during the Great Recession in 2008-09, the EU saw a decline in labour productivity parallel to the contraction of the economy.
Before the crisis that started during 2007-2008, the debate on labour productivity slowdown indicated that Information and Communication Technologies (ICT) capital accumulation was the main explanation for the underperformance of EU labour productivity (Rincon et al., 2012; Timmer et al., 2010; O’Mahony and Vecchi, 2009; Van Ark et al., 2008; Jorgenson and Vu, 2005; Inklaar et al, 2005; Stiroh, 2002). The benefits of the modern knowledge economy differ greatly between advanced economies. Slower adoption of ICT technologies in the EU in contrast to the US, specifically in services sectors was considered for a long time as the major reason for it. The hypothesis was that, as a consequence of this lag, it would take some time for its benefits to materialize in EU. But several years later after the “ICT revolution”, the EU has only not caught up with the US, but the productivity gap has grown. Several authors (Brynjolfsson and Hitt, 2000; O’Mahony and Vecchi, 2009) demonstrated that too low investment in the skills and the absence of organizational changes necessary to reap the benefits of ICT technologies were the main explanation for it. Lower investment rates in intangible assets (R&D, design, human and organisational capital, etc.) are likely to explain this behaviour of labour productivity in EU, as these factors affect countries' absorptive capacity, i.e. their ability to take advantage of the technology developed elsewhere (international technology transfers) (European Competitiveness Report, 2013).
4
indicative that presently the main source of growth should come from the external sector, ie from exports of goods and services (Vihriäla and Wolff, 2013).
Despite the decline in the 2000s has been similar in France and Belgium, the level in southern Europe is lower. In contrast, northern Europe and Germany, in particular, maintained a strong a stable manufacturing base. The constant share of manufacturing in Germany stands out as exceptional and can likely be ascribed to successful integration of German industry into the European and global value chain. Traditionally, southern Europe’s exports have been more concentrated than the EU as a whole in services, tourism in particular, in relation to manufacturing. In addition, non-manufactured goods represent the bulk of exports from the south than from the north of Europe. In comparison to the EU as a whole the share of service exports was less than 1% greater. The difference between the southern European member states relative to EU as a whole is mainly explained by the larger weight of non-manufacture goods in total exports. As far as the manufacturing sector is one of the key sectors promoting exports performance and an important source of growth, and taking into account that internal demand keeps weak, manufacturing’s competitiveness needs to be improved so that growth through exports can be guaranteed. The strong export growth in parts of southern Europe since the crisis is an indication of the potential of the firms in the region. But they face an uneven playing field compared to competitors in the north because of the south’s structural shortcomings and because of current tight financing conditions. Action by policymakers is required to overcome these obstacles.
5
At the end of the crisis and in front of the persistence of the difficulties to improve labour productivity performance in manufacturing, still a great number of authors are devoted to examine the causes of it. Recent studies (Strobel, 2012; Mas et al., 2012; Timmer et al., 2011; Timmer et al 2010; Hao et al., 2009) have tried to find explanations to the declining trend of labour productivity growth in EU countries over the last two decades. They are not mutually exclusive and range from lower growth contributions from investment in information and communication technology, R&D and innovation, the relatively small share of technology– producing industries, the investment in intangible assets, the competition and slower multifactor productivity growth (viewed as a proxy for advances in technology and innovation).
The findings of many of these authors coincide in the established view that the growing role of ICT and continued improvements in human capital are important drivers of labour productivity growth. But despite the apparent importance of the “knowledge economy” macroeconomic performance appears unaffected: investment rates are flat and labour productivity has slowed.
In response, several studies found evidence that increased investment in intangible assets explain a large share of the unexplained labour productivity growth and thus for economic growth (Corrado et al., 2005, 2006, 2009; Marrano and Haskel, 2006; Van Rooijen-Horsten et al., 2008; Fukao et al., 2009; Hao et al., 2009; Marrano et al., 2009; Mc Morrow et al., 2010; Edquist, 2011; Strobel, 2012).
The changing nature of the global economy has placed a novel attention on intangible capital as a new source of growth (Muntean, 2014; Dal Borgo et al., 2013; Goodridge et al., 2013 and Jona-Lasinio et al., 2011). The structural and technological changes associated with the rapid progress in ICT, the rising role of the service sector and the emergence of new business models made intangible investment a key element of global competition.
6
After the Great Recession, many countries are troubled about their economic growth performance, this leads policy makers to look for solutions which are mainly focused on new sources of economic growth and employment creation. Some countries are concerned about their unbalanced economic growth with some sectors declining excessively and others taking too strong a role in overall economic growth. In other countries the concerns are about a decline in manufacturing production, the loss of opportunities in catching up with ICT technologies and knowledge. All this explains the resurgence of a renewed interest in manufacturing industry and for the so-called new industrial policy. Countries require industrial policy measures that address concrete needs, promote technologies and investment in strategic industrial manufacturing branches in order to strengthen them (European Commission, 2014). This change is also explained by some strong evidence showing that manufacturing is an essential pillar of the economy as "additional final demand in manufacturing generates around half as much additional final demand elsewhere in the economy" (European Competitiveness Report, 2013).
The former is sustained by the fact that manufacturing industry is considered the core driver of economic growth - in 2012, the European Commission published a new industrial policy communication, which starts from the premise that “Europe
needs industry” (European Commission, 2012). Identifying the right policies to
support the manufacturing sector’s contribution to Europe’s future growth requires an understanding of the changing role of manufacturing industry in Europe’s growth agenda. In this context it is important to implement both homogeneous as well as country-specific industrial policy measures for the EU member states aiming a stable and balanced performance of economic growth.
7
responsible for this poor performance that hinders a recovering from the Great Recession. This would allow designing industrial policy measures to improve the behaviour of labour productivity growth.
The motivation is threefold, first we determine and assess the magnitude of labour productivity differences as well as the role of industry specialization in explaining these differences.
Secondly, to deepen the analysis, we investigate if the differences in labour productivity and its persistence arise from different production structures, if it is a problem of productivity differences itself or a combination of both. The existence of different production structures would explain the presence of differentiated production systems that may have led to different regional growth patterns.
Thirdly, as long as the benefits of modern knowledge differ greatly between advanced economies, we want to examine the contribution of investment in intangible assets to labour productivity growth in manufacturing. Intangible assets are considered as knowledge capital, so if we take into account that knowledge is one of the main drivers of economic growth and competitiveness it is interesting to examine their influence on labour productivity performance (Corrado et al., 2014; Falk, 2013; Baldwin et al., 2012;). The purpose is to identify which single or combinations of intangible assets’ investment are essential drivers of labour productivity growth.
To obtain an answer for our objective becomes key in helping to design strategic industrial policy measures aiming to improve the performance of labour productivity growth, economic growth and competitiveness.
1.2. Objectives
8
This objective can be decomposed into three sub-objectives. So first, we conduct a comparative analysis of differences in labour productivity growth in manufacturing and next, we try to find out if the differences in labour productivity are due to changes in the industrial structure, to labour productivity deficiencies itself or a combination of both. Finally, in the context where knowledge is an important driver of economic growth and competitiveness in advanced economies, and as intangible assets are considered as “knowledge capital” (Falk, 2013), we examine the role of investment in intangible assets as contributor to labour productivity growth. The purpose is to identify which intangible assets contribute most to labour productivity growth.
As said before manufacturing in Europe has been divided in a “centre” and in a “periphery”, this is indicative for existence of a differentiated production model in manufacturing in southern and northern Europe. For this reason, we think it may be interesting to center the analysis of labour productivity in manufacturing on the “centre” and the “periphery” of the EU and more concretely in two benchmark member states representing each one. With this aim, in the next two chapters of the thesis we will take Germany as benchmark for the “centre” and Spain for the “periphery”. So, analysis in the first and in the second part of the dissertation is focused on Germany and Spain, but the results and conclusions obtained can be extended to the EU member states belonging to the “centre” and the “periphery”. Furthermore, in chapter 4 we implement an analysis in two steps, first considering the whole set of 9 EU member states and, second, dividing the sample into two groups. In both cases, the aim is deepen in the analysis in order to find an answer for the differentiated behaviour that allows to identify the investment in different intangible assets types the contribute most to labour productivity growth. In doing so, it might permit to discriminate between industrial policy measures addressing specific characteristics of each group and measures at EU level. This would result in greater efficacy and efficiency in the consecution of the aimed objectives.
1.3. Structure of the thesis
9
Chapter 2: An Analysis of Differences in Labour Productivity in Manufacturing. Displaying the need for a resurgence of industrial policy: Spain vs Germany, 1993-2007
In chapter 2, in order to find out if differences in productivity arise mainly from distinct production structures, if they are mainly due to an intrinsic problem of the industrial productivity itself or a combination of both of them, a comparative analysis of industrial labour productivity between Spain and Germany in the pre crisis period between 1993 and 2007 is undertaken. As said before, Spain and Germany are chosen as benchmark countries, for the “periphery” and for the “centre”, respectively. The objective is to know which are the main factors preventing the continued labour productivity growth in Spanish manufacturing, impeding the recovery of the present crisis. Bearing this in mind, we want to determine the existence of differences between Spanish and German manufacturing labour productivity, to assess its magnitude and the role of industry specialization. Results indicate that it is mainly a problem of productivity itself. To a less extent industry specialization plays a little role, although its influence is increasing. The main contribution of that chapter is that the differences in labour productivity can be mainly attributed to productivity itself and not so much to manufacturing industry structure differences.
Chapter 3: Labour productivity and Industrial Specialization
10
Chapter 4: The contribution of intangible assets to labour productivity growth in manufacturing industries in EU member states, 1995-2010.
As long as intangible capital is considered a main component of knowledge playing an important role as driver of labour productivity growth, the aim of this chapter is to investigate the contribution to labour productivity growth of investment in different single intangible asset types in this case. The analysis is implemented for manufacturing taking a sample of 9 European member states between 1995 and 2010. We have extended the sample in order to provide higher variability and richness to the study resulting from the different characteristics of the countries considered and also to overcome the reduced availability of more detailed information for Spain and Germany. With the purpose of identifying the existence of a differentiated behaviour in terms of labour productivity growth and intangibles’ investment, we split the sample into two groups. If affirmative, this would permit to define more concrete industrial policy measures addressing each group resulting in a better labour productivity performance. Results indicate that it is reasonable. The main findings can be summarized as follows: all the considered intangible assets are significant for labour productivity growth except for software in both groups; and for
R&D in group 1. Vocational training and advertising & marketing are the ones which
contribute individually most to labour productivity growth. The implications of these findings for the design of industrial policy measures are that common measures should be combined with specific ones focusing on the particular needs in terms of intangibles investment of each country. This chapter is a contribution to the literature of investment in intangibles due to the fact that identifies which of the different intangibles are the main drivers of labour productivity growth in EU member states in manufacturing, between 1995 and 2010, shows the existence of heterogeneous effects of investment in intangibles in the considered EU sample and its implications for industrial policy in European Union.
Chapter 5: Concluding remarks and future research
11
1.4. References
Baldwin, J.R., Gu, W. and Mac Donald, R. (2012). “Intangible Capital and Productivity Growth in Canada”, The Canadian Productivity Review, 29, 1-44.
Bernard, Andrew B. and Jones, Charles I. (1996). “Comparing Apples to Oranges: Productivity Convergence and Measurement across Industries and Countries”, The American Economic Review, 86 (5), 1216-1238.
Brynjolfsson, E. and Hitt, L. (2000). “Beyond computation: information technology, organizational transformation and business performance”, Journal of Economic
Perspectives, 14, 23–48.
Corrado, C., Hulten, C. and Sichel, D. (2005). “Measuring Capital and Technology: An Expanded Framework”, in C. Corrado, J. Haltiwanger, and D. Sichel (eds), Measuring Capital in the New Economy, National Bureau of Economic
Research Studies in Income and Wealth, 65, 11-45, The University of Chicago
Press, 2005.
Corrado, C., Hulten, C. and Sichel, D. (2006). “Intangible Capital and Economic Growth”, NBER Working Paper, 11948, National Bureau of Economic Research, Cambridge, MA.
Corrado, C., Hulten, C. and Sichel, D. (2009). “Intangible capital and US economic growth”, Review of Income and Wealth, 55 (3), 661–685.
Crafts, N., (2010). “Overview and Policy Implications”, in BIS (ed.), Learning from some of Britain’s Successful Sectors: An Historical Analysis of the Role of Government, BIS Economics Papers, 6, March, 1-17.
Dal Borgo, M., Goodridge, P., Haskel, J., and Pesole, A. (2013). “Productivity and growth in UK industries: An intangible investment approach”, Oxford Bulletin
of Economics and Statistics, 75, 806–834.
Dhéret, C. (2014). “Sharing the same vision – The cornerstone of a new industrial policy for Europe”, Discussions Paper, European Policy Centre, 1-15. Available at
www.epc.eu.
Edquist, H. (2011). “Intangible Investment and the Swedish Manufacturing and Service Sector Paradox”, The Review of Income and Wealth, 57 (4), 658–682. European Commission (2010). “Product Market Review 2010-2011”, European
Economy 8. Directorate-General for Economic and Financial Affairs,
European Commission.
European Commission (2012). “A stronger European industry for growth and economic recovery”, COM (2012) 582.
European Competitiveness Report (2013). “Towards knowledge-driven
Reindustrialisation”. Available at
http://ec.europa.eu/enterprise/policies/industrial-12
competitiveness/competitiveness-analysis/european-competitiveness-report/files/eu-2013-eur-comp-rep_en.pdf
Eurostat (2013). “Industrial production up by 0.7 per cent in euro area”, Eurostat
news release, 121, 13 August 2013.
Fabricant, S. (1942). “Productivity of Labour in Peace and War”, NBER Occasional
Paper, 7, 1-29. National Bureau of Economic Research. Available at
http://www.nber.org/chapters/c9271.pdf
Falk, M. (2013). “New Empirical Findings for International Investment in Intangible Assets”, Working Paper, 30. Work Package 305, MS61 Research paper on the determinants of intangible investment and different types of innovation. Welfare, Wealth, Work for Europe. Available at
www.foreurope.eu.
Fukao, K., Miyagawa, T., Mukai, K., Shinoda, Y. and Tonogi, K. (2009). “Intangible Investment in Japan: Measurement and Contribution to Economic Growth”,
Review of Income and Wealth, 55 (3), 717-736.
Goodridge, P., Haskel, J. and Wallis, G. (2013). “Can Intangible Investment Explain the UK Productivity Puzzle?”, National Institute Economic Review, 224, 48–58. Hao, J. X., Manole, V. and Van Ark, B. (2009.). “Intangible Capital and Growth –
an International Comparison”, Commission, European Programme, Seventh
Framework, 1–63.
Inklaar, R., O’Mahony, M., and Timmer, M. (2005). “ICT and Europe’s productivity performance: Industry-level growth account comparisons with the United States”, Review of Income and Wealth, 51 (4), 505–536. doi:10.1111/j.1475-4991.2005.00166.x
Jona-Lasinio, C., Iommi, M, and Manzocchi, S. (2011). “Intangible Capital and Productivity Growth in European Countries”, INNODRIVE Working Paper, (10), 26.
Jorgenson, D. W. and Vu, K. (2005). “Information Technology and the World Economy”, Scandinavian Journal of Economics, 107 (4), 631–650. doi:10.1111/j.1467-9442.2005.00430.x.
Jorgenson, D. W. (Dir) (1995). Productivity Volume I: Postwar U.S. Economic Growth, Cambridge, MA: MIT Press. ISBN 0-262-10049-5 (Vol.1).
Jorgenson, D. W. (Dir) (1996). Productivity Volume 2: International Comparisons of Economic Growth, Cambridge, MA: MIT Press. ISBN 0-262-10050-9 (Vol.2).
Jorgenson, D. W., Ho, M. S. and Stiroh, K. J. (Dirs) (2005). Productivity Volume 3: International Comparisons of Economic Growth, Cambridge, MA: MIT Press. ISBN 0-262-10111-4 (Vol.3).
13
London. Available at
http://www.economics.qmul.ac.uk/papers/doc/wp578.pdf
Marrano, M. G., Haskel, J. and Wallis, G. (2009). “What happened to the Knowledge Economy? ICT , Intangible Investment, and Britain’s Productivity Record revisited”, Review of Income and Wealth, 55 (3), 686-716. Mas, M. et al. (2012). Industrial Productivity in Europe: Growth and Crisis. Editors:
Matilde Mas & Robert Stehrer. Edward Elgar Editors.
Mc Morrow, K., Röger, W., and Turrini, A. (2010). “Determinants of TFP growth: A close look at industries driving the EU–US TFP gap”, Structural Change and
Economic Dynamics, 21 (3), 165–180. doi:10.1016/j.strueco.2010.03.001
Muntean, T. (2014). “Intangible Assets and Their Contribution to Labour Productivity Growth in Ontario”, International Productivity Monitor 27, 22–40. O'Mahony, M., and Vecchi, M., (2009) “R&D, knowledge spillovers and company
productivity performance”, Research Policy, 38 (1), 35-44.
Owen, G. (2012), “Industrial policy in Europe since the Second World War: what has been learnt?”, ECIPE Occasional paper, 1. The European Centre for International Political Economy, Brussels, Belgium. Available at
http://eprints.lse.ac.uk/41902/.
Petrakos, G., Kallioras, D. and Anagnostou, A. (2011). “Regional Convergence and Growth in Europe: understanding patterns and determinants”, European
Urban and Regional Studies, 18 (4) 375–391
Pianta, M. (2013), “An Industrial Policy for Europe”, Socialist Project, Global Research
and also as Paper for the 19th Conference on Alternative Economic Policy in Europe, London 20-22 Sept 2013.
Reiner, C., (2012). “Play it again, Sam: die Renaissance der Industriepolitik in der Großen Rezession”, Wirtschaft und Gesellschaft, 38 (1), 15-56.
Rincon, A. Vecchi, M., and Venturini, F., (2012). “ICT spillovers, absorptive capacity and productivity performance”, Quaderni del Dipartimento di Economia,
Finanza e Statistica, 103/2012, Università di Perugia, Dipartimento Economia,
Finanza e Statistica.
Roth, F. and Thum, A. E. (2013). “Intangible capital and labor productivity growth: Panel evidence for the EU from 1998-2005”, Review of Income and Wealth, 59 (3), 486–508.
Solow, Robert M. (1956). “A Contribution to the Theory of Economic Growth”,
Quarterly Journal of Economics, 70 (1), 65-94.
Solow, Robert M. (1957). “Technical Change and the Aggregate Production Function”, The Review of Economics and Statistics, 39 (3), 312-320.
Stiroh, K. J., (2002). “Are ICT spillovers driving the New Economy?”, Review of
14
Strobel, T. (2012). “New evidence on the sources of EU countries’ productivity growth-industry growth differences from R&D and competition”, Empirica, 39 (3), 293–325.
Timmer, M. P., Inklaar, R., O’Mahony, M., and van Ark, B. (2010). Economic growth in Europe. A comparative industry perspective, Cambridge University Press, ISBN 978-0-521-19887-5 Hardback. Available at
http://ebooks.cambridge.org/ebook.jsf?bid=CBO9780511762703
Timmer, M. P., Inklaar, R., O’Mahony, M., and van Ark, B. (2011), “Productivity and Economic Growth in Europe: A Comparative Industry Perspective”,
International Productivity Monitor, 21, 3-23.
Van Ark, B., O'Mahony, M., and Timmer, M. P. (2008). “The Productivity gap between Europe and the US: Trends and causes”, Journal of Economic
Perspectives, 22 (1), 25-44.
Van Rooijen-Horsten, M., van den Bergen, D. and Tanriseven, M. (2008). “Intangible Capital in the Netherlands: A Benchmark”, Discussion Paper
(08001), 22. Statistics Netherlands. Vorburg/Heerlen. Available at
http://www.cbs.nl/NR/rdonlyres/DE0167DE-BFB8-4EA1-A55C-FF0A5AFCBA32/0/200801x10pub.pdf
Veugelers, R. (2013). “Manufacturing Europe’s future growth”, in Manufacturing Europe’s Future, 1-6. Reinhilde Veugelers Ed. Brueguel Blueprint Series, Vol XXI. Belgium. Available at www.bruegel.org
15
Chapter 2: An analysis of differences in labour
productivity.
12.1. Introduction
The crisis which started in 2008 is affecting most countries with different levels of intensity. Although it started in the financial sector, its impact has spread throughout the whole economy. Since the early 1990s the European Union economy has gone through two business cycles and is now in the downward phase of a third one. The troughs of the manufacturing cycles in EU occurred first in 1993 and then at the end of 2001. They were characterised by negative growth rates in manufacturing output. But in some countries the situation has been exacerbated by pre-existing low sectoral performance (European Commission, 2009). That seems to be the case with Spain. Joining the European Union (EU) in 1986 played at least an important role in shaping Spain into what it is today (Mas et al., 2012). It benefited from the inflow of funds of the EU, which contributed definitively to Spanish economic growth and to its modernization. Consequently, one would have expected a better performance and a faster recovery of Spanish economy in front of the recent economic crisis. Spain’s recovery patterns seem to be mostly affected not only by macroeconomic imbalances, but also by its difficulty to improve internal competitiveness.
As long as labour productivity is one of the drivers of internal competitiveness, this chapter focuses on its performance. In particular, we conduct a comparative analysis of industrial labour productivity between Spain and Germany in the previous years of the crisis, 1993-2007. As said in the Introduction two great groups of member states can be identified, one displaying a weaker manufacturing base – “periphery”- and another one with a stronger manufacturing base – “centre”. In our analysis Spain is representative for the “periphery” and Germany for the “centre”. The purpose is to identify the determinants that hinder the continued growth of productivity in Spanish industry, depriving from recovering of the present crisis. To this end, we aim to determine the existence of differences between industrial productivity in Spain and Germany, to assess its magnitude and the role of industry specialization. The motivation is to find out if differences in productivity arise
1 Chapters 2 and 3 of this dissertation have been merged into one article that has been accepted for
16
mainly from distinct production structures, if they are mainly due to an intrinsic problem of the industrial productivity itself or a combination of both of them. There is now a vast amount of literature focusing on the explanation and impacts of the economic crisis at the macroeconomical level, with little emphasis on the sectoral patterns in relation to structural change and sectoral productivity growth (Martínez Álvarez, et al., 2013 and Timmer et al., 2011).
The results confirm that it is mainly an intrinsic problem of productivity itself. Industry specialization is becoming an influencing variable, although to a lesser degree. So, the main contribution of this chapter is that differences in industry structure do not totally justify the gap in productivity.
The remainder of this chapter is organized as follows. After the introduction, the second section contains a brief description of the dataset. The third section describes the evolution of German and Spanish per capita gross value added (from now on GVApc) for the whole economy and for manufacturing. The aim is to see if both countries converge in total and in industrial GVApc, reducing their gap. Furthermore, in order to assess if labour productivity is one of the main determinants of GVApc, we undertake the decomposition of GVApc (Raymond and Garcia-Greciano, 1994; Lladós-Masllorens, 2002; Mas et al., 2012). The results confirm that differences in productivity are significant and persistent in the considered time period. The fourth section is devoted to the analysis of the productive structure in each country and of the differences in their composition.To
this end, we proceed to calculate an index of structural inequality that will conclude whether or not there has been a convergence between the two production structures. Section 2.5 summarizes the main findings and conclusions.
2.2. Data
To carry out this study we use the EU KLEMS Growth and Productivity Accounts (henceforth EUKLEMS; http://www.euklems.net)2 which contain internationally comparable data for output and inputs. This database includes a wide range of measures on output growth, employment, skill creation, capital formation and multi-factor productivity at the industrial level for EU member states from 1970 until 2007.
As Timmer et al. (2007a and 2007b) states the main advantage of EU KLEMS database is that it allows going beyond the aggregate level of economy to analyse the
2 More detailed explanation on the methodology followed to define and to obtain the variables is
17
productivity performance of individual industries and their contribution to aggregate growth.
The data used in this paper covers the period from 1993 to 2007 for Spain and Germany. In all figures, tables and formulae E stands for Spain and Ger for Germany. Our analysis is implemented both at aggregate level as well as for individual branches of manufacturing industry. The dataset used here consists of 23 goods-producing industries that correspond to the 2-digit ISIC Revision 3.0. For a list of industries, see table 2.A.1.
Data on Population (P) and Labour force (LF) are obtained from Eurostat, both are annual averages expressed in millions. Labour force is defined as population in working age between 15 and 64 years and is necessary to compute the rate of employment and the rate of activity of the whole economy (in the next section). The rest of variables used in this paper are provided by EUKLEMS. Our output measure is gross value added at basic prices 1995=100, labour productivity is defined in terms of hours worked as well as all the variables needed for the analysis, where appropriate. All monetary variables are expressed in Euros 1995 =100.
2.3. Main sources of Gross Value Added per Capita in Manufacturing
In this section we examine the following aspects: on the one hand, if differences in per capita income of the Spanish and German total economy have become less and if this is also the case for manufactures between 1993 and 2007.
On the other hand, we examine whether or not labour productivity per hour is one of the main determinants of differences in gross value added per capita among manufacturing industries in Spain and Germany. Furthermore, in order to check if differences in labour productivity between Spain and Germany are significant and persistent in time, we will carry out a static and a dynamic analysis.
With this aim, we take as a reference a rather useful decomposition of per capita income, which have been applied by several authors such as Raymond and García-Greciano (1994), Lladós-Masllorens (2002) and Mas et al. (2012):
18
where GVAT stands for gross value added of the total economy; P for total population and LF represents the labour force of total economy, that is the population of working ages from 16 to 65. GVAI for gross value added in the manufacturing industry; HI is total hours worked; LI is total employment (in people). All these variables are related to manufactures (denoted with subindex I).
Therefore, the term on the left-hand side of (2.1) measures per capita income of total economy which can be decomposed into five ratios displayed on the right-hand side. These are as follows: the first one is per capita income of total economy over per capita income of manufacturing (GVAT/GVAI) which indicates to what extend total economy value-added is determined by manufactures’ value added; the second one (GVAI/H = LP) measures labour productivity in terms of hours worked; the third one (HI/LI) total hours worked per employed person; the fourth one (LI/LF) the employment rate and the last component (LF/P) is the activity rate.
Let us start by examining briefly the left hand-side part of equation (2.1). Figure 2.1 displays the evolution of GVAT/P in both countries, in it we can appreciate the gap and its persistence between Spain and Germany. Although data contained in table 2.1 panel (c) row (1) indicate a slight approximation: in 1993 the ratio between Spain’s and Germany’s GVAT/P was 50.8% and increased in 2007 up to 55.8%, from this we can conclude that it did not alter the trend of the Spanish per capita income.
19
Table
1
2.1. Gross Value-Added per Capita Decompos
ition
in Manufacturing. Spai
n and Germany, 1993-2007
Millions of eu
ros 1995 =100 (average annual growth rates in %) 1993
1999 2003 2007 1993-200 7 (c) 1993-199 8 (c) 1999-200 2 (c) 2003-200 7 (c)
(a) Spain GVA
T /P 10, 12 6 11, 99 2 12, 98 9 14, 00 0 2.3 2.6 2.4 1.9 GVA T /GVA I(a ) 5.3 5.1 5.4 5.9 0.7 -1.1 1.5 2.3 Labour produ cti vit y (LP) 17. 0 18. 7 19. 7 21. 2 1.6 1.5 0.9 1.9 Number of hours worked b y engaged person ( H I /L I ) 1,7 54 1,7 39 1,6 73 1,6 12 -0.6 0.2 -0.7 -0.9 Employm
ent rate (
LI /LF) (a) 0.1 0.1 0.1 0.1 0.4 1.8 0.5 -1.5 Activit
y rate (
L F/P) (a) 0.7 0.7 0.7 0.7 0.2 0.3 0.1 0.1
(b) Germany GVA
T /P 19, 92 4 22, 06 4 22, 94 5 25, 09 3 1.6 1.7 1.4 2.2 GVA T /GVA I(a ) 4.4 4.6 4.6 4.3 -0.1 0.9 0.3 -1.7 Labour produ cti vit y (LP) 26. 6 32. 1 36. 1 43. 2 3.5 3.4 2.8 4.5 Number of hours worked b y engaged person ( H I /L I ) 1,5 14 1,5 01 1,4 52 1,4 56 -0.3 -0.1 -1.1 0.1 Employm
ent rate (
LI /LF) (a) 0.2 0.1 0.1 0.1 -1.3 -2.4 -0.1 -0.5 Activit
y rate (
L F/P) (a) 0.7 0.7 0.7 0.7 -0.2 -0.1 -0.4 -0.1
(c) Ratio Sp
ain/Germany (b) GVA T /P 50. 8 54. 3 56. 6 55. 8 140 .4 154 .2 168 .5 83. 7 GVA T /GVA I 122 .2 109 .6 117 .0 137 .2 -964. 5 -1 24. 6 572 .7 -136. 7 Labour prod uc tivit y (LP) 64. 1 58. 4 54. 4 49. 2 45. 4 44. 1 33. 2 43. 1 Number of hours worked b y engaged person ( HI /L I ) 115 .9 115 .9 115 .2 110 .7 218 .5 -252. 6 66. 7 -1 ,32 8.1 Employm ent rate (L I /L F) 56. 9 72. 9 75. 2 72. 2 -3 4.8 -73.3 -343. 7 318 .7 Acti vit y r ate ( L F/ P) 98. 5 100 .5 102 .7 103 .6 -76.7 -258. 3 -31.9 -60.6 Notes
: (a) Figures i
n %
; (b) Weight S
pain o
ve
r Germany i
n %; (c) A
verag
e a
nnua
l growt
h rate i
20
Figure12.1. GVA per Capita in total Economy. Germany and Spain, 1993-2007
Millions of euros 1995 =100
GVAT/PGer GVAT/PE
Source: EU KLEMS (2009), www.euklems.net,Eurostat,
http://ec.europa.eu/eurostat/web/national-accounts/data/database and own calculations.
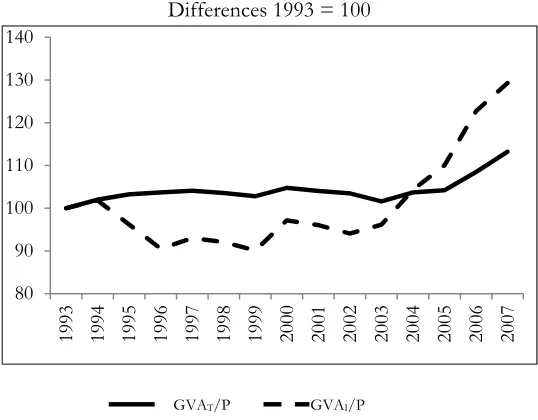
Figure22.2. GVA per Capita decomposition. Spain minus Germany
Differences 1993 = 100
GVAT/P GVAI/P
Source: EU KLEMS (2009), www.euklems.net Eurostat,
http://ec.europa.eu/eurostat/web/national-accounts/data/database and own calculations.
0 5,000 10,000 15,000 20,000 25,000 30,000
1993 1994 1995 1996 1997 1998 1999 2000 2001 2002 2003 2004 2005 2006 2007
80 90 100 110 120 130 140
[image:34.595.163.432.437.647.2]
21
In figure 2.2 it can be appreciated how differences in GVAI/P between Spain and Germany are rapidly increasing whereas the gap in GVAT/P is growing slower. Specifically from 2002 onwards the manufactures’ per capita income differences started to soar. The same happened to the GVAT/P a little later but with less intensity.
Data in table 2.1 show that the slight approximation in total economy per capita income can’t be attributed to manufactures’ productivity because ratios decreased, at the beginning of the period this ratio was 64.1% and at the end 49.2% (table 2.1. panel (c) row (3)). In the whole period Spanish GVAT/P grows at an average annual rate of 2.3% while Germany’s rate is 1.6% (table 2 panels (a) and (b)). This faster growth of the Spanish economy does not shorten the distance in relation to Germany, on the contrary, the difference in GVAT/P has become greater. Looking at its performance in the three subperiods (table 2.1 panel (c) row 1 columns 7 to 9), it can be appreciated that Spain’s growth rates are approximately 54-68% higher than the German ones, except for the subperiod of 2003-2007. The boom of the Spanish construction sector has played here a key role in boosting economic growth.
The main reading of this behaviour is that Spain seems to have neglected its manufacturing industry in terms of investments in technological capital in key sectors and also in human capital. This may explain why now obviously the Spanish manufacturing industry is not able to generate value added at the same rate as the German one. That means the German manufacturing industry has undergone the necessary adjustments in contrast to Spain, which seems as if it is not able to overcome historical problems and thus lost weight in the overall economy (see also table 2.1).
And now let examine the right-hand-side of expression (2.1) that is to analyze the sources of differences in gross value added per capita in manufacturing industries. At first we will look at the status quo at the beginning and at the end of the considered period in order to compare both and also to assess the differences among both industries. Afterwards we study the variables’ evolution that is from a dynamic point of view.
22
the two countries are substantial and confirm that labour productivity is one of the main drivers of per capita income together with the number of hours worked per employed person (HI/LI) in both industries in the whole period. Furthermore both manufacturing industries show a considerable dispersion among the variables and the subperiods. Differences in labour productivity increases its importance, while number of hours worked reduces it. The behaviour of the rest of variables plays a little role in industrial per capita income.
In table 2.1 panels (a) and (b), we can see that not only German values are significantly higher than the Spanish ones, but the gap between both industries has increased, displaying a persistent trend (panel c). Germany’s productivity grows at 3.5% while Spain only at a 1.6%, showing a sluggish behaviour in contributing to value added growth (table 2.1 panels (a) and (b)). This reflects the greater capacity of German industry to generate value added. This ability can be explained either by an increased production efficiency, by a greater qualification of human capital, by a larger stock of capital (it incorporates more technical progress) or a combination of all these factors. Taking a look at the weights of the different variables (table 2.1 panel (c)) that intervene in decomposition, we see that all of the Spanish components have lost weight in relation to Germany considering the whole period. The only exception is the employment rate and to a less extent the activity rate. In contrast, we appreciate a slight approximation in per capita income of total economy, which cannot be attributed to manufactures as figures in table 2.1 show.
In fact, if we look at the employment rate in both industries, they are similar, though somewhat smaller in Spain. This is indicative of less specialization of the Spanish economy in the industrial sector. The total number of hours worked per engaged person in Spanish industry is slightly larger than the German, while the employment rate is a bit smaller. There are engaged persons working in the Spanish industry, but they work more hours than their German counterparts. Thus one would expect then a higher industrial value added than observed. A possible explanation for this fact is that in Spain the proportion of hours worked in the industrial sector in relation to total hours worked in all sectors of production is lower than in Germany. This lower relative importance of the manufacturing sector in the Spanish economy, along with a reduced ability to generate value added and a lower productivity show that Spanish industry suffers inefficiencies that prevent to progress at the same rate as the German industry.
23
This was the situation at different concrete moments of the period examined, 1993, 1999, 2003 and 2007. But which has been the evolution between 1993 and 2007 and different subperiods: 1993-1998, 1999-2002 and 2003-2007? The variables for these subperiods (table 2.1) are expressed in percentage average annual growth rates. The aim is to confirm the significance and persistence of the differences between Spain and Germany.
From this table, we can see that over the whole period both countries show significant dispersion in their growth rates, particularly Germany. In the subperiods, labour productivity is still one the main variables explaining the performance of
GVAT/P in manufacturing. In the period 1993-1998 both GVAT/P and
employment in Spain grew at a very fast rate, while in Germany both variables showed a sluggish pace. At this point it’s important to say that Germany’s industry is undertaking an adjustment mainly due to German reunification, which lasts approximately from 1993 to 2002. Subperiod 1999 to 2002 is characterized by a slowdown in productivity and the rest of determinants of per capita income. This trend is not only maintained but worsened in the case of Spanish industry with the exception of labour productivity in the last subperiod, 2003-2007. On the contrary Germany increases its per capita gross value added and labour productivity significantly, while the other determinants show a slight improvement. Spain presents a very poor performance in labour productivity although the severe employment destruction in the last subperiod.
Figure 2.3 displays the differences between Germany and Spain taking 1993 =100. The most striking fact is how from 1993 on up to 2007 the gap in labour productivity grows at a rapid pace. Its performance confirms again that it is one of the main determinants of the differences in per capita income in manufacturing and that these differences are persistent.
24
Figure32.3. GVApc, Labour Productivity and Number of Hours Worked by Engaged Person. Spain minus Germany, 1993-2007
Differences 1993 = 100
Source: EU KLEMS (2009), www.euklems.net and own calculations.
2.4. Changes in Manufacturing Specialization
Up to now, we have seen that there are no signs indicating a reduction of the gap in manufacturing labour productivity between Spain and Germany from 1993 to 2007. The question posed in this section is if the differences in the manufacturing industry specialization among both countries justify the existing differences in manufacturing labour productivity. To this end, we implement two kind of analysis. Firstly, we start by focusing on the productive structure in each country and then we compare them looking at the differences in their composition. To this aim we make use of two indexes (Pérez García et al., 2006) to compute the share of each manufacturing branch value added in total manufacturing value added3.
In this section we start analysing separately how the composition in the productive structure in terms of sectoral GVA over the total manufacturing GVA of the Spanish and the German manufactures has changed in the considered time period, that is from 1993 up to 2007. To this end, the weight of each manufacturing branch in total manufacturing in terms of value added is computed. What we want to check is if these manufacturing industries have changed its productive structure
3 The same exercise has been replicated using sectoral labour’s share with similar qualitative results.
0 50 100 150 200 250
1993 1994 1995 1996 1997 1998 1999 2000 2001 2002 2003 2004 2005 2006 2007
Labour productivity (LP)
25
composition from low-performing productivity branches to high-performing ones in the considered period,
Then the next step is to compare them in order to see to which extent they have similar productive structures or no. So, if a country’s manufacturing industry displays a higher weight of high-performing productivity sectors than the other one, this would mean that the first country is more competitive and more capable to generate value added.
Firstly, we compare the compositional differences between the same manufacturing sector at two points in time (t = 0 and t= T) using a structural change index L0T. This provides us information about the presence of changes in the productive structure of each manufacturing industry. According to Pérez García et al. (2006),
L0T index is defined, as follows:
ͳͲͲ ʹ
ͳ
ͳ Ͳ
Ͳ
¦
u
(2.2)
where Xj0 is the weight of sector j in total manufactures in the initial period 0 and
Xjt is the weight of sector j in total manufactures in the final period T. The index L0T
measures therefore the magnitude of change of sectoral specialization between these two periods and takes larger values, the more intense the change. Specifically, the index is bounded between 0 and 100 and expresses in terms of percentages the changes in the composition of production.
Secondly, we compare both manufacturing structures to see if they show up differences among them and, if affirmative, to detect whether there has been an approach between them or not in the considered period.
To this end, we compute the index of differences in manufactures’ composition (LAB) which is identical to L0T but referred to two industries, A and B, in the same period. It is computed according to (2.3):
ͳͲͲ ʹ
ͳ
ͳ
u
¦
(2.3)
26
lower the similarity. In this analysis, country A is Spain (E) and B is Germany (Ger), so henceforth LAB will be LE-Ger.
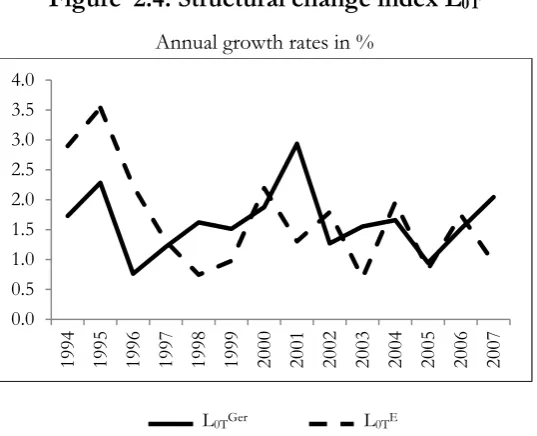
Figures 2.4 and 2.5 each offer an overview of the behaviour of both indexes, respectively L0T (L0TGer for Germany and L0TE for Spain) and LE-Ger. In particular, figure 2.4 shows the performance of structural change index L0TE for Spain and
L0TGer for Germany, here we observe that both manufacturing industries show a
great variability, indicating that both have implemented changes in its production composition. But the small values of the index L0T indicate that they haven’t been
significant. Figure 2.5 displays the evolution of the index of differences in manufactures’ composition LE-Ger, in it we can appreciate how the differences between Spain and Germany have grown from 21.6% to 25.7%. More concretely, the declining trend of the index of differences in manufactures’ composition LE-Ger, changes with the entrance in force of the Economic and Monetary Union (EUM), since that moment differences in manufacturing composition start growing.
Figure42.4. Structural change index L0T
Annual growth rates in %
L0TGer L0TE
Source: EU KLEMS (2009), www.euklems.net and own calculations.
0.0 0.5 1.0 1.5 2.0 2.5 3.0 3.5 4.0
[image:40.595.165.434.370.588.2]
27
Figure52.5. Index of differences in industries’ composition, L E-Ger.
In percentages
Source: EU KLEMS (2009), www.euklems.net and own calculations.
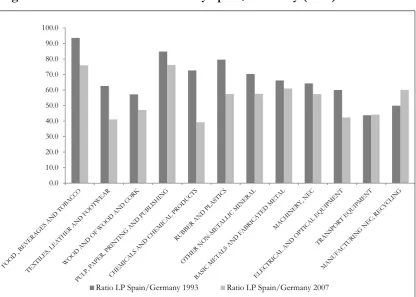
Figure62.6. Ratio Labour Productivity Spain/Germany (in %) 1993 and 2007
Source: EU KLEMS (2009), www.euklems.net and own calculations
0.0 5.0 10.0 15.0 20.0 25.0 30.0
1993 1994 1995 1996 1997 1998 1999 2000 2001 2002 2003 2004 2005 2006 2007
0.0 10.0 20.0 30.0 40.0 50.0 60.0 70.0 80.0 90.0 100.0
[image:41.595.90.507.384.681.2]28
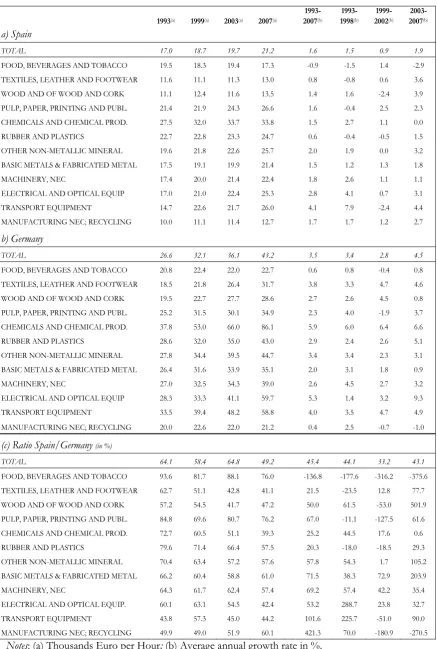
Table22.2. Labour Productivity. Spain - Germany, 1993-2007
1993(a) 1999(a) 2003(a) 2007(a)
1993-2007(b)
1993-1998(b)
1999-2002(b)
2003-2007(b)
a) Spain
TOTAL 17.0 18.7 19.7 21.2 1.6 1.5 0.9 1.9
FOOD, BEVERAGES AND TOBACCO 19.5 18.3 19.4 17.3 -0.9 -1.5 1.4 -2.9
TEXTILES, LEATHER AND FOOTWEAR 11.6 11.1 11.3 13.0 0.8 -0.8 0.6 3.6
WOOD AND OF WOOD AND CORK 11.1 12.4 11.6 13.5 1.4 1.6 -2.4 3.9
PULP, PAPER, PRINTING AND PUBL. 21.4 21.9 24.3 26.6 1.6 -0.4 2.5 2.3
CHEMICALS AND CHEMICAL PROD. 27.5 32.0 33.7 33.8 1.5 2.7 1.1 0.0
RUBBER AND PLASTICS 22.7 22.8 23.3 24.7 0.6 -0.4 -0.5 1.5
OTHER NON-METALLIC MINERAL 19.6 21.8 22.6 25.7 2.0 1.9 0.0 3.2
BASIC METALS & FABRICATED METAL 17.5 19.1 19.9 21.4 1.5 1.2 1.3 1.8
MACHINERY, NEC 17.4 20.0 21.4 22.4 1.8 2.6 1.1 1.1
ELECTRICAL AND OPTICAL EQUIP 17.0 21.0 22.4 25.3 2.8 4.1 0.7 3.1
TRANSPORT EQUIPMENT 14.7 22.6 21.7 26.0 4.1 7.9 -2.4 4.4
MANUFACTURING NEC; RECYCLING 10.0 11.1 11.4 12.7 1.7 1.7 1.2 2.7
b) Germany
TOTAL 26.6 32.1 36.1 43.2 3.5 3.4 2.8 4.5
FOOD, BEVERAGES AND TOBACCO 20.8 22.4 22.0 22.7 0.6 0.8 -0.4 0.8
TEXTILES, LEATHER AND FOOTWEAR 18.5 21.8 26.4 31.7 3.8 3.3 4.7 4.6
WOOD AND OF WOOD AND CORK 19.5 22.7 27.7 28.6 2.7 2.6 4.5 0.8
PULP, PAPER, PRINTING AND PUBL. 25.2 31.5 30.1 34.9 2.3 4.0 -1.9 3.7
CHEMICALS AND CHEMICAL PROD. 37.8 53.0 66.0 86.1 5.9 6.0 6.4 6.6
RUBBER AND PLASTICS 28.6 32.0 35.0 43.0 2.9 2.4 2.6 5.1
OTHER NON-METALLIC MINERAL 27.8 34.4 39.5 44.7 3.4 3.4 2.3 3.1
BASIC METALS & FABRICATED METAL 26.4 31.6 33.9 35.1 2.0 3.1 1.8 0.9
MACHINERY, NEC 27.0 32.5 34.3 39.0 2.6 4.5 2.7 3.2
ELECTRICAL AND OPTICAL EQUIP 28.3 33.3 41.1 59.7 5.3 1.4 3.2 9.3
TRANSPORT EQUIPMENT 33.5 39.4 48.2 58.8 4.0 3.5 4.7 4.9
MANUFACTURING NEC; RECYCLING 20.0 22.6 22.0 21.2 0.4 2.5 -0.7 -1.0
(c) Ratio Spain/Germany (in %)
TOTAL 64.1 58.4 64.8 49.2 45.4 44.1 33.2 43.1
FOOD, BEVERAGES AND TOBACCO 93.6 81.7 88.1 76.0 -136.8 -177.6 -316.2 -375.6
TEXTILES, LEATHER AND FOOTWEAR 62.7 51.1 42.8 41.1 21.5 -23.5 12.8 77.7
WOOD AND OF WOOD AND CORK 57.2 54.5 41.7 47.2 50.0 61.5 -53.0 501.9
PULP, PAPER, PRINTING AND PUBL. 84.8 69.6 80.7 76.2 67.0 -11.1 -127.5 61.6
CHEMICALS AND CHEMICAL PROD. 72.7 60.5 51.1 39.3 25.2 44.5 17.6 0.6
RUBBER AND PLASTICS 79.6 71.4 66.4 57.5 20.3 -18.0 -18.5 29.3
OTHER NON-METALLIC MINERAL 70.4 63.4 57.2 57.6 57.8 54.3 1.7 105.2
BASIC METALS & FABRICATED METAL 66.2 60.4 58.8 61.0 71.5 38.3 72.9 203.9
MACHINERY, NEC 64.3 61.7 62.4 57.4 69.2 57.4 42.2 35.4
ELECTRICAL AND OPTICAL EQUIP. 60.1 63.1 54.5 42.4 53.2 288.7 23.8 32.7
TRANSPORT EQUIPMENT 43.8 57.3 45.0 44.2 101.6 225.7 -51.0 90.0
MANUFACTURING NEC; RECYCLING 49.9 49.0 51.9 60.1 421.3 70.0 -180.9 -270.5
Notes: (a)Thousands Euro per Hour; (b) Average annual growth rate in %.
[image:42.595.79.517.92.742.2]
29
The main conclusion is that Spain has not undergone significant changes in its composition of production, concentrating its production in less productive branches which are thus less exposed to competence in comparison to Germany. This is confirmed in terms of labour productivity in figure 2.6 and table 2.2, the data indicates that particularly traditional productive activities intensive in labour, as Food, beverages and tobacco and Textiles, leather and footwear, display a significant drop in labour productivity. Despite the fact that between 1993 and 2007 the rate of employment in Spain increased significantly and that capital accumulation was an important contributor of value added (Mas et al., 2012; Pérez et al., 2006), Spanish manufacturing shows little ability to generate value added and an unfavourable manufacturing’s specialization. In fact, Spain displays a higher average growth rate of capital services (3.0%) than Germany (1.2%)4 in the considered period. This indicates that it is not mainly a matter of factors’ accumulation, but of a poor labour productivity performance.
Figure 2.6 displays the ratio of labour productivity between Spain and Germany for 1993 and for 2007 for each manufacturing branch. In all branches Spain loses weight in front of Germany, particularly in high and medium performing productivity branches as Chemicals and Chemical Products and Electrical and Optical Equipment. The ratio is remains unchanged in Transport Equipment and increases in Manufacturing NEC; Recycling. This behaviour reinforces the above mentioned conclusions. Having a look at table 2.2 panel (c) data show how the labour productivity ratio between Spain and Germany has decreased between 1993 and 2007, from 64% to 49%. Spanish labour productivity has lost weight in relation to the German one, despite having grown at annual rate of 1.6% in the considered period, it doesn’t achieve to approach the German growth rate (3.5%). Although Spain manufacturing industry is still focused on medium to low technology branches, it is not able to achieve a sustainable productivity growth also in these branches (for example see Textiles, leather and footwear, Basic metals and fabricated metallic products). The data reveal how Spanish manufactures are still mainly specialized less technology intensive sectors, which have exhausted their advantages and need to develop new strategies to increase their competitiveness (Trullén, 2007). So new strategies are needed to promote improve labour productivity performance in high and medium technology manufacturing branches like Transport equipment (Aerospace), Chemicals and Chemical Products and Electrical and Optical Equipment.
30
2.5. Conclusions
In this chapter we have analyzed the sources in labour productivity differences between the Spanish and German manufacturing industry in the period 1993-2007. To this end we posed several questions in order to single out the factors that may determine this gap, taking Germany as the benchmark country. The first one was to confirm that the Spanish and German differences in per capita income of the total economy are reducing whereas on the contrary the one in manufacturing industry does not. Data shows that this is not the case: Spanish and German differences in per capita income of the total economy remained relatively stable until the last subperiod, when they started to increase (figure 2.2). Albeit the strong increase of the employment rate and of capital accumulation (Mas et al., 2012) in Spanish manufacturing in the considered period, the ability to generate value added remains low.
Per capita income differences between Spanish and German manufacturing industry are growing, particularly in the last subperiod. Spanish per capita income in manufacturing industry is losing weight in relation to Germany. The gap between per capita income of the Spanish and German in total and manufacturing industry is increasing. Next, we carried out a decomposition analysis of per capita income in order to assess the influence of labour productivity The results obtained confirmed that not only that the differences in productivity were one of the main determinants, but that they were also significant and persistent along the considered period.
31
The results obtained in this chapter raise the question for a need of a change in industrial policy (Legarda and Hidalgo, 2011; Myro, 2012 and 2014; Trullén, 2007;
Valero, 2013), specifically to implement strategies based on "focusing" in
manufacturing industry branches of high knowledge economy or programs with a strong technological component (Martínez et al. 2014; Trullén, 2007). Spain’s manufacturing industry is still mainly specialized in medium to low-technology
sectors. The specialization in low-technology sectors implies a lower propensity to
innovation. The industrial strategy of the so-called European engines, such as France and Germany, postulates the increasing specialization in technology and knowledge intensive industries. This “focusing” strategy was followed in the past by Japan and the United States, and is behind the development of new technologies such as ICT, biotechnology and nanotechnology.
The role of industrial policy is to rule changes in production and, in particular, to enable processes to substantially increase productivity. It is relevant to point out that the period between 1993 and 2007 was a time of less interventionism by the government and of a more industrial market driven policy. As noted by the European Commission (2005), the health of the manufacturing sector is essential for economic growth. In addition the industry has spillover effects that far outweigh the services, particularly regarding intermediate consumption.
As a consequence of the economic crisis the Spanish government, in order to improve manufacturing labour productivity performance, is committed to generate qualified employment -of high-technological level-, to improve competitiveness in foreign markets and to increase the weight of the industrial sector, focusing mainly on manufactures, in national GDP (Martínez et al.; 2014;. Myro, 2014; Rodríguez, 2012 and Trullén; 2007).
Already in the period between 1993 and 2007 the proposed industrial policy in Spain aimed to support and implement these priorities, but as we can see in the present without obtaining a better performance of manufacturing labour productivity. Probably, this is due to the fact that it coincided with a time characterized by a less government’s interventionism and consequently the kind of industrial policy measures implemented.
In order to promote labour productivity growth in Spanish manufacturing, there is a need for a resurgence of an active industrial policy.
32
questions on further determinants of aggregate productivity changes that will be explored in further research.