HBsAg expression of liver correlates with histological activities
and viral replication in chronic hepatitis B
Pin-Nan Cheng,*, Yen-Cheng Chiu,*, Hung-Wen Tsai,**
Ru-Hsueh Wang,*** Hung-Chih Chiu,* I-Chin Wu,* Ting-Tsung Chang*,****
* Department Internal Medicine, ** Department of Pathology, and *** Department of Family Medicine, **** National Cheng Kung University Hospital; Institute of Medicine, Medical College of National Cheng Kung University, Taiwan.
Contributed equally to this work.
ABSTRACT
Introduction. The intrahepatic hepatitis B surface antigens (HBsAg) expression is related to disease pro-gression of chronic hepatitis B. We examined the features of intrahepatic HBsAg expression. Material and methods. A total of 181 patients with e antigen positive chronic hepatitis B were enrolled. Patterns and semi-quantitative measurement of intrahepatic HBsAg expression were analyzed. The association of intra-hepatic hepatitis HBsAg expression with clinical, viral, and histological characteristics was evaluated. Re-sults. Higher necroinflammation grade and greater fibrosis stage accompanied with lower serum HBV DNA and HBsAg levels were observed in patients with type II ground glass hepatocytes and 2+/3+ scales of in-trahepatic HBsAg expression. Basal core promoter T1762/A1764 mutations were strongly associated with the pattern of type II ground glass hepatocytes expression (P < 0.001) and higher level of HBsAg expression (9.3 ± 8.0% vs. 4.3 ± 5.0%, P = 0.008). In multivariate analysis, basal core promoter mutations (Odds ratio: 6.356, 95% confidence interval: 1.204 ~ 33.356, P = 0.029) was associated with 2+/3+ scale of HBsAg expres-sion. Concluexpres-sion. Both pattern and levels of intrahepatic HBsAg expression were associated with severity of liver disease in e antigen positive chronic hepatitis B. Strong relationship between intrahepatic HBsAg expression and basal core promoter 1762/A1764 mutations indicated that HBsAg expression may be the his-tological manifestation of hepatitis B virus genomic evolution under host immune surveillance.
Key words. Basal core promoter. Intrahepatic HBsAg. Chronic hepatitis B.
Correspondence and reprint request: Ting-Tsung Chang, M.D.
Department of Internal Medicine, National Cheng Kung University Hospital, 138 Sheng-Li Road, Tainan 704, Taiwan.
Tel.: +886 6 2766116. Fax: +886 6 2347270 E-mail: [email protected]
Manuscript received: June 04, 2014. Manuscript accepted: July 24, 2014. INTRODUCTION
Hepatitis B virus (HBV) infection is the most common cause of liver cirrhosis and hepatocellular carcinoma in most parts of Asia.1,2 The pathogenesis of chronic hepatitis is mediated by the interaction of the host immune reaction and the hepatocytes that present HBV antigens.3,4 Earlier studies have dem-onstrated that the expression of HBV antigens by hepatocytes is importantly related to the stage and activity of chronic liver disease. In the immune tol-erance phase, hepatitis B core antigens (HBcAg) are mostly found in the nucleus and correlate with HBV
Among the phases of chronic hepatitis B, im-mune-clearance phase or named as HBeAg-positive chronic hepatitis B often occurred in younger popu-lation, exhibited less severe histological activities, and harbored fewer rates of precore A1896 mutation and basal core promoter (BCP) T1762/A1764 muta-tions than HBeAg-negative chronic hepatitis B.11-14 The course of chronic hepatitis B is dynamic that re-sulted from interaction of viral replication and host immune system. Consequently, diversity in clinical features or histological activities is commonly ob-served in HBeAg positive patients. For example, 34 to 55% of patients exhibit bridging fibrosis or cir-rhosis in liver histology, while the remaining pa-tients exhibit mild fibrosis.15,16 HBsAg accumulation in hepatocytes has been shown to associate with specific viral mutations and related to disease activi-ties.8,9 It is interesting to investigate the character-istics of intrahepatic HBsAg expression in patients with different severity of liver histology.
Viral mutants usually evolved under host immune surveillance pressure. Among naturally occurring HBV mutants, BCP T1762/A1764 mutations became prevalent as disease progression and has been fre-quently found to be associated with advanced liver disease and hepatocellular carcinoma.17,18 Patterns of intrahepatic HBsAg expression also changed dur-ing natural course of chronic hepatitis B. The asso-ciation of BCP T1762/A1764 mutations and the intrahepatic HBsAg expression is still unknown and remained to study.
Therefore, the aim of this study was to evaluate the features of intrahepatic HBsAg expression and analyze the association with liver histology, viral replication markers, and HBV mutants in HBeAg positive chronic hepatitis B.
MATERIAL AND METHODS
Patients
A total of 181 treatment-naïve hepatitis B e anti-gen (HBeAg) positive patients who met the inclu-sion criteria were retrospectively enrolled in this study. The inclusion criteria were an age of over 18 years and less than 70 years, positive serum HBsAg for more than 6 months and serum HBV DNA level
≥ 100,000 copies/mL, abnormal serum alanine ami-notransferase level, no other explainable etiology of chronic hepatitis, including alcohol, autoimmune hepatitis or markers of hepatitis C virus, hepatitis D virus, or human immunodeficiency virus infec-tion, and the lack of a history of anti-HBV
treat-ment history and specimen of liver biopsy available for histological evaluation. The serum and liver bi-opsy of all of the patients were sampled before anti-viral treatments, and the samples were stored at -70 oC until testing. This study was approved by the Institutional Review Board of National Cheng Kung University Hospital (No: ER-99-398). Informed con-sent was obtained, according to the Declaration of Helsinki.
HBV virological assays
HBV genotyping was performed by the multiplex polymerase chain reaction, as described elsewhere.19 Serum HBV DNA level was measured using the CO-BAS Amplicor HBV Monitor test (COCO-BAS-AM as-say, Roche Diagnostics, Branchburg, NJ). Serum HBsAg level was quantified by Abbott Architect HB-sAg QT (Abbott Diagnostics, Rungis, France) with a dynamic range of 0.05-250.0 IU/mL. Samples with HBsAg levels > 250 IU/mL were retested at dilu-tions of 1:20 and 1:1000.
Polymerase chain reaction and sequencing of precore and BCP regions
HBV DNA was extracted from 50 μL of serum us-ing Blood and Tissue Genomic Mini Kit (VIOGENE, Taipei, Taiwan). First-round PCR was performed under the following conditions: 96 oC for 2 min, 94 oC for 1 min, 54 oC for 1 min, and 72 oC for 2 min with primers 5’-ACCTCTGCACGTAGCATGG (for-ward) and 3’-GGATTAAAGACAGGTACAGTAGAAG (reverse). Second-round PCR was performed under the same conditions with primers 5’-ATGTCAAC-GACCGACCTTGA (forward) and 3’-TTCCCACCT-TATGAGTCCAAG (reverse). Purified PCR products were then direct sequencing using an automated DNA sequencer ABI 310 and the ABI PRISM Big Dye Terminator Cycle Sequencing Ready Reaction Kit (Applied Biosystems) with the forward primer that was utilized during in the second-round PCR.
Liver histology
Liver histology was evaluated by a single patholo-gist who was unaware of the backgrounds of the pa-tients. Necroinflammation and fibrosis were evaluated based on the Knodell necroinflammation grade (ranging from 0 to 18)20 and the Ishak fibro-sis stage (ranging from 0 to 6),21 respectively.
m-thick sections were incubated with monoclonal mouse anti-HBsAg (Clone 3E7, Dako Corp., Carpinteria,USA) and anti-HBcAg (Novocastra Lab-oratories, Newcastle, UK) overnight at 4°C. The op-timal dilution of anti-HBsAg or anti-HBcAg was determined using liver tissue from HBV carrier as a positive control. The StrAviGen Super Sensitive MultiLink Kit (BioGenex) was used to detect the re-sulting immune complex. Peroxidase activity was visualized by an aminoethyl carbazole substrate kit (Zymed Laboratory, Inc, San Francisco, CA). Final-ly, sections were counterstained with hematoxylin. As a negative control, non-immune mouse immu-noglobulin was substituted for primary antibody in the incubation. Patterns of HBcAg expression by the nucleus, cytoplasm, or both, were recorded. Pat-terns of HBsAg expression were classified as homog-enous, type I GGH, type II GGH.22 Homogeneously stained hepatocytes were identified as hepatocytes with moderate to strong homogeneous cytoplasmic staining; type I GGHs were identified as hepatocytes with dense globular or “inclusion-like” staining, and type II GGHs were identified as hepatocytes with surface antigen staining at the cell margins or periphery.6,22 Type I GGHs scatter singly or cluster in the hepatic lobules while type II GGHs consist-ently cluster in nodules. The expression levels of HBcAg and HBsAg were scored semi-quantitatively according to the proportion of immunolabelled cells, on a 0 to 4+ scale, corresponding to positivity in 0, 1-10, 11-25, 25-50% and more than 50% of the exam-ined hepatocytes.
Statistical analyses
Data were expressed as mean ± standard devia-tion. Continuous variables were compared using the Mann-Whitney U test or Kruskal-Wallis ANOVA for univariate analysis. Categorical variables were analyzed using χ2 test or Fisher’s exact test. Inde-pendent factors that were associated with levels of intrahepatic HBsAg expression were carried out us-ing multivariate logistic regression analysis. Data handling and statistical analyses were performed us-ing the SPSS software for Windows, version 17.0 (SPSS Inc., Chicago, IL).
RESULTS
Characteristic of enrolled patients
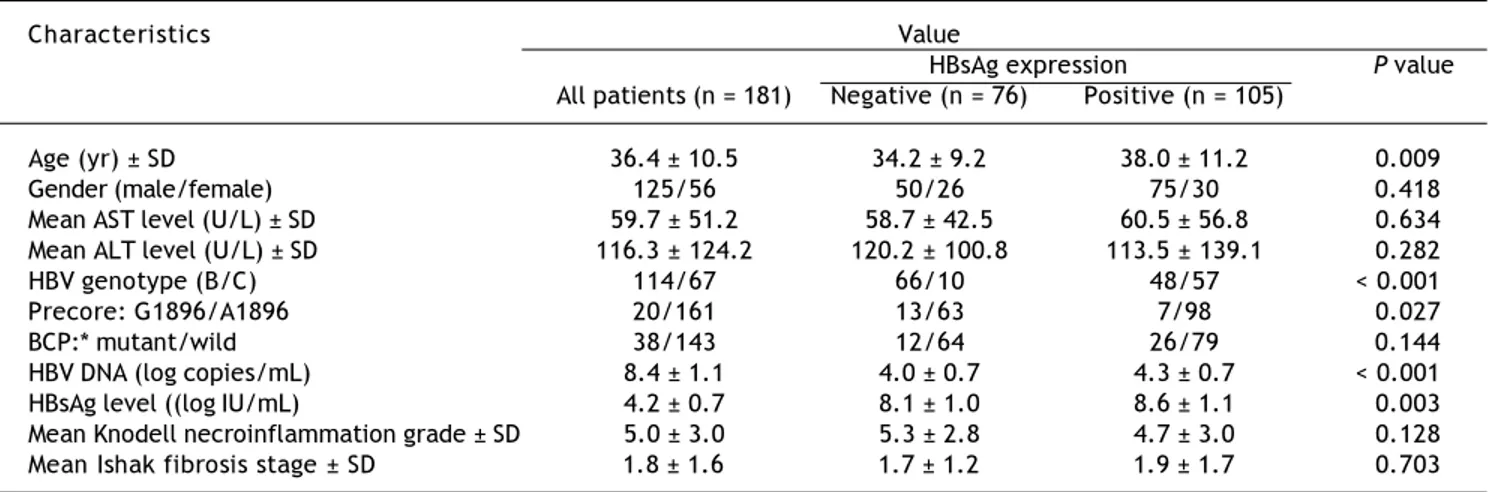
Table 1 lists the demographic characteristics of the 181 enrolled patients. Most of the patients were male (69.1%) and 63.0% of them exhibited HBV genotype C. The precore A1896 mutation was detected in 20 patients (11.0%) and the BCP T1762/A1764 mutations was detected in 38 pa-tients (21.0%). Of the 181 papa-tients, positive HB-sAg staining was detected in 105 patients (58.0%). Patients with HBsAg staining exhibited signifi-cantly higher serum HBsAg (P < 0.001) and HBV DNA levels (P = 0.003), greater prevalence of gen-otype C (P < 0.0001), lower prevanlence of pre-core A1896 mutation (P = 0.027), and older age (P = 0.009).
Table 1. Clinical, virological, and histological characteristics of the 181 patients.
Characteristics Value
HBsAg expression P value
All patients (n = 181) Negative (n = 76) Positive (n = 105)
Age (yr) ± SD 36.4 ± 10.5 34.2 ± 9.2 38.0 ± 11.2 0.009
Gender (male/female) 125/56 50/26 75/30 0.418
Mean AST level (U/L) ± SD 59.7 ± 51.2 58.7 ± 42.5 60.5 ± 56.8 0.634 Mean ALT level (U/L) ± SD 116.3 ± 124.2 120.2 ± 100.8 113.5 ± 139.1 0.282
HBV genotype (B/C) 114/67 66/10 48/57 < 0.001
Precore: G1896/A1896 20/161 13/63 7/98 0.027
BCP:* mutant/wild 38/143 12/64 26/79 0.144
HBV DNA (log copies/mL) 8.4 ± 1.1 4.0 ± 0.7 4.3 ± 0.7 < 0.001
HBsAg level ((logIU/mL) 4.2 ± 0.7 8.1 ± 1.0 8.6 ± 1.1 0.003
Mean Knodell necroinflammation grade ± SD 5.0 ± 3.0 5.3 ± 2.8 4.7 ± 3.0 0.128 Mean Ishak fibrosis stage ± SD 1.8 ± 1.6 1.7 ± 1.2 1.9 ± 1.7 0.703
* Mutant, T1762 and A1764; wild, A1762 and T1764. χ2 test was used for variables of gender, HBV genotype, precore and basal core promoter mutations,
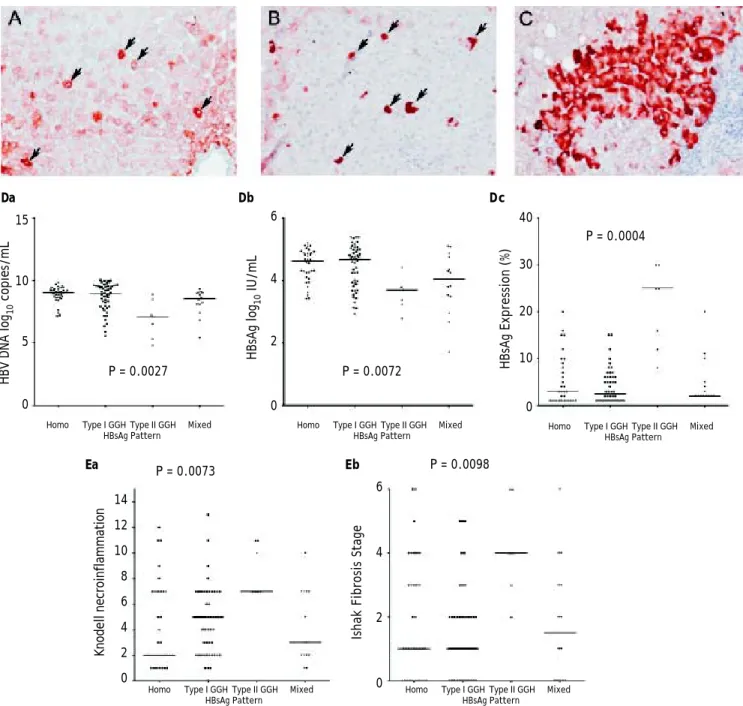
Distribution patterns of HBsAg expression
With respect to the 105 patients who exhibited HBsAg expression, homogenous pattern (Figure 1A) was detected in 34 (32.4%) patients, type I GGH
Figure 1. Staining patterns of HBsAg. A. Some moderate to strong homogeneously cytoplasm HBsAg stained hepatocytes (arrows) in a background of weakly stained hepatocytes. The nucleus of each homogeneously stained hepatocyte was located in the center of the cell. B. Type I ground glass hepatocyte (GGH) with dense globular or “inclusion-like” HBsAg staining (arrows) was scattered in the hepatic parenchyma. C. A cluster of type II GGHs showed HBsAg staining at the cell margin or periphery. Correlations of HBsAg expression patterns and serum HBV DNA level (Da), serum HBsAg level (Db), and intrahepatic HBsAg ex-pression level (Dc). The association of HBsAg expression patterns and Knodell necroinflammation grade (Ea) and Ishake fibrosis stage (Eb). Comparisons among groups were analyzed by Kruskal-Wallis ANOVA.
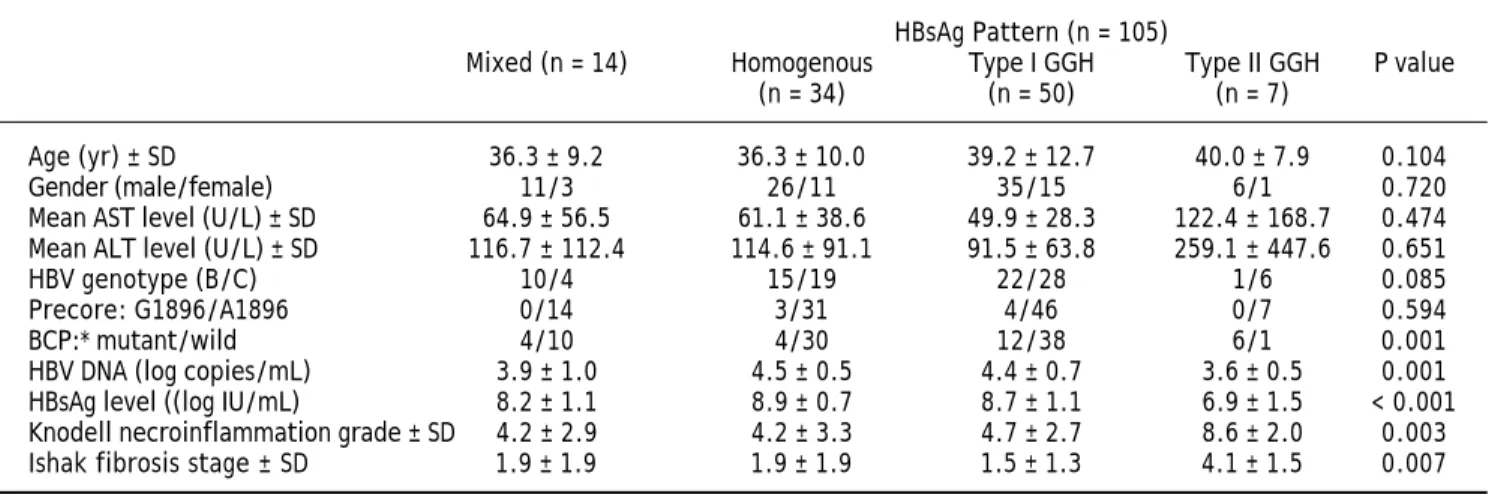
(Figure 1B) was detected in that of 50 (47.6%), type II GGH (Figure 1C) was detected in that of seven (6.7%), and a mixed pattern was detected in that of 14 (13.3%). As indicated in table 2, a higher preva-lence of BCP T1762/A1764 mutations was observed
Da Db Dc
Ea Eb
15
10
5
0
Homo Type I GGH Type II GGH Mixed HBsAg Pattern
6
4
2
0
Homo Type I GGH Type II GGH Mixed HBsAg Pattern
P = 0.0027 P = 0.0072
HBV DNA log
10
copies/mL
HBsAg log
10
IU/mL
40
30
20
10
0
Homo Type I GGH Type II GGH Mixed HBsAg Pattern
P = 0.0004
HBsAg Expression (%)
14
12
10
8
6
4
2
0
Homo Type I GGH Type II GGH Mixed HBsAg Pattern
P = 0.0073
Knodell necroinflammation
6
4
2
0 Homo Type I GGH Type II GGH Mixed HBsAg Pattern
P = 0.0098
in type II GGH (P =0.001) as compared with other patterns. There was a reciprocal relationship be-tween HBsAg expression and serum viral replication markers. In figure 1D shows that patients with type II GGH expression had lower HBV DNA levels and HBsAg titers, but higher intrahepatic HBsAg ex-pression levels (Figure 1D). Besides, liver histology displayed type II GGH exhibited significantly more severe liver necroinflammation and fibrosis activi-ties, and a higher level of intrahepatic HBsAg ex-pression (Figure 1E).
HBsAg expression level
Figure 2A to 2D shows the illustration of semi-quantitative measurement of HBsAg expression. There was no patient having scale 4+ of HBsAg ex-pression in this study. Reciprocal relationship be-tween viral replication and liver histology was observed. Patients with 2+/3+ scales of HBsAg ex-pression had lower levels of HBsAg titers and HBV DNA levels, but significantly severe necroinflamma-tion grade and fibrosis stage than patients with 1+ scale of HBsAg expression and negative HBsAg staining (Figure 2E). Those patients exhibited Kn-odell necroinflammation grade ≥ 5 score or Ishake fi-brosis stage ≥ 1 had significantly higher percentages of HBsAg expression (Figure 3).
Clinical features of HBsAg expression
Firstly, we examined the association of viral fac-tors and HBcAg/HBsAg expression. HBsAg expres-sion, not HBcAg expresexpres-sion, showed a significant
Table 2. Demographic characteristics by distribution patterns f HBsAg expression.
HBsAg Pattern (n = 105)
Mixed (n = 14) Homogenous Type I GGH Type II GGH P value (n = 34) (n = 50) (n = 7)
Age (yr) ± SD 36.3 ± 9.2 36.3 ± 10.0 39.2 ± 12.7 40.0 ± 7.9 0.104
Gender (male/female) 11/3 26/11 35/15 6/1 0.720
Mean AST level (U/L) ± SD 64.9 ± 56.5 61.1 ± 38.6 49.9 ± 28.3 122.4 ± 168.7 0.474 Mean ALT level (U/L) ± SD 116.7 ± 112.4 114.6 ± 91.1 91.5 ± 63.8 259.1 ± 447.6 0.651
HBV genotype (B/C) 10/4 15/19 22/28 1/6 0.085
Precore: G1896/A1896 0/14 3/31 4/46 0/7 0.594
BCP:* mutant/wild 4/10 4/30 12/38 6/1 0.001
HBV DNA (log copies/mL) 3.9 ± 1.0 4.5 ± 0.5 4.4 ± 0.7 3.6 ± 0.5 0.001 HBsAg level ((log IU/mL) 8.2 ± 1.1 8.9 ± 0.7 8.7 ± 1.1 6.9 ± 1.5 < 0.001 Knodell necroinflammation grade ± SD 4.2 ± 2.9 4.2 ± 3.3 4.7 ± 2.7 8.6 ± 2.0 0.003 Ishak fibrosis stage ± SD 1.9 ± 1.9 1.9 ± 1.9 1.5 ± 1.3 4.1 ± 1.5 0.007
* Mutant, T1762 and A1764; wild, A1762 and T1764. χ2 test was used for variables of gender, HBV genotype, precore and basal core promoter mutations,
while Mann-Whitney U test was used for other variables. AST: aspartate aminotransferase. ALT: alanine aminotransferase. BCP: basal core promoter. HBV: hepatitis B virus.
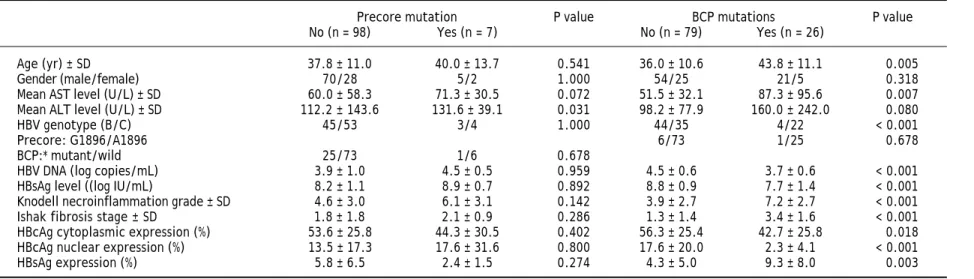
lower level in the presence of precore mutation (P = 0.001). Patients with genotype C exhibited greater liver fibrosis stage (P = 0.004). In patients with BCP T1762/A1764 mutations, there was a sig-nificantly greater necroinflammation grade and fi-brosis stage, and lower HBcAg expression either in cytoplasm or in nucleus. All these observations indi-cated an active liver injury. Additionally, patients with BCP T1762/A1764 mutations exhibited higher intrahepatic HBsAg expression (9.3 ± 8.0% vs. 4.3 ± 5.0%, P = 0.008) (Table 3). Furthermore, we ex-amined factors that may associate with levels of HB-sAg expression. In table 4, there were 16 patients exhibited 2+/3+ scales of HBsAg expression and 1+ scale in that of 89 patients. An univariate analysis showed 2+/3+ scales of HBsAg expression was as-sociated with BCP T1762/A1764 mutations, and more severe liver necroinflammation and fibrosis. A multivariate regression analysis revealed that the BCP T1762/A1764 mutations was the independent factor that was associated with 2+/3+ scales of int-rahepatic HBsAg expression.
DISCUSSIONS
Figure 2. HBsAg expression measured semi-quantitatively according to the proportion of immunolabelled cells, on a 0 to 3+ scale, corresponding to positivity in (A) 0% (0), (B) 1-10% (1+), (C) 11-25% (2+), and (D) 25-50% (3+) of examined hepatocytes. Correlations of HBsAg expression level and serum HBV DNA (Ea) and HB-sAg levels (Eb), and Knodell necroinflammation grade (Ec) and Ishak fibrosis stage (Ed). Comparisons among groups were analyzed by Kruskal-Wa-llis ANOVA.
Ea Eb
Ec Ed
A C
B D
15
10
5
0
Negative 1+ 2+/3+ HBsAg expression
P = 0.0009
HBV DNA log
10
copies/mL
6
4
2
0
Negative 1+ 2+/3+ HBsAg expression
HBsAg log
10
IU/mL
14
12
10
8
6
4
2
0
Negative 1+ 2+/3+ HBsAg expression
P = 0.0264
Knodell necroinflammation
6
4
2
0
Negative 1+ 2+/3+ HBsAg expression
Ishak Fibrosis Stage
P = 0.0077
777
Intrahepatic HBsAg expression in HBeAg-positive chronic hepatitis B.
, 2014; 13 (6): 771-780
Table 4. The association of demographic characteristics and degrees of HBsAg expression.
Univariate Multivariate
HBsAg expression, scale 1+ (n = 89) 2+/3+ (n = 16) P value Odds ratio (95% CI) P value
Age 38.2 ± 11.2 36.6 ± 11.1 0.608 0.963 (0.903~1.026) 0.242
Gender (male/female) 63/26 12/4 1.000
AST level (U/L) 55.0 ± 37.7 90.4 ± 113.2 0.234 1.026 (0.991~1.063) 0.142
ALT level (U/L) 103.3 ± 84.4 170.1 ± 297.2 0.386 0.991 (0.978~1.005) 0.216
HBV genotype (B/C) 42/47 6/10 0.589 0.994 (0.234~4.231) 0.994
Precore A1896 mutation (+/-) 7/82 0/16 0.592 0.000 (0.000~) 0.999
BCP:*mutant/wild 17/72 9/7 0.003 6.356 (1.204~33.356) 0.029
HBsAg level (log10 IU/mL) 4.3 ± 0.7 4.2 ± 0.8 0.180 2.096 (0.598~7.349) 0.247 Serum HBV DNA (log10 copies/mL) 8.6 ± 1.1 8.1 ± 1.4 0.135 0.731 (0.386~1.383) 0.335 Knodell necroinflammation grading 4.4 ± 2.9 6.3 ± 3.3 0.027
Ishak fibrosis stage 1.7 ± 1.6 2.9 ± 2.1 0.041
HBcAg cytoplasmic expression (%) 53.1 ± 25.8 52.3 ± 28.5 0.915 HBcAg nuclear expression (%) 14.4 ± 18.3 10.1 ± 19.3 0.389
* Mutant, T1762 and A1764; wild, A1762 and T1764. Univariate analysis: χ2 test was used for variables of gender, HBV genotype, precore and basal core promoter mutations, while Mann-Whitney U test was used for other variables. Multivaiate analysis: Logistic regression analysis expressed as Odds ratio with 95% confidence interval and P values. AST: aspartate aminotransferase. ALT: alanine aminotransferase. BCP: basal core promoter. HBV: hepatitis B virus.
No (n = 98) Yes (n = 7) No (n = 79) Yes (n = 26)
Age (yr) ± SD 37.8 ± 11.0 40.0 ± 13.7 0.541 36.0 ± 10.6 43.8 ± 11.1 0.005
Gender (male/female) 70/28 5/2 1.000 54/25 21/5 0.318
Mean AST level (U/L) ± SD 60.0 ± 58.3 71.3 ± 30.5 0.072 51.5 ± 32.1 87.3 ± 95.6 0.007 Mean ALT level (U/L) ± SD 112.2 ± 143.6 131.6 ± 39.1 0.031 98.2 ± 77.9 160.0 ± 242.0 0.080
HBV genotype (B/C) 45/53 3/4 1.000 44/35 4/22 < 0.001
Precore: G1896/A1896 6/73 1/25 0.678
BCP:* mutant/wild 25/73 1/6 0.678
HBV DNA (log copies/mL) 3.9 ± 1.0 4.5 ± 0.5 0.959 4.5 ± 0.6 3.7 ± 0.6 < 0.001 HBsAg level ((log IU/mL) 8.2 ± 1.1 8.9 ± 0.7 0.892 8.8 ± 0.9 7.7 ± 1.4 < 0.001 Knodell necroinflammation grade ± SD 4.6 ± 3.0 6.1 ± 3.1 0.142 3.9 ± 2.7 7.2 ± 2.7 < 0.001 Ishak fibrosis stage ± SD 1.8 ± 1.8 2.1 ± 0.9 0.286 1.3 ± 1.4 3.4 ± 1.6 < 0.001 HBcAg cytoplasmic expression (%) 53.6 ± 25.8 44.3 ± 30.5 0.402 56.3 ± 25.4 42.7 ± 25.8 0.018 HBcAg nuclear expression (%) 13.5 ± 17.3 17.6 ± 31.6 0.800 17.6 ± 20.0 2.3 ± 4.1 < 0.001
HBsAg expression (%) 5.8 ± 6.5 2.4 ± 1.5 0.274 4.3 ± 5.0 9.3 ± 8.0 0.003
Figure 3. Correlation of the expression of intrahepatic HBsAg with Knodell necroinflammation grade (A) and Ishak fibrosis stage (B). Comparisons between groups were analyzed by Mann-Whitney U test.
and relatively higher levels of intrahepatic HBsAg expression. This reciprocal relationship between liver histology and HBV replication indicated that the occurrence of type II GGH might be a marker of advanced liver disease during disease evolution in HBeAg positive chronic hepatitis B. Patterns of HB-sAg expression have been reported to be related with distinct viral mutations that have impacts on regu-lation of HBV replication and defect of surface anti-gen secretion from hepatocytes.9,24 Type II GGH consistently harbored Pre-S2 deletion mutations that decreased synthesis of middle surface proteins and then resulted in accumulation of large surface proteins in hepatocytes and defect of HBsAg secre-tion.25 In this study we performed correlation of se-rum HBsAg and HBV DNA between patients with or without type II GGH. Moderate correlation between the two HBV replication indicators exhibited in pa-tient without type II GGH (r = 0.686, P < 0.001), but no correlation in patients with type II GGH (P = 0.513). The result indirectly implicated that type II GGH may have defective HBsAg secretion from hepatocytes. In addition, pre-S deletion have been reported to associate with advanced liver disease. Pre-S deletion is one of the viral factors that related to development of liver cirrhosis.26,27 Pre-S deletion could lead to ER stress and activate stress-related signal transduction. Oxidative damage of hepatocyte DNA and then stimulated DNA repair mechanisms might result in genomic instability that worsens the liver damage and is predisposed to carcinogenesis.28
In addition to patterns of HBsAg expression, we found that higher expression levels accompanied with more severe of liver histological activities and
higher rate of BCP T1762/A1764 mutations. BCP T1762/A1764 mutations are strongly associated with severe liver histological activities and liver can-cer.29,30 To our knowledge, there is a strong linkage between genotype C and the presence of BCP T1762/ A1764 mutations.30 In this study, genotype C seemed to play no role in HBsAg expression level. In contrast, BCP T1762/A1764 mutations showed strongly related with the HBsAg expression. With regard to viral mutation, BCP T1762/A1764 muta-tions may provide bases for other HBV mutamuta-tions including pre-S deletion and complex mutants fre-quently encountered in the presence of BCP T1762/ A1764 mutations. Complex HBV mutants showed partial or complete defects in e, core, and surface protein expression and secretion.31 The reduced hepa-titis B surface antigen secretion correlated with aber-rant localization of surface proteins in ER and resulted in high expression of HBsAg. In addition, BCP T1762/A1764 mutation is considered to be a con-sequence of viral fitness because of selection pressure of the immune surveillance of the host. Similarly, pre-S2 mutations, harbor in type II GGH, coincide with the human leukocyte antigen-restricted T and B-cell epitopes.32 There is usually no cell necrosis or T lymphocyte infiltration around the type II GGHs, suggesting that HBV with the emergence of the pre-S2 deletion mutation is also a possibly novel escape mutants.33 However, the accumulation of surface antigen in hepatocytes could happen without carrying any of the known viral mutations in pre-S or S genomes or in surface promoters.31,34 Therefore, HBsAg expression could be a sequence in association with or without viral mutations.
A 35 B
30
25
20
15
10
5
0
0-5 ≥ 6
Knodell necroinflammation grade P = 0.0171
HBsAg expression (%)
35
30
25
20
15
10
5
0
0-1 2-6
Ishake fibrosis stage P = 0.0205
This study had several potential limitations. The observations in this study were based on a retro-spective cross-sectional design, but no longitudinal follow-up was conducted. The expression level of HBsAg in hepatocytes and histological severity may vary among various parts of the liver in a single pa-tient; liver biopsy per se cannot exactly represent any liver tissue except for the biopsy core.
In summary, patients exhibited type II GGH pattern or higher levels of intrahepatic HBsAg ex-pression exhibited the reciprocal relationship be-tween more severe liver histology activities and lower HBV replication capacity. The strong associa-tion between intrahepatic HBsAg expression and BCP T1762/A1764 mutations indicated that HBsAg expression possibly could be regarded as the histo-logical manifestation during HBV genomic evolution under host immune pressure.
ABBREVIATIONS
• BCP: basal core promoter. • GGH: ground glass hepatocyte. • HBcAg: hepatitis B core antigen. • HBeAg: hepatitis B e antigen. • HBsAg: hepatitis B surface antigen. • HBV: hepatitis B virus.
CONFLICTS OF INTEREST
T.-T. C. has received research funding from Gile-ad Sciences, Bristol-Myers Squibb Company, Glaxo-SmithKline, Merck Sharp & Dohme (I.A.) Corporation and Pfizer Inc. There is no conflict of interest for the remaining authors.
SOURCE OF FUNDING
P.-N. C. received grants from National Science Council of Taiwan (Grant number: NSC 100-2314-B-006-063) and National Cheng Kung University Hos-pital (Grand number: NCKUH- 10203036).
REFERENCES
1. Chan HL, Sung JJ. Hepatocellular carcinoma and hepatitis B virus. Semin Liver Dis 2006; 26: 153-61.
2. Kao JH, Chen DS. Global control of hepatitis B virus infec-tion. Lancet Infect Dis 2002; 2: 395-403.
3. Dienstag JL. Hepatitis B virus infection. N Engl J Med 2008; 359: 1486-500.
4. Chisari FV, Ferrari C. Hepatitis B virus immunopathogene-sis. Annu Rev Immunol 1995; 13: 29-60.
5. Chu CM, Yeh JT, Sheen IS, Liaw YF. Subcellular localization of hepatitis B core antigen in relation to hepatocyte
re-generation in chronic hepatitis B. Gastroenterology 1995; 109: 1926-32.
6. Chu CM, Yeh CT, Chien RN, Sheen IS, Liaw YF. The degrees of hepatocyte nuclear but not cytoplasmic expression of hepatitis B core antigen reflects the level of viral replica-tion in chronic hepatitis B virus infecreplica-tion. J Clin Microbiol 1997; 35: 102-5.
7. Hsu HC, Lai MY, Su IJ, Chen DS, Chang MH, Yang PM, Wu CY, et al. Correlation of hepatocyte HBsAg expression with virus replication and liver pathology. Hepatology 1988; 8: 749-54.
8. Su IJ, Wang HC, Wu HC, Huang WY. Ground glass hepato-cytes contain pre-S mutants and represent preneoplastic lesions in chronic hepatitis B virus infection. J
Gastroen-terol Hepatol 2008; 23: 1169-74.
9. Fan YF, Lu CC, Chang YC, Chang TT, Lin PW, Lei HY, Su IJ. Identification of a pre-S2 mutant in hepatocytes expres-sing a novel marginal pattern of surface antigen in advan-ced diseases of chronic hepatitis B virus infection. J
Gastroenterol Hepatol 2000; 15: 519-28.
10. Fan YF, Lu CC, Chen WC, Yao WJ, Wang HC, Chang TT, Lei HY, et al. Prevalence and significance of hepatitis B virus (HBV) pre-S mutants in serum and liver at different repli-cative stages of chronic HBV infection. Hepatology 2001; 33: 277-86.
11. Hadziyannis SJ, Vassilopoulos D. Hepatitis B e antigen-ne-gative chronic hepatitis B. Hepatology 2001; 34: 617-24. 12. Brunetto MR, Giarin MM, Oliveri F, Chiaberge E, Baldi M,
Alfarano A, Serra A, et al. Wild-type and e antigenminus hepatitis B viruses and course of chronic hepatitis. Proc
Nat Acad Sci USA 1991; 88: 4186-90.
13. Grandjacques C, Pradat P, Stuyver L, Chevallier M, Chevallier P, Pichoud C, Maisonnas M, et al. Rapid detec-tion of genotypes and mutadetec-tions in the pre-core promoter and the pre-core region of hepatitis B virus genome: co-rrelation with viral persistence and disease severity. J
Hepatol 2000; 33: 430-9.
14. Lok AS, McMahon BJ. Chronic Hepatitis B: Update 2009.
Hepatology 2009; 50: 1-36.
15. Chang TT, Gish RG, de Man R, Gadano A, Sollano J, Chao YC, Lok AS, et al. A comparison of entecavir and lamivudi-ne for HBeAg-positive chronic hepatitis B. N Engl J Med 2006; 354: 1001-10.
16. Marcellin P, Heathcote EJ, Buti M, Gane E, de Man RA, Krastev Z, Germanidis G, et al. Tenofovir disoproxil fuma-rate versus adefovir dipivoxil for chronic hepatitis B. N
Engl J Med 2008; 359: 2442-55.
17. Kao JH, Chen PJ, Lai MY, Chen DS. Basal core promoter mutations of hepatitis B virus and increase the risk of he-patocellular carcinoma in hepatitis B carriers.
Gastroen-terology 2003; 124: 327-34.
18. Lin CL, Liao LY, Wang CS, Chen PJ, Lai MY, Chen DS, Kao JH. Basal core promoter mutant of hepatitis B virus and progression of liver disease in hepatitis B e antigen-nega-tive chronic hepatitis B. Liver Int 2005; 25: 564-70. 19. Liu WC, Lindh M, Buti M, Phiet PH, Mizokami M, Li HH, Sun
KT, et al. Genotyping of hepatitis B virus-genotypes a to g by multiplex polymerase chain reaction. Intervirology 2008; 51: 247-52.
20. Knodell RG, Ishak KG, Black WC, Chen TS, Craig R, Kaplo-witz N, Kiernan TW, et al. Formulation and application of a numerical scoring system for assessing histological activi-ty in asymptomatic chronic active hepatitis. Hepatology 1981; 1: 431-5.
21. Ishak KG. Chronic hepatitis: morphology and nomenclature.
22. Tsai HW, Lin YJ, Lin PW, Wu HC, Hsu KH, Yen CJ, Chan SH, et al. A Clustered Ground-Glass Hepatocyte Pattern Repre-sents a New Prognostic Marker for the Recurrence of He-patocellular Carcinoma After Surgery. Cancer 2011; 1: 2951-60.
23. Gudat F, Bianchi L, Sonnabend W, Thiel G, Aenishaenslin W, Stalder GA. Pattern of core and surface expression in liver tissue reflects state of specific immune response in hepatitis B. Lab Invest 1975; 32: 1-9.
24. Huang TJ, Lu CC, Tsai JC, Yao WJ, Lu X, Lai MD, Liu HS, et al. Novel autoregulatory function of hepatitis B virus M protein on surface gene expression. J Biol Chem 2005; 280: 27742-54.
25. Wang HC, Wu HC, Chen CF, Fausto N, Lei HY, Su IJ. Diffe-rent types of ground glass hepatocytes in chronic hepati-tis B virus infection contain specific pre-S mutants that may induce endoplasmic reticulum stress. Am J Pathol 2003; 163: 2441-9.
26. Chen CH, Hung CH, Lee CM, Hu TH, Wang JH, Wang JC, Lu SN, et al. Pre-S deletion and complex mutations of hepati-tis B virus related to advanced liver disease in HBeAg-ne-gative patients. Gastroenterology 2007; 133: 1466-74. 27. Preikschat P, Gunther S, Reinhold S, Will H, Budde K,
Meu-mayer HH, Krüger GH, et al. Complex HBV populations with mutations in core promoter, C gene, and pre-S region are associated with development of cirrhosis in long-term re-nal transplant recipients. Hepatology 2002; 35: 466-77. 28. Hsieh YH, Su IJ, Wang HC, Chang WW, Lei HY, Lai MD,
Chang WT, et al. Pre-S mutant surface antigens in chronic
hepatitis B virus infection induce oxidative stress and DNA damage. Carcinogenesis 2004; 25: 2023-32.
29. Kao JH, Chen PJ, Lai MY, Chen DS. Basal core promoter mutations of hepatitis B virus increase the risk of hepato-cellular carcinoma in hepatitis B carriers.
Gastroenterolo-gy 2003; 124: 327-34.
30. Chen CH, Lee CM, Lu SN, Changchien CS, Eng HL, Huang CM, Wang JH, et al. Clinical significance of hepatitis B virus (HBV) genotypes and precore and core promoter mutations affecting HBV e antigen expression in Taiwan.
J Clin Microbiol 2005; 43: 6000-6.
31. Marschenz S, Endres AS, Brinckmann A, Heise T, Kristian-sen K, Nürnberg P, Krüger DH, et al. Function analysis of complex hepatitis B virus variants associated with develo-pment of liver cirrhosis. Gastroenterology 2006; 131: 765-80.
32. Sobotta D, Sominskaya I, Jansons J, Meisel H, Schmitt S, Heermann KH, Kaluza G, et al. Mapping ofimmunodominant B-cell epitopes and the human serum albumin-binding site in natural hepatitis B virus surface antigen of defined ge-nosubtype. J Gen Virol 2000; 81: 369-78.
33. Tai PC, Banik D, Lin GI, Pai S, Pai K, Lin MH, Yuoh G, et al. Novel and frequent mutations of hepatitis B virus coincide with a major histocompatibility complex class I-restricted T-cell epitope of the surface antigen. J Virol 1997; 71: 4852-6.