INNOVATIVE ENTERPRISES: A DYNAMICAL MODEL
Edgar Willis and A. Plastino
National University La Plata & National Research Council (CONICET) C. C. 727, 1900 La Plata, Argentina
ABSTRACT
We develop a dynamical model for the social impact of a University driven program for incubating innovative enterprises.
I. Introduction
Multidisciplinary prospective studies of the social impact of different programs constitute an active area of work. Government interest in them has been growing steadily within the OECD on account of the need for [1]:
1. Improving the effect of government expenditures in Education, Science and technology on the basis of well-established priorities.
2. Effective coordination of private and Government initiatives.
3. Creation of cooperation-exchange networks that link academic institutions with the productive sector.
4. Establishment of a creative equilibrium between technology push y market pull” [2]. Prospective studies allow for the identifying of opportunities and future needs. They do nor define policies per se, but contribute with ideas and concepts that make more effective the policies adopted at the political level [3].
Both the European Union (EU) [4] and some Asiatic countries (Korea) [5] envision promoting the generation of new enterprises that make innovation their leitmotif. Their policies prioritize an effective articulation of the tripod Education-Science –Technology (EST) with the productive sector (small business in particular) to help it to become more competitive.
Emerging countries, in order to adapt to a knowledge-based economy, must consider the following questions:
How can one interpret the innovation process from a systemic viewpoint?
What strategies and policies might help to attenuate the difficulties that currently afflict third world countries?
What are the key factors that promote development?
In order to help formulating a tentative answer we advance below a quantitative dynamical model of the innovative process.
II. Modeling a University-induced process of growth through innovation
The model relates the main variables affecting the innovative process. The input is people’s "education-training” level.
Fig.1
The model is motivated by the work of Bolton [6], that developed a conceptual (not quantitative) model of the innovative process on the basis of experience gained at Cambridge University. Fig. 1 illustrates the flux diagram that characterizes the model. The flux fixes the dynamical relationships among variables and allows for numerical simulations. Two types of arrow can be visualized (simple and "crossed”). Each crossed arrow denotes a transition characterized by time- delays.
The process begins (bottom) with researchers and special kinds of technology-transfer "teachers”, to be called formative teachers, that will become active agents of change. Additionally, a University-like organization gathers people interesting in starting their own innovative enterprise (potential-entrepreneurs). This kicks up the innovative flux. Formative teachers, entrepreneurs, business people, jobs and consumers accumulate and their numbers grow.
The model associates "SPENDING” to the value (price) of goods and services generated by the new innovative enterprises. Such a variable becomes an essential ingredient of the equations that determine the gross national product (GNP).
The model includes a positive feed-back loop that represents the synergic effect induced by a cooperative-competitive ("coopetition”) attitude that naturally emerges in
Diffusion
Business
R&D - Social sciences
+
Opportunities
R&D
Exact sciences Teachers
Formative teachers course
Formative teachers
Start-ups business
Entrepreneurs
Entreprenurs training course
Potential entrepreneurs
Park
Incubator
Support Consumer
[image:2.612.105.560.78.485.2]the environment we are contemplating here [6]. Indeed, our main motivation is that of emphasizing the importance of forging such a coopetition climate.
Several underlying constraint tend to impede the emergence of the coopetition climate: political, cultural, economic and ecologic factors. These are modeled here via two parameters: efficiency (Kef) and "cooperative factor” (Fac Coop) that strongly affect the final results of the process. Research and development activities have great impact on business and innovative enterprises, which is duly reflected by the diagram.
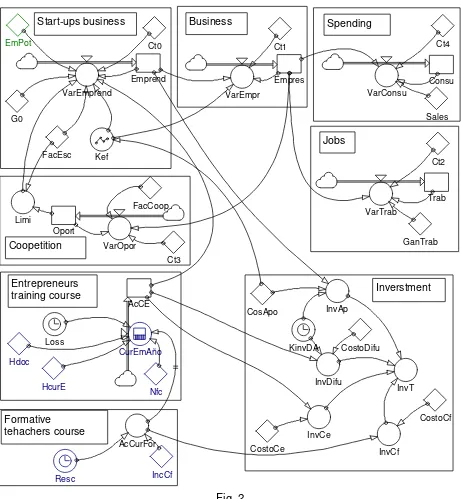
More insight is gained by a perusal of Fig. 2. We have here an "accumulation & flux diagram”. The equations of the model are to be found here. One appreciates the fact that eight modules characterize the model. Details of each module are given below.
We wish to emphasize here the importance of three key ingredients that are able to sustain a growth process. These are
a) The amount of technological-teaching-training (TTT) activity undertaken by Universities and other Institutions that prepare-form high quality human resources, quantified by the variable "Resc”,
b) The efficiency level achieved at the stage of creation of new innovative enterprises, quantified as "Kef”.
c) The level of "cooperation-competition” among these enterprises that can be reached in a reasonable amount of time, quantified as "FacCoop”.
In order to drive the system towards some desired direction one should operate upon these three key factors.
We will report on data gathered by a Program of the National University La Plata: its Science Park for incubating new innovative enterprises. These date enter our equations that are subsequently solved using an appropriate simulation program called "POWERSIM 2.5" [7].
II.1Module "generation of formative teachers”
Emerging countries lack human resources of all kinds associated to a Market economy. What we call formative teachers in this work (see above) constitutes an essential ingredient of a "knowledge-driven” economy, an ineludible first step indeed.
A sensible policy emphasizes trying to accumulate at strategic locations sizable numbers of formative teachers. Obtaining them through intensive training should be a University priority. We model the concomitant process here by recourse to an input function of the step-kind that we call "Resc”. Both its amplitude and time-size (duration) are variable. Resc measures the number of associated Training Courses per year and how are they distributed in time. Two distinct scenarios are considered in this respect: just a single, 60 hours course per year, during the first year, leading to a certification as Formative Teacher (FT). A second scenario considers three such courses per year during four consecutive years. The Courses cost about 5000 U$S, last 10 months (3 hours per week) and admit up to 20 participants each
Fig. 2
II.2 Module "generation of entrepreneurs”
The lack of entrepreneurs is a distinctive characteristic of emerging countries, where the business culture revolves around hand-outs from the State and outright corruption.
Since the prevailing business climate precludes the spontaneous emergence of entrepreneurs, they should be generated via alternative procedures. University training is one of them.
Entrepreneurs training course
Start-ups business Business
Inverstment Jobs
Coopetition
Spending
Formative
tehachers course InvCe
VarOpor
KinvDA Limi
InvCf InvDifu
InvAp
CostoDifu FacCoop
CurEmAño
Oport FacEsc Kef
Hdoc
Resc IncCf
CostoCe AcCE
Nfc HcurE
Ct2
VarTrab
GanTrab Ct1
VarEmpr
Empres Emprend
VarEmprend
G0
Consu
Trab VarConsu
CosApo
Ct4
InvT Ct3
CostoCf Loss
AcCurFor
Sales Ct0
At La Plata University, entrepreneurs’ formation is tackled by recourse to 60 hours courses involving 20 students, hopefully future entrepreneurs. The cost of these courses is of about 5000 U$S. The relevant variable here is called AcCE. Its dynamics is governed by the equation
dAcCE/dt = (DELAY(AcCurFor,0.5, 0))*Nfc*Hdoc*0.5/(HcurE)-Loss, (1) where:
DELAY is a "delay” function,
AcCE is the number of entrepreneurship courses, AcCurFor, measures the growth of FT courses, Nfc is the number of FT students per course (20)
Hdoc is the number of hours per year that qualified personnel devote to FT courses (3 x 4 x 10),
HcurE same for of entrepreneurship courses (ET) (60),
Loss is a linear function that measures how the number of ET courses decreases per year (a 2,5 % per year).
II.3 Module "Innovative trial projects generated by our program”
The associated variable is called Emprend. Its dynamics is given by
dEmprend/dt = ((AcCE*EmPot*Kef/G0+FacEsc*Limi)-Emprend)/Ct0, (2)
Here we deal with i) the number of potential entrepreneurs (EmPot), ii) the investment that supports the enterprise, quantified by the variable InvApo, iii) the time constant Ct0 (=0.3 years), and iv) the ratio number of enterprises/number of entrepreneurs, denoted by G0 (= 1/3).
As for the investment referred to in the preceding paragraph, in an initial stage two types of them are foreseen:
1. Seedinvestment in the form of R&D to the tune of U$D 10.000 per enterprise.
[image:5.612.199.395.511.643.2]2. Logistic support (infrastructure, legal advice, etc.), of about U$D 5.000 per enterprise.
Fig. 3: Non-linear Kef characteristic
We make here use of three new variables: i) the number of pre-existing enterprises (Empres), ii) the number of trial innovative projects incubated by the University (Emprend), and iii) the efficiency with which the latter successfully mature
Kef characteristic
0 0,2 0,4 0,6 0,8 1
0 10 20 30
InvApo
into full fledged new enterprises (Kef). The relation between Emprend and Empres is controlled in non-linear fashion by the parameter Kef to which we assign the values Kef = 0,3 and 0,6 for InvApo = U$S 10000 and 15000, respectively (see Eq. (3) below). Fig. 3 depicts “Kef” versus "InvApo”. The shape of the curve responds to empirical data gathered by European Universities that have supported this kind of activities over several years [8].
II.4 Module Enterprises and Jobs
Let Trab stand for the number of jobs generated by new enterprises. Successful trial projects eventually mature and conform new enterprises, which in turn generates new jobs. This wonderful process is modelled according to
dEmpres/dt = (Kef*Emprend-Empres)/Ct1, (3)
dTrab/dt = (Empres*GanTrab-Trab)/Ct2, (4)
where two new time constants Ct1=0.4 and Ct2= 1 make their appearance. We assume GanTrab = 10. New enterprises assumedly start with three entrepreneurs that conceive and kick it off, generating 7 new jobs per year (during the first three years).
II.5 Module Spending
Spending is quantified by the variable Consu, that evolves according to
DConsu/dt = (Empres*Sales-Consu)/Ct4, (5)
The parameter Sales represents the total value of products and services sold during a three-year period by a given enterprise. This value is estimated as being of the order of one million U$S. The time constant Ct4 is given the value unity.
II.6 Module Coopetition
Coopetition is a suggestive post-industrial concept that is here represented by the variable FacCoop. Let Oport quantify the economic climate. Oport is an index that indicates to what an extent the cooperative-competitive environment facilitates a climate conductive to the creation of new enterprises because of the emergence of opportunities for doing business. The index evolves according to
dOport/dt = (FacCoop*Empres-Oport)/Ct3, (6)
where the time constant Ct3 equals 2, while FacCoop varies in the interval [0, 3]. The ratio between Oport and FacCoop is an important ingredient of our model. The non-linear function of this ratio.
Limi = TANH(Oport/FacEsc), (7)
II.7 Module investment
Here we deal with different types of investment, namely,
InvCf = AcCurFor*CostoCf, (8) InvDif = AcCE*CostoDifu, (9) InvCe = AcCE*CostoCe, (10) InvAp = Emprend*CosApo. (11)
In the above equations we find several variables that describe investments required for: 1) FT (InvCf),
2) Cost of each individual FT course (CostoCf), 3) FT-PR (InvDif),
4) PR cost of entrepreneurs courses (CostoDif), 5) Investment in the above courses (InvCe), 6) Trial project’s subsidies (InvAp),
7) Cost of each individual Project’s support (CostoApo).
We start with CostApo = 10,000 U$S. Total investment (InvT) obeys the relation
InvT = InvDifu+InvAp+InvCe+InvCf. (12)
III. Results and discussion
We will consider two possible scenarios. In the first one the newly incubated enterprises cluster around a University. Their social impact is thereby a local one.
In a second, more ambitious scenario, we think of a network of incubating Universities. The ensuing fluxes within the net configure synergic effects conductive to a propitious business environment.
III.1 Scenario I
Fig. 4 depicts the time evolution of i) the number of enterprises, ii) the number of associated jobs, and iii) the concomitant amounts invested. We adopt for the parameters of the system the values
InvApo = 10.000, AcCurFor = 1, FacCoop = 0
The above InvApo value assumes that the only investment is for seed-capital, which results in rather low efficiency (Kef = 0,3). FacCoop = 0 entails that the new enterprises that emerge in our process do not in turn generate new investment projects.
Fig. 4
Fig. 5
( a ) Time
nvT
0 2 4 6 8 10
0 3 6
1 2 3 4 1 2 34 1
23 4 12 3 4 1 2 3 4 1 3 4 Total investment
Million U$S 8,41
Time
Empres
0 2 4 6 8 10
0 50 100 150 200
1 2 3 4 1 2 3 4 12
34 12 3 4 1 2 3 4 1 2 3 4 207,62 Business (b) Time Tra b
0 2 4 6 8 10
0 300 600
( a )
Jobs
830,81 Time
Inv
T
0 2 4 6 8 10
0 1 2 3 4 Total investment Million U$S
( c )
4,24
Time
Empres
0 2 4 6 8 10
0 20 40 60 80 92,59 Business (b) 83,08 Time Consu
0 2 4 6 8 10
0 30 60
MillionsU$S
( d )
Investment, new enterprises and new jobs behave in similar manner: a slow rate of growth at the beginning, followed by a more rapid, exponential growth. Fig. 5 allows one to appreciate the sensibility of these important variables to the value of FacCoop.
Fig. 6 depicts the process’ evolution when the investment grows (InvApo=15000 U$S). As a result, efficiency also augments (Kef=0.6). We have assumed here that FacCoop equals 1, 2, and 3, respectively.
[image:9.612.113.515.177.382.2]
Figura 6
Figs. 5 and 6 illustrate different behaviours. The difference is attributable to the distinct values of the parameter Kef for these two figures (remember the Kef-evolution depicted in Fig. 3).
The evolution of the variables of Figs. 5-6 is further analysed in Table I (after 10 years).
Table I
InnvApo
(Thousand)
FacCoop InvTot
(Millions)
Business
10 0 4.23 92
10 3 8.41 207
15 0 10.65 370
15 3 70.44 2470
( a ) Time
Inv
T
0 2 4 6 8 10
0 20 40 60
1 2 3 4 1 23 4 1 2 341 2
3 4
12 3 4
1 3 4 Total investment
Million U$S 70,44
Time
Empre
s
0 2 4 6 8 10
0 500 1.000 1.500 2.000 2.500
1 2 3 4 1 2 34 1 2 34123
4 12 3 4
1 3 4
2.468,94
Business
Scenario II
Here we assume a drastic growth in the number of formative courses Resc (its rate of temporal change AcCurFor is not a smooth function but a step one: its amplitude is of three new 4-years courses added per year). We are thinking here that several Universities are simultaneously engaged in the process.
[image:10.612.222.411.452.582.2]The concomitant process is illustrated in Fig. 7 for InvApo = 15000 and FacCoop = 0, 1, 2, and 3, respectively.
Fig. 7
After 10 years we reach investment values and a number of new enterprises that are listed in Table II.
Table II
FacCoop InvTot
(Millions)
Business
0 121 4150
2 315 11030
3 595 20566
Results obtained after 5, 10, and 15 years are listed in Tables III. The impact of these results can be better appreciated by reference to the GNP of Argentina (around 300 billion U$S). It is seen that a not negligible percentage of the GNP is the result of the process leitmotif of the present work. Regretfully enough, the time scales involved exceed the usual incumbency lengths of elected officials.
( a ) Time
nvT
0 2 4 6 8 10
0 100 200 300 400 500 600
1 2 3 4 1 2 3 4 12 3 4
1 2 3 4
12 3 4
1 3 4 Total investments
Millions U$S 595,64
Time
Empres
0 2 4 6 8 10
0 5.000 10.000 15.000 20.000
1 2 3 4 1 2 34 1 2 34
12 3 4
12 3 4
1 3 4
20.566,18
Business
Table III
InvApo = 15000
Year InvTot
(Millions)
Business Jobs Consumer
(Millions)
% GNP
1 1,15 12,7 16 1,62
5 77 2360 13892 1398 0.46
10 595 20566 151432 15143 5
15 2367 86225 691540 69154 23
CONCLUSIONS
The Market by itself is not able to make emerging countries able to adopt to the strictures of a knowledge-driven economy. Creation of innovative enterprises that both compete and cooperate (coopetition) is beyond the possibilities of Third World politicians, immersed ignorance and graft. The Universities are the only Institutions that MIGHT help these countries to improve the social environment in order to foster the innovative process. Incubation of competitive enterprises is an avenue that should be urgently explored.
We have here tried to assess the social impact of such an incubation process by recourse to a mathematical model, motivated by the resonant success of the Cambridge program. This constitutes a systemic approach that mimics the workings of a network economy. Our goal was that of
• Identify the significant variables of the innovative process.
• Apprehend the complex relationships among these variables
• Formulate plausible scenarios in which appropriate development strategies might succeed.
• Identify policies that promote the appearance of entrepreneurs, enterprises jobs, and spending growth.
• Estimate the amount of investment required to such effects.
The model shows that policies that prioritise learning-formation are indeed able to foster creation of innovative enterprises, whose impact on the GNP is by no means negligible.
REFERENCES
1. Jouvenel Hugues “Un bref guide méthodologique”. Futuribles analyse et prospective, N°247 noviembre 1999
2. Julio C Neffa. Las Innovaciones Científicas y Tecnológicas . Una Introducción a su Economía Política. Editorial LUMEN HVMANITAS. Agosto de 2000
4. The first Actión Plan for Innovatión in Europe - Innovatión Policy. The European Commossion Innovation Programme.www.condis.lu/innovation/src/action.htm
5. Woo Taehee. Korean Goverment Policy to Promote Innovation. OCDE Global Forum on the Knowledge Economy. Buenos Aires 8-9 March 2001. http//:www.sepyme.gov.ar/gobernamental
6. William Bolton “The University Handbook on Enterprise Development”. Columbus, 1,
rue Miollins 75732 Paris Cedex, 15. (1997)
7. Jennifer M. Cover. Introduction to Systen Dynamics. Powersim Press. 1996