Integrating Software Metrics for Fortran Legacy
into an IDE
Mariano M´endez and Fernando G. Tinetti⋆
III-LIDI, Fac. de Inform´atica Universidad Nacional de La Plata
50 y 120, La Plata Argentina
Abstract. Software Metrics have being used since the 70s, their pur-pose is to measure different software attributes, such as complexity and maintainability, to name a few. Software Metrics help programmers ob-tain valuable information about programs. That information is essential when working with legacy systems. Scientists have been producing For-tran programs for the last six decades, and some of those programs be-came legacy years ago. We have implemented a set of well known software metrics for Fortran into a widely used IDE (Integrated Development En-vironment) by means of AST (Abstract Syntax Tree). This integration allows developers to obtain software metrics from their source code while they are programming.
Key words: Fortran Legacy Systems, Software Metrics, Integrated Develop-ment EnvironDevelop-ments
1
Introduction
Software attributes measurement and software process improvement has been a research topic for many years. The idea of improving software processes that can be tracked down [34,23] while measuring software attributes has been deeply treated since the 70s [22,17,24]. In this paper, we will focus in software metrics: “A function whose inputs are software data and whose output is a single numer-ical value that can be interpreted as the degree to which software possesses a given attribute that affects its quality” [18]. Most of the relevant studies focus-ing on software metrics initially concentrated on Fortran Programmfocus-ing Language [6,22,24], among others. Fortran is one of the most long lived programming lan-guages [2] which has been widely used by scientists to produce large amounts of source code ever since it came into existence, it has become as the “de facto” scientific programming language [26,3,21,28,29]. Throughout its long lived ex-istence it has experimented a particular evolutionary process since it was the first programming language to be standardized [2]. Fortran has passed through
10 different versions:fortran i, fortran ii, fortran iii, fortran iv, for-tran 66, forfor-tran 77, Forfor-tran 90, Forfor-tran 95, Forfor-tran 2003, and Forfor-tran 2008. Six of those versions resulted in standards [19,13,20]. The Fortran standard has passed through several revision processes during the last decades (1966, 1978, 1991, 1997, 2004, 2010). As a matter of fact, Fortran is considered to have passed through a “seven ages” evolutionary process [27].
Fortran evolution has also been described as pragmatical, given the fact that updated versions of Fortran are fully backward compatible with older versions of the language. Updated versions have kept full compatibility even with obsoles-cent features already deleted from the language standard, with minor exceptions: “Unlike Fortran 90, Fortran 95 was not a superset; it deleted a small number of so-called obsolescent features. This incompatibility is more theoretical than real however, as all existing Fortran 95 compilers include the deleted features as extensions” [7]. Annex B of the Fortran 2008 Standard (ISO/IEC 2008) enumer-ates the obsolescent features of the language that have not been deleted, some of which may be found in thefortran66 andfortran77 specification. Fortran 2008 was released in 2010, and it is the current revision of the Fortran standard. Taking into account the Fortran evolution described above, it seems to be paradoxycal that there are a few tools implementing software metrics for For-tran [38,37]. Furthermore, most of them (if not all) have closed source and com-mercial/paid licences. In addition, there are no modern IDEs including metrics for the Fortran language. In this article we will contribute with an implemen-tation for Fortran of some of the most widely used software metrics, and we will integrate them in Photran, “a Fortran IDE and Refactoring tool based on Eclipse” [36].
2
Software Metrics
As defined in [18], a software metric is “A function whose inputs are software data and whose output is a single numerical value that can be interpreted as the degree to which software possesses a given attribute that affects its quality”. We will focus on a set of well known software metrics that have been used for the last 30 years by programmers and software scientists. All of them will be implemented to be used on Fortran programs.
2.1 Cyclomatic Complexity
set of thresholds were defined [12] related to software risk evaluation, as shown in Table 1. The CC is a widespread software metric even though has its own detractors [30,31].
Cyclomatic Complexity Risk Evaluation
1-10 A simple module without much risk 11-20 A more complex module with moderate risk 21-50 A complex module of high risk
51 and greater An untestable program of very high risk
Table 1.Cyclomatic Complexity Range Description
We have implemented the CC to measure routine’s complexity, and taking into account that the CC has different variations to be calculated, our approach is the same as that published in [4]. Each Fortran program is assumed to have a unique entry and exit point in order to simplify the complexity calculations: “For programs with unique entry and exit nodes, this metric is equivalent to one plus the number of decisions and in this work, is equal to the one plus sum of the following constructs: logical if, if-then-else, block-if, block if-then-else’s, do loops, while loops,and’s,or’s,xor’s,eqv’s,neqv’s, twice the number of arithmetic if’s, n-1 decision counts for a computed Go To with n statement labels, and n decision counts for a case if with n predicates”.
2.2 Halstead Complexity Metrics
A set of metrics derived from source code in order to measure computational com-plexity was proposed in the 70s [15,17,16]. A set of independent properties that could be obtained from an algorithm regardless of the programming language in which it had been written was defined, trying to determine if an algorithm “may possess a general structure which obeys physical laws”. The proposed properties were based on classifying program entities as either operators and operands [15]. The properties are:
– Number of different operators occurring in an algorithmη1. – Number of different operands occurring in an algorithmη2. – The total occurrences of operators in the programN1.
– The total occurrences of operands in the programN2.
And the metrics are defined using those properties:
– Unique Entities, also know as Program Vocabulary,η: the number of unique operators plus the number of unique operands in the program. Calculated asη=η1+η2.
– Program Volume,V: “consists of the product of the total number of entities occurring,N, and the number of binary digits which would be required to specify each such entity among distinct entities” [15]. Program Volume is calculated asV =Nlog2η.
– Level, L: “has a maximum value of unity, which will be reached whenever both the number of distinct operators is at its minimum value of two, and no operand has been mentioned more than once” [15]. Program Level is obtained asL= 2/η1∗η1/N2.
– Difficulty,D: defined asD= 1/L. – Effort,E: defined asE=V ∗D
Just like CC, Halstead metrics have different variations to be calculated [6,4], and our approach is the same as that published in [4].
2.3 Maintainability Index
While Software Maintenance were gaining momentum, software development practices were also maturing. Different authors argue that software maintenance represents the highest cost in the software development process. By 1975, “The total cost of maintaining a widely used program is typically 40 percent or more of the cost of developing it” [5]. In 1979, the software maintenance costs was reported to be 67% [35], in the 1990’s this number was about 75% [10], and in the 2000’s 90% of the entire project cost was calculated [11]. A maintenance index based on a three dimensional approach was proposed in [8], where the three dimensions are:
– Control structure. – Information structure.
– typography, naming and commenting.
The maintenance metric is a result of the analysis of different regression models. “The regression model that seemed most applicable was a four-metric polynomial based on Halsteads effort metric and on metrics measuring extended cyclomatic complexity, lines of code. and number of comments” [8]. As a result, the main-tenance index was defined as :
171−3.2∗ln(V)−0.23∗CC−16.2∗ln(LoC) +Comments
whereV is the volume as defined in the previous section, 2.2, CC is the Cyclo-matic Complexity, andLoCis the number of Lines of Code. Our implementation is based on a slight modification, resulting in [39]:
M I=M ax(0,(171−3.2∗ln(V)−0.23∗CC−16.2∗ln(LoC))∗100/171)
3
Fortran Software Metrics Implementation
(IDE) for Fortran based on Eclipse. As an IDE, photran integrates editing, source navigation, compilation, and debugging into a single tool. Furthermore, as it uses make for compilation, it can work with virtually any existing Fortran compiler. It is also equipped with error parsers, which help to interpret error messages from popular compilers and associate error markers with the appropriate lines of code [36].
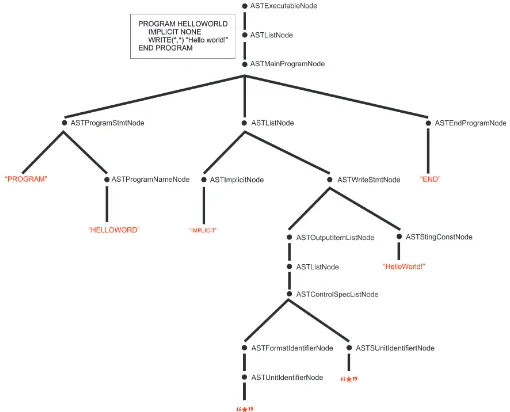
[image:5.595.178.433.282.488.2]Photran infrastructure uses a compiler-like approach to represent a Fortran program by building an Abstract Syntax Tree (AST) as a program represen-tation. An AST “represents the hierarchical syntactic structure of the source program.” [1]. Each construct occurring in the source code of the program is de-noted on a tree node. It is called “abstract” because the AST does not represent every detail which appears in the real syntax, see Figure 1. The Photran AST
Fig. 1.A Complete AST Structure for a helloworld.f90 Program
is based in the Fortran language definition, as expected, but also adds its own information, so that it is possible to modify the AST (which is why it is usually known asrewritableAST) an (re)generate the Fortran program.
Fig. 2.Gathering Fortran Metrics
so that collects and aggregates data from the proper AST nodes, depending on the specific metric.
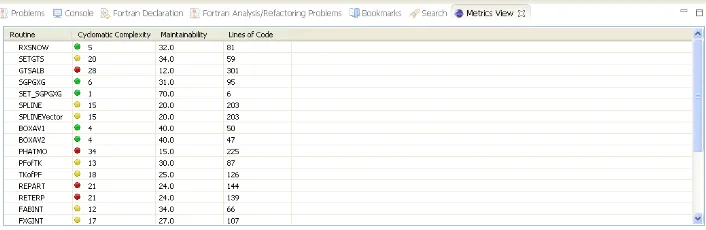
After the information about the selected editor is gathered it is shown in a specific IDE view called “Metric View”. Thus, we take advantage of the so-called Views defined by Photran. The Metric View in Figure 3 shows three specific metrics: Cyclomatic Complexity, Maintainability Index and Source Lines of Code per routine. The information in the view is updated each time a new editor is selected. We have added a small colored circle (red, yellow, green) that is displayed in the CC column indicating the color according to the range shown in Table 1.
Fig. 3.The Metric View: CC, MI, and SLoC per Routine
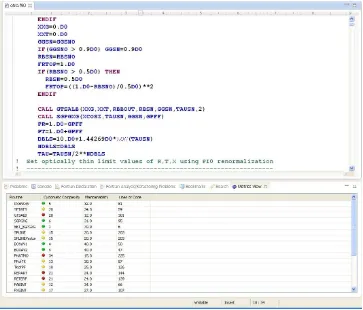
[image:6.595.137.490.398.513.2]Fig. 4.The Selected Fortran Editor and the Corresponding Metric View
4
Related Work
Integrating metrics data into a broadly used IDE is a relatively new idea. On the one hand Microsoft Visual Studio (which was initially known as Visual Studio 97 starting on May 1th, 1997 and passed through at least 8 product versions), has included metrics on its last 4 versions (Visual Studio 2008, 2010, 2012, 2013) [9]. On the other hand, Eclipse (from which Photran is derived) does not provide software metric data information in any of its distributions, but there are a set of plugins that allow the user to gather metrics data for Java and other supported programming languages.
5
Conclusions and Further Work
We have shown an implementation and integration into a modern IDE for the Fortran programming language of some of the most widely used software met-rics. The metric gathering process has been implemented with a compiler-like approach using ASTs. The obtained information has been integrated in a Pho-tran (an Eclipse derivation) view in order to make it available to the programmer while performing all the regular programming activities.
As our main interest is focused on Fortran source code transformation and Fortran Legacy source code handling [25,32], we will continue working on:
– Adding new metrics to the Metric View. – Allowing user customize the Metric View.
– Adding a column that shows Fotran obsolescent and deleted features used in the source code.
– Integrating new legacy-aware functionality to the IDE. – Integrating Static Analysis information as Photran Views.
References
1. Alfred V Aho, Monica S Lam, Ravi Sethi, and Jeffrey D Ullman. Compilers: principles, techniques, & tools, volume 1009. Pearson/Addison Wesley, 2007. 2. J. Backus. The History of Fortran I, II, and III. ACM SIGPLAN Notices,
13(8):165–180, 1978.
3. David W Balmer and Ray J Paul. Casm-the right environment for simulation.
Journal of the Operational Research Society, pages 443–452, 1986.
4. Victor R. Basili, Richard W Selby Jr, and T Phillips. Metric analysis and data validation across fortran projects. Software Engineering, IEEE Transactions on, (6):652–663, 1983.
5. Frederick P. Brooks. The Mythical Man-Month: Essays on Software Engineering. Addison-Wesley, 1975.
6. Necdet Bulut, Maurice H. Halstead, and Rudolf Bayer. Experimental validation of a structural property of fortran algorithms. In Proceedings of the 1974 annual conference-Volume 1, pages 207–211. ACM, 1974.
7. Malcolm Cohen. Fortran: A Few Historical Details. http://www.nag.co.uk/nag-ware/NP/doc/fhistory.asp, October 2004.
8. Don Coleman, Dan Ash, Bruce Lowther, and Paul Oman. Using metrics to evaluate software system maintainability. Computer, 27(8):44–49, 1994.
9. Microsoft Corporation. Visual Studio . http://msdn.microsoft.com/en-us/library/-bb385914(v=vs.90).aspx, May 1997.
10. A. Eastwood. Firm fires shots at legacy systems. Computing Canada, 19(2):17, 1993.
11. L. Erlikh. Leveraging legacy system dollars for e-business.IT Professional, 2(3):17– 23, 2000.
12. John Foreman, David A Fisher, Michael Bray, Kimberly Brune, and Mark Gerken. C4 software technology reference guide-a prototype, 1997.
14. E. Gamma, R. Helm, R. Johnson, and J. Vlissides. Design Patterns. Addison-Wesley Reading, MA, 1995.
15. Maurice H. Halstead. Natural laws controlling algorithm structure? ACM Sigplan Notices, 7(2):19–26, 1972.
16. Maurice H. Halstead. Elements of Software Science (Operating and programming systems series). Elsevier Science Inc., 1977.
17. Maurice H. Halstead and Rudolf Bayer. Algorithm dynamics. In Proceedings of the ACM annual conference, pages 126–135. ACM, 1973.
18. E. Iee. IEEE Std 1061-1998. IEEE Standard for a Software Quality Metrics Methodology, 1998.
19. ISO. ANSI/ISO/IEC 1539-1:1997: Information technology — programming lan-guages — Fortran — part 1: Base language.
20. ISO. ANSI/ISO/IEC 1539-1:2004(E): Information technology — Programming languages — Fortran Part 1: Base Language. pages xiv + 569, May 2004. 21. Alan H Karp. Programming for parallelism. Computer, 20(5):43–57, 1987. 22. Donald E Knuth. An empirical study of fortran programs. Software: Practice and
Experience, 1(2):105–133, 1971.
23. Meir M Lehman. The programming process. internal IBM report, 1969.
24. Thomas J. McCabe. A complexity measure. Software Engineering, IEEE Trans-actions on, (4):308–320, 1976.
25. M. M´endez, J. Overbey, and F. G. Tinetti. Legacy fortran software: Applying syn-tactic metrics to global climate models. InXVIII Congreso Argentino de Ciencias de la Computaci´on, Oct. 2012. Available at https://lidi.info.unlp.edu.ar/~ fernan-do/FortranLegacy/.
26. Michael Metcalf. Has fortran a future? Computer Physics Communications, 38(2):199–210, 1985.
27. Michael Metcalf. The seven ages of fortran. Journal of Computer Science and Technology, 11(1):1–8, 2011.
28. R. Miranda, F. Braunschweig, P. Leitao, R. Neves, F. Martins, and A. Santos. Mohid 2000, a coastal integrated object oriented model. Southampton, UK: WIT Press, Hydraulic Engineering Software VIII, 2000.
29. Miriam Schmidberger and Bernd Brugge. Need of software engineering methods for high performance computing applications. InParallel and Distributed Computing (ISPDC), 2012 11th International Symposium on, pages 40–46. IEEE, 2012. 30. Martin Shepperd. A critique of cyclomatic complexity as a software metric.
Soft-ware Engineering Journal, 3(2):30–36, 1988.
31. Martin Shepperd and Darrel C. Ince. A critique of three metrics. Journal of Systems and Software, 26(3):197–210, 1994.
32. F. G. Tinetti and M. M´endez. Fortran legacy software: source code update and possible parallelisation issues. ACM SIGPLAN Fortran Forum, 31(1):5–22, April 2012.
33. Arthur H. Watson, Thomas J. McCabe, and Dolores R. Wallace. Structured test-ing: A testing methodology using the cyclomatic complexity metric. NIST special Publication, 500(235):1–114, 1996.
34. Maurice V. Wilkes, David J. Wheeler, and Stanley Gill. The preparation of pro-grams for an electronic digital computer.
35. M. V. Zelkowitz, A. C. Shaw, and J. D. Gannon.Principles of software engineering and design. Prentice Hall Professional Technical Reference, 1979.
37. SimCon Ltd., FPT and WinFPT Reference Manual - Command-line Commands. http://www.simconglobal.com/fpt ref index.html.
38. The Numerical Algorithms Group 2014, NAG Software Developer Tools. Essential Tools Underpinning your Technical Programming. http://www.nag.co.uk/nagware.asp.