T HE A T T E NT I ON / S UP P O R T T O S T UD E N T S IN T HE
S O CI O - LA BO R T R AN S I TI O N
Li d i a E . S a nt a na V eg a
La Laguna University, Tenerife, Islas Canarias lsantana@ull.es
Abstract
In the present paper I intend to put forward some inquiries regarding the socio-labor guidance and transition of the young people in the co-ordinates of contemporary society. The outstanding paradox in which some young people are immersed when trying to get a first, second, third employment is also analyzed: “The job of looking for a job”. This is a common experience shared by many young people when they try to find a place in the complex labor panorama. Looking for a job is a recurrent situation in contemporary society, given the high dose of precarious employment in which the productive world moves. Life-long jobs belong to the past and what is normal is that people strive to enter the competitive labor market repeatedly.
Moreover, the paper offers the partial results of a larger research project that approaches tutorship, decision taking and expectations before the academic-labor future of the studentship in the last years of secondary school.
Finally, I suggest some insights in the line that it is not longer feasible to work with old-fashioned guidance, trying to channel people’s vocation and offering them information so that they get a job that provides them with the happiness of “doing what you like”. Behind these ideas lay the normal biographies, the predictable itineraries. Labor market complexity makes the transition to working life very difficult. Once immersed in it, biographies and labor itineraries are constructed and reconstructed at the rhythm of the changing fortunes of times.
Key words: transition to working life – guidance – tutorship – labor complexity
1. Introduction: some inquiries regarding guidance and socio-labor transition
A usual situation in our schools, and that is also present in other educational systems, has been recounted by professor Sternberg (2000)1 from University of Yale: a student chooses a subject introductory course. The subject is the one that interests him most; however, he fails. Therefore, the student concludes that he does not have the ability to attend a course of studies in that vocational area. The same thing happened to Sternberg when he wanted to specialize in psychology and got bad marks; thus, it seemed that he did not have the capacity to attend that course of studies. Moreover, his professor agreed and told him that there already existed a famous Sternberg in psychology and that, apparently,
there would not be another one. So, he changed to math, but as he did even worse he decided to go back to psychology. What was the problem? It is very simple. In that course, memorization was evaluated and he had never been good at that. Therefore, taking into account what the professor had evaluated, he failed the course (…). The question posed by this personal experience shared by other students would be: do we want those students whose major ability is not, for example, memorization, to abandon their vocation, be it psychology or any other discipline?
There are many questions to be raised when dealing with the matters this paper will develop, but there is one of particular relevance: Is the educational system in a position to guide students both, in the learning as well as in the socio-labor options? We should bear in mind that LOGSE reform (Educational System General Arrangement Law) increases the degree of optionality within the educative menu; the Educational Quality Law (LOCE) intends to generate new educational itineraries in the final stretch of compulsory secondary school; and the Education Organic Law (LOE) make the itineraries disappear providing a diversified educational offer that takes care of people’s diversity of thoughts, beliefs, capacities, processes and interests. Moreover, in contemporary society the number of professional occupations is increasing and old crafts are disappearing, since technology has revolutionized the occupational map.
Shall we know how to give the adequate response to the information demand, presenting it in an attractive, motivating manner, focused in students interests nucleus to enlarge such interests? But, above all, there is a quality that information and guidance must possess: it has to be meaningful, that is to say, linked to the socio-economic and cultural context of reference; and it has to be relevant, linked to people’s life experiences nucleus.
Shall we achieve a socio-labor education and professional guidance that really educates students, that deepens their self-knowledge, that improves their decision taking, that helps them to make a rational planning of the different learning itineraries to reach their professional aims? All these questions are challenges posed to the educational system. An adequate response requires the unification of the diverse viewpoints and the collaborative work of all the education responsible agents and students’ counselors. But, how do we approach young people’s guidance and socio-labor transition? The options, and the inquiries associated to such options, can be multiple:
a) Should we guide students towards the major labor demand jobs?
c) Should we make an analysis of the job positions, placing the individuals according to the diagnosis of their capacities, abilities and personality characteristics?
d) Should we…?
The options regarding what to do and how to do it are diverse. But the different alternatives on how to approach socio-labor education and professional guidance cannot be designed in the emptiness. The social, political, economic and educational contexts will modulate the answer.
And we shall not forget professional deontology. There is one thing that must be clear for good: no studentship counseling should be “prescriptive” for the future decision taking. To replace the students’ decisions implies making dangerous incursions in other people’s life, and besides, it is illicit, not even reasonable, given that it hinders the construction of the personal life project that must be self-constructed from autonomy and criterion maturity.
Khalil Gibran in his book El Profeta (The Prophet) tries to convey to parents a message about their children that could be applicable to the whole educational community:
Your children are not yours; they are the sons and daughters of the eagerness of life in itself. They come through you, but they do not belong to you, because they will inhabit the mansion of the future that not even in dreams you will be able to visit.
In this paper some issues related to the attention/support to students in the transition processes will be approached, in the light of the results obtained in a research financed by the General Direction of Universities and Research (DGUI).2 Moreover, one of the greatest paradoxes of postmodern society will be posed: “the job of looking for a job”; finally, I will show some provisional conclusions to keep on reflecting about the co-ordinates in which young people’s life moves in the threshold of the 21st century.
2. The “job of looking for a job”: one of the paradoxes of contemporary society
“The job of looking for a job” is a common experience shared by young people in their conversations, when they try to find a place in the complex labor panorama. Looking for a job is a recurrent situation in contemporary society, given the high dose of precarious employment in which the productive world moves. Life-long jobs belong to the past (unless sitting for a competitive examination for a public position) and what is normal is that people strive to get a second, third job.
In the newspapers’ section “Letters to the Editor”, both in local as well as in national ones, it is common to find letters from desperate young people before the situation they go through: high qualification level and mere possibilities of finding a job. The best contribution to the unemployment debate is found, according to Estefania (1995), in one letter published in El País newspaper headlined “I’m scared”:
I am a woman, I am Spanish, I am twenty seven years old, I have a degree in Law, I have a long-hours master and many other courses that qualify me to do more and more things; I have a good English level and a demonstrable almost professional experience, since I have never been hired but I have always worked through collaboration agreements to do practices –even without remuneration-; now I do not have a job, or practices, or anything; I only have the profile recently exposed and that will surely correspond –more or less- to that of many Spanish people of my age, who -same as me-, are unemployed; who -same as me- are looking for a job; who -same as me- do not find it and who -same as me- are scared.
According to Estefanía (1997) employment and social protection are the two faces of social cohesion upon which the idea of Europe was built. But it has been intended to reform the social protection levels (that need, for their modification, the consensus of the citizens that fight for their acquired minimal rights) applying the law of what the boss says goes. On the one hand, this has produced a certain personal break down and apprehension for the future of those who before unemployment feel abnormal since they are not in gear with the productive machinery. On the other hand, liberal economist schools make a linear reading of the two phenomena and connect them; there is unemployment because there is too much social protection and that discourages companies to hire people and unemployed ones to look for available positions.
In today’s socio-economic and political co-ordinates, transition to working life cannot be posed as a mere adjustment between employment demand and public or private employment offer; other variables should be taken into account (Sanchis, 1991):
• Possessing technical-professional requirements: general knowledge of a profession and specific knowledge of a given position.
• Having actual opportunities of incorporation into the labor market.
Students in general, and university students in particular, perceive that syllabuses are separated from the working world needs and demands. The monographs of the different courses of studies, elaborated by the Fundación Universidad-Empresa (University-Enterprise Foundation) during the 80’s and 90’s, account for the imbalance that the students perceive between University learning and working world requirements. The surveys made by the aforementioned Foundation to students of different schools allow us to get a glimpse of the unhappiness towards the syllabuses planning; generally, theoretical nature knowledge prevails, and the practices, when they exist, are far away from “real world” problems which young people will have to face when incorporated to remunerative work. The creation of the Higher Education European Space (EEES)3 is intended to correct such tendency and grant superior studies a more professionalizing dimension while to master’s degrees a more academic and researchable aspect promoting a higher degree of specialization.
3. Tutorship, decision taking and expectations before the academic-labor future of
students in the last two years of secondary school
In this section I intend to offer the partial report of a broader research project results, financed by public funds, that approaches young people academic and socio-labor transition; this project is the continuation of a former project performed with students of the last cycle of compulsory secondary school (Santana and Feliciano, in the press; Santana Vega et. al., in the press). Through both projects it is intended to offer the Guidance Department and tutorship an action proposal during secondary phase. In the first approach to the subject of study the group GIOES4 has intended to determine the information possessed by the students of the last years of secondary school for the decision taking process at the end of such phase, the attitudes and expectations regarding their performance and the academic-labor future, as well as the proposals they
3 The EEES is a project driven by the European Union (EU) to harmonize the European university systems so
that the structure of degrees, continuous learning studies, value of teaching hours and the marking systems become homogeneous and understandable in all the member states of the EU.
4 The acronym GIOES (http://webpages.ull.es/users/lsantana/gioes/) makes reference to the Education and
Socio-labor Guidance Research Group formed by the main researcher Lidia E. Santana Vega, and by the following contributors: Luis Feliciano, Ana E. Cruz, Ana B. Jiménez, Nancy González, Ma
put forth regarding tutorship development. The aim of the group was to elaborate and put into practice with those students a tutorship program adapted to their needs and demands.
On the basis of this general aim, the following sub-aims are put forward:
• To know the students’ personal and academic characteristics.
• To analyze the assessment they make of their own academic performance.
• To know their academic-labor expectations once they have finished secondary school.
• To examine their information level in relation to the decision taking process at the end of secondary school.
• To know the information demands of the students to make a decision at the end of secondary school.
• To determine the assessment they make of the aim and functionality of the activities developed in tutorships.
• To know their demands about the activities to be carried on during tutorships.
With the aim of obtaining the necessary information in relation to each dimension of such sub-aims, a Survey Study was carried out. This study was conducted with the students of the last two years of secondary school attending the schools that participated in this project. Following, the relative results of the different dimensions of analysis are offered.
3. 1. Methodology
A. Individuals
Figure 1. Distribution of individuals per Institute
60’3% of these students are attending the year before last, while 39’7% the last year. According to gender, 42’8% are males, while 54’0% are females. Regarding the area of studies in which they are enrolled, the greater percentage of individuals is placed within humanities and social sciences (52’5%), while the lowest percentage is placed within the scientific-technological area (18’5%) (Figure 2).
Figure 2. Distribution of individuals per area of studies
In this respect, each enrollment area distribution according to gender (Table 1) reveals that there exists a relational tendency statistically meaningful (Contingence coefficient: 0’28, p>0’000), by means of which male students attend in a greater
El Sobradillo
Teobaldo Power
Tomás Morales
Scientific-Tech
Nat. Sciences-Health
percentage the Scientific-technological, while female students place themselves in the Humanities and Social Sciences, reflected in Figure 3; a distribution that conditions future studies election of the male and female students.
Table 1. Studentship distribution according to gender and area of studies
Gender
Area of Studies
Scientific-Technological
Natural Sciences
and Health
Humanities and Social
Sciences
Male 31’4% 26’2% 42’4%
Female 8’7% 30’2% 61’1%
Figure 3. Figure representation of the enrollment area distribution per gender
B. Instrument
With the aim of obtaining information about the study dimensions, a questionnaire composed of 24 items was designed –multiple choice mainly- in which issues related to information, attitudes, expectations and demands of these students are approached in relation to their academic performance, decision taking at the end of secondary school and tutorship development.
The number of selected indicators’ for the information dimensions and the items in which they were placed are presented in Table 2.
0 20 40 60 80
Male Female
Scientific-Tech Hum.-Social Sc.
Scientific-Tech
Nat. Sc.-Health
[image:8.595.131.491.365.486.2]Table 2. Indicators’ number and questionnaire items for each information dimension
Information dimension Indicators Items
Academic and personal characteristics 5 1,2,3,4,5
Academic performance self-assessment 7 6,7,8,9,10,11,12
Academic-labor expectations 25 13,14,15,16,17,18,21
Information regarding decision taking 18 19
Information demand for decision taking 17 20
Tutorship assessment 10 21
Demands regarding tutorship development 18 22,23
3.2. Data analysis
The analysis of the questionnaire obtained data comprises: statistical descriptive data for each analyzed variable (frequency, percentage, centralization measures, dispersion, etc.), contingency tables and correlation coefficients (Chi square, Contingency), Such analysis were made through the SPSS.12 win program.
3.3. Procedure
The questionnaires were distributed among the three institutes through their counselors, and were applied to each student group by their corresponding tutors in the time scheduled for tutorship.
3.4. Results
A. Regarding individuals’ academic characteristics
Figure 4. Distribution of individuals according to course promotion
Regarding the marks obtained in the previous course, more than 50% of the students states that they have got a majority of “Good” or “Very Good” (Table 3), being only a minority of students that failed the course (8’4%).
Table 3. Studentship distribution according to the marks obtained in the previous course
Marks Majority
Below
standard
Majority
Pass
Majority
Good
Majority Very
Good
Majority
Excellent
Students Percentage
8’4% 20’0% 31’3% 27’8% 12’5%
B. Regarding the students’ academic performance self-assessment
[image:10.595.83.517.677.721.2]Regarding the individuals’ academic performance self-assessment, a 10% of them consider that, compared to their friends or classmates, they are “below the majority” (Table 4 and 5), while a 20% estimates that they are “above the majority”.
Table 4. Academic performance assessment compared to their best friends
Assessment I’m the
worst
Below the
majority
I’m like the
majority
Above the
majority
I’m the best
Students 1’2% 8’6% 71’4% 16’9% 1’8%
Percentage
Table 5. Academic performance assessment compared to their classmates
Assessment I’m among
the worst Below the majority Like the majority Above the majority I’m among the best Students Percentage
1’2% 9’4% 68’6% 14’3% 6’5%
Similar results are observed when they are asked about their performance in the case of sitting for the University Entrance Examination (PAU) (Table 6). In this case, while a 13% of the individuals state that their marks would be above the majority, another 13% considers that their marks would be below the majority.
Table 6. University Entrance Examination performance assessment
Assessment I’m among
the worst Below the majority Like the majority Above the majority I’m among the best Students Percentage
3’3% 10’6% 72’0% 12’9% 1’2%
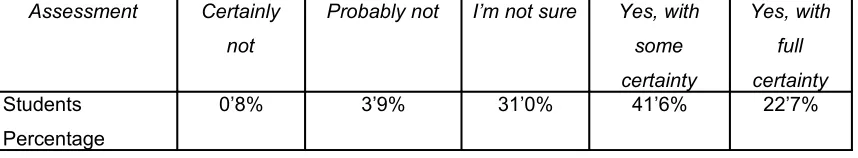
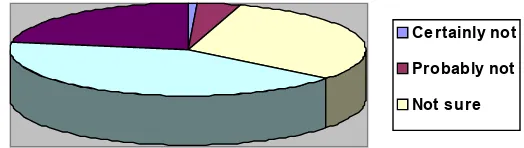
[image:11.595.88.517.528.607.2]A slightly higher percentage of negative answers are given when they are asked if they think that they could attend University studies and if they would be capable of finishing them (Tables 7 and 8).
Table 7. Having the capacity to attend University studies
Assessment Certainly
not
Probably not I’m not sure Yes, with
some certainty Yes, with full certainty Students Percentage
[image:11.595.85.520.661.722.2]0’8% 3’9% 31’0% 41’6% 22’7%
Table 8. Having the capacity to finish University studies
Assessment I wouldn’t
finish
Less likely Not sure Rather likely Very likely
Students Percentage
In both cases, as Figures 5 and 6 reflect, a third part of the students points out that they are not sure of being qualified to attend or finish university studies or considers that it is less likely. Even though the majority of individuals value themselves positively, the fact that a 35% evaluates negatively their capacities must be taken into account as it is going to be an important criterion at the moment of the decision taking at the end of the secondary school.
Figure 5. Having the capacity to attend University studies
Figure 6. Having the capacity of finishing University studies
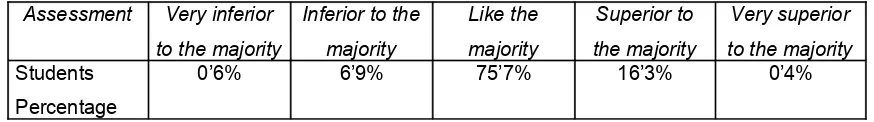
At the time of assessing their work in the Institute, only a 7% makes a negative evaluation of it, while a 16% is placed above the majority (Table 9).
Wouldn't finis h Le s s lik e ly Not s ure Rathe r lik e ly V e ry lik e ly
Ce rtainly not
Probably not
[image:12.595.179.448.472.543.2]Table 9. Assessment of the work they make in the Institute
Assessment Very inferior
to the majority
Inferior to the
majority
Like the
majority
Superior to
the majority
Very superior
to the majority
Students Percentage
0’6% 6’9% 75’7% 16’3% 0’4%
Finally, in relation to the marks they are able to get, the individuals mostly consider that they are placed between “Very Good” and “Good”. Only a 1% points out that their marks are mostly below standard. (Table 10).
Table 10. Marks they are able to obtain
Assessment Majority
Below
standard
Majority Pass Majority
Good
Majority
Very Good
Majority
Excellent
Students Percentage
1’0% 19’2% 44’9% 31’0% 3’9%
In brief, at the time of evaluating their performance and their academic possibilities, individuals consider that they are placed among the majority; a little less than a quarter of them keeps a very high assessment of their academic trajectory.
C. Regarding the decision they think they will take when they finish secondary school
[image:13.595.87.517.341.419.2]Table 11. Having the capacity to attend University studies
Assessment None Don’t Know
Other
courses
Work University
studies
CFGS Others
Students Percentage
0’2% 6’6% 0’6% 1’4% 72’5% 15’5% 3’1%
Regarding the decision taking certainty, we should highlight the fact that only a 42% of the individuals state feeling very certain (Table 12). The rest of the students give signals of not being completely sure of the decision to take.
Table 12. Certainty in the decision to be taken at the end of the secondary school
Assessment Very uncertain Rather uncertain Rather certain Very certain
Students Percentage
5’2% 20’0% 32’2% 42’7%
[image:14.595.148.488.514.635.2]This situation is more or less the same, presenting no difference between the year before last and the last year. (Figure 7).
Figure 7. Certainty about the decision to be taken at the end of the secondary school
The courses of studies mostly chosen as a first option by those that have decided to attend University studies differ according to the area of studies attended (Table 13).
0 20 40 60
Ye ar be fore
las t
Las t ye ar
V e ry unce rtain Rathe r ce rtain
Table 13. Chosen courses of studies as a first option by those that have decided to attend University studies within each area of studies
Course of studies
chosen as a first
option
Area of Studies
Scientific-technological
Natural Sciences and
Health
Humanities and Social
Sciences
Architecture 10’3% 1’7% 0%
Engineering 32’4% 1’7% 0%
Computing 19’1% 5’0% 0%
Medicine 1’5% 21’0% 2’4%
Nursing 0% 16’0% 0%
Biology 1’5% 6’7% 0%
Psychology 1’5% 2’5% 15’2%
Journalism 0% 0% 12’1%
Teaching 1’5% 0’8% 10’9%
Business Studies 2’9% 5’0% 11’5%
Law 0% 0’8% 12’7%
Individuals that attend different areas choose some of these courses of studies, but what is actually true is that decision taking in relation to University studies is clearly associated with the kind of studies attended during the last years of secondary school (Contingence Coefficient: 0’74, p<0.000). We need to point out that there are a total of 65 courses of studies chosen by the individuals as a first option.
The areas chosen as a first option by a higher percentage of students that are going to attend CFGS are: computing, secretarial course/business studies, nurse auxiliary and sound and image (Table 14). In this case, there were 25 areas mentioned by the 74 students that have decided to attend CFGS.
Table 14. Study areas of CFGS chosen as a first option by a higher percentage of students
Study area Computing Secretarial
course/
Business
Studies
Nurse
auxiliary
Child
Education
Sound and
Image
Students Percentage
[image:15.595.83.517.610.706.2]At the time of making a decision, most individuals state that they have not been helped by anyone in particular (61’1%). However, we should point out that a 33’2% of the students states that their parents have contributed in some way to such decision taking (Figure 8).
Figure 8. People that have helped the individuals to make a decision
The reasons mostly mentioned by students to justify their decision are: that it coincides with what they like, that they are capable of doing it and that it means doing something they can feel proud of. A lower percentage mentions “to find a job soon”, “to earn lots of money” and “to be of help to the rest” (Table 15).
Table 15. Reasons that explain the decision taken at the end of secondary school
Reason Because I like it To do something I can feel
proud of
I’m capable of doing it
Students percentage
82’6% 44’5% 40’0%
Reason To earn lots of
money
To be of help to the rest To find a job soon
Students percentage
22’8% 22’8% 17’0%
My friends
My parents
As regards the decision taking process, we shall also mention that important associations have been observed between students’ academic performance self-assessment and their decision to take either a University course of studies or a CFGS (Table 16, 17, 18, 19).
Table 16. Distribution of academic performance assessment (in comparison to that of classmates) and the kind of decision taken at end of secondary school
Option chosen Self-assessment
I’m among
the worst
I’m under the
majority
I’m like the
majority
I’m above the
majority
I’m among
the best
University 16’7% 45’5% 70’7% 91’4% 100%
CFGS 50’0% 43’2% 15’4% 2’9% 0’0%
Others 33’3% 11’3% 13’9% 5’7% 0’0%
[image:17.595.84.518.411.517.2](C. Coeficiency: 0’373, p<0’000)
Table 17. Distribution of the University entrance examination performance assessment and the decision taken at the end of secondary school
Option chosen Self-assessment
I’m among
the worst
I’m under the
majority
I’m like the
majority
I’m above the
majority
I’m among
the best
University 6’7% 31’4% 77’9% 90’5% 100%
Special Courses of H.E
66’7% 45’1% 11’2% 4’8% 0’0%
Others 26’6% 23’5% 10’9% 4’7% 0’0%
(C. Coeficiency p<0’000)
Table 18. Distribution of the capacity assessment to take up a University course of studies and the decision taken at the end of secondary school.
Option chosen Self-assessment
Certainly
not
Probably not I’m not sure Yes, with
some
certainty
Yes, with
full
certainty
University 0’0% 5’6% 46’3% 88’7% 91’8%
CFGS 100% 44’4% 32’7% 4’9% 4’5%
Others 0’0% 50’0% 21’0% 6’4% 3’7%
[image:17.595.84.518.601.706.2]Table 19. Distribution of the capacity assessment to finish a University course of studies and the decision taken at the end of secondary school.
Option chosen Self-assessment
I would not
finish
It is less likely I’m not sure It is rather
likely
It is very
likely
University 0’0% 3’8% 47’3% 87’5% 93’1%
Special Courses of H.E
83’3% 53’8% 30’2% 5’2% 5’4%
Other 16’7% 42’4% 22’5% 7’3% 1’5%
(Contingency Coefficency 0’548, p<0’000)
These results reveal that the less students value their performance, the more likely they opt for CFGS, while the more positively they value their performance, the more likely they take up a University course of studies. According to this, we can state that self-concept based upon perceived academic qualities is an important reference for the decision they have to take at the end of secondary school. These considerations are reflected in figure 9 that represents the distribution of the kind of marks students feel they are able to get and the option chosen at the end of secondary school. (Variables that produced a contingency coefficient of 0’454 and a significance level of p<0’000).
Figure 9. Distribution of the kind of marks students feel they are able to get and the option chosen at the end of secondary school
0 20 40 60 80 100
University CFGS Others
BS G
Exc.
[image:18.595.133.491.510.688.2]Furthermore, according to the results discussed so far, 64‘1% of the individuals show little or no agreement with the statement that it is hard for them to take a decision on their own as regards their academic-professional future (Figure 10). In fact, more than half of them believe that nobody in special has taken part on the decision taking process.
Figure 10. Distribution of the degree of agreement with the statement “it is hard for me to take my own decision as regards my academic-professional future”
The certainty that most of them show as regards the decision they take at the end of secondary school goes hand in hand with their worry about the PAU (Table 20).
Table17. Degree of agreement with the statement “I’m worried about sitting for the PAU”
Students
percentage
Full
disagreement
Little
agreement
Agreement Full agreement
8’1% 23’4% 43’3% 25’3%
D. About the academic-labor information students posses
Full disagreement
Little agreement Agreement
As regards the degree of information that students posses concerning academic-labor topics, the results show that more than 60% of the individuals express their lack of information on things such as: University jobs and examinations, course of studies’ syllabuses, the information requested for the enrollment in their future course of studies, University exchange programs or courses of studies that can be attended abroad (Table 18).
On the one hand, it is outstanding that 75% of the students lack information about University course of studies vacancies, what may lead them to choose one particular course of studies for which the may not have the average grading needed. On the other hand, it is reasonable that 67% lacks information about the CFGS since most individuals hope to attend University courses of studies and are therefore not interested in the subject.
[image:20.595.90.524.431.662.2]The same happens with socio-labor issues: a larger percentage of students points out their lack of knowledge about the requirements to practice certain professions, current labor-market demands, information centers that provide professional data or ways to look for a job.
Table 18. Degree of information students posses concerning academic-labor issues
Nothing Little Some A lot
Alternatives I can follow at the end of secondary school 1’8% 29’5% 50’8% 17’8%
University jobs and examinations 22’5% 53’2% 19’2% 5’1%
Curriculum design to look for a job 18’7% 39’0% 29’5% 12’9% Requirements for the practice of certain professions 19’3% 56’1% 19’9% 4’7%
Current labor-market demands 17’0% 49’2% 28’3% 5’5%
University vacancies 26’1% 48’0% 21’3% 4’6%
Course of studies’ syllabuses 15’2% 48’0% 30’5% 6’4%
Universities where you can attend a given course of studies 11’1% 34’3% 43’5% 11’1%
University exchange programs 45’0% 45’2% 7’6% 2’3%
Studies abroad 44’9% 42’7% 9’3% 3’1%
Relations between personal and professional characteristics 13’8% 34’5% 38’4% 13’3%
PAU characteristics 7’4% 31’6% 45’1% 16’’0%
Professions with good prospects 6’1% 36’7% 43’9% 13’3%
Computing resources for information searching 9’5% 34’6% 39’3% 16’7%
CFGS 20’5% 47’0% 27’1% 5’3%
Centers that provide professional information 40’4% 50’0% 8’0% 1’6%
Ways to look for a job 17’1% 47’8% 27’2% 7’8%
Information needed for enrollment 23’5% 49’1% 24’3% 3’1%
professions with good prospects. Individuals are divided by a 50% between those who are little or rather informed as regards things such as: curriculum design to look for a job, Universities where you can attend a given course of studies, relations between personal characteristics and those of the profession of choice, or computing resources for professional information searching
In general, there are no differences in the degree of information with respect to the year of secondary school they are attending. It has been observed that only in themes such as University vacancies, PAU characteristics and socio-labor information searching through computing resources, the percentage of individuals informed in the last year is slightly superior to that of those in the year before.
As regards the topics students wish to be informed about, the results obtained show that between 45-60% of the individuals points out as principal issues: “University jobs and examinations”, “requirements to practice certain professions”, “current labor-market demands”, “course of studies’ syllabuses”, “PAU characteristics”, “professions with good prospects”, “Universities where you can attend a particular course of studies” and “relations between personal characteristics and those of the profession of choice” (Table 19). This somehow suggests that students are mainly concerned with issues related to the academic-labor decision they have in mind which can help them to determine the validity of the chosen option.
It calls our attention the fact that students do not consider a priority the theme of “Universitary vacancies”, given the lack of information about it and its importance at the time of assessing the personal possibilities to attend a given course of studies.
It is easier to explain why students do not believe that tutorships shall deal with issues such as:” curriculum design”, “professional information centers”, “ways to look for a job”, “socio-labor information searching through computing resources”, since those are topics that will not be of use or immediate application in the near future for most of them would like to go on studying. Likewise, personal access possibilities to computing resources for academic-labor information could justify their low demand over this issue.
Table 19. Academic-labor topics about which students wish to be informed
Not
mentioned
Position 1-3 Position 4-7
University jobs and examinations 39’8% 30’9% 29’3%
Curriculum design to look for a job 59’3% 19’7% 21’0%
Requirements for the practice of certain professions 47’7% 23’6% 28’7%
Current labor-market demands 46’0% 21’7% 32’3%
University vacancies 61’4% 15’8% 22’8%
Course of studies’ syllabus 42’7% 28’7% 28’6%
Universities where you can attend a given course of studies
53’3% 20’7% 26’0%
University exchange programs 78’4% 7’9% 13’7%
Studies abroad 65’5% 13’8% 20’7%
Relations between personal and professional characteristics
54’0% 22’5% 23’5%
PAU characteristics 45’4% 27’9% 26’7%
Professions with good prospects 38’5% 27’5% 34’0%
Computing resources for information searching 84’7% 2’5% 12’8%
CFGS 72’0% 13’1% 14’9%
Centers that provide professional information 83’2% 4’6% 12’2%
Ways to look for a job 59’2% 11’4% 29’4%
Information needed for enrollment 68’5% 8’5% 23’0%
E. Regarding Tutorship appreciation
Table 20. Tutorship appreciation
TUTORSHIPS Full
disagreement
Little
agreeme
nt
Agreement Full
agreeme
nt
Attractive 37’4% 42’6% 18’5% 1’5%
Necessary 15’8% 26’6% 42’6% 15’0%
A good resource to solve problems 12’7% 26’1% 43’8% 17’4%
Deal with topics I am concerned about 24’0% 43’2% 27’6% 5’2% Clarify relationships between personal and
professional characteristics
35’8% 43’2% 16’8% 4’2%
Clarify doubts 26’8% 38’7% 29’1% 5’4%
Interactive 23’3% 36’2% 33’8% 6’7%
Encourage to look for information 31’8% 39’5% 23’8% 4’8%
Consider our opinions 15’4% 32’2% 34’0% 18’5%
A loss of time 26’1% 38’0% 21’5% 14’4%
However, when the way tutorship sessions develop is evaluated, more than 70% of the individuals do not believe they are attractive, that they deal with topics of their interest, that they clarify relationships between personal characteristics and those of the profession they like, that they clarify their doubts or encourage them to search for information. If we add to this the fact that 50% do not believe that they are interactive and that they take into account their opinions, the conclusion is that for a majority of students the development of tutorships is not meeting their expectations. Though a third part of the individuals positively value their tutorship sessions, the broad percentage of those whose evaluation is negative lead us to pose the urgent need to perform some changes in the development of such sessions.
Table 21. Requested activities for tutorship development
IT IS NECESSARY THAT Not
requested
Little
requested
Rather
requested
Very
requested
Students gather information 12’2% 37’5% 38’6% 11’7%
Activities develop in small groups 14’4% 37’7% 37’7% 10’2%
They use new technologies 7’9% 20’3% 42’9% 28’9%
They visit work centers 6’9% 11’5% 33’1% 48’5%
They have informative meetings with professionals
5’5% 9’8% 32’0% 52’7%
They fill questionnaires 12’1% 21’9% 40’4% 25’6%
They extend the number of hours 28’5% 29’4% 20’4% 21’7%
The tutor selects topics 34’4% 44’1% 15’2% 6’3%
University students participate 6’0% 15’2% 40’5% 38’3%
University professors participate 6’2% 10’2% 40’5% 43’0%
Parents participate 49’6% 34’8% 12’1% 3’5%
Opinions are divided by a 50% as regards the need to extend the number of hours, the fact that students have to gather information or work in small groups. On the contrary, a majority considers necessary that parents intervene in the sessions and that tutors determine the topics to be treated.
According to these results, it is evident that students want to obtain academic-labor information through professionals or new information technologies that help them to clarify the doubts and needs they have about it. The request to fulfill questionnaires could be explained in terms of the need to perform a comparison analysis of personal characteristics and those of the profession they like to determine the suitability of their decision. A greater intervention in tutorship development is also requested: the fact that one part of the students believes their doubts and opinions are not taken into account indirectly hides their desire to have tutorship activities which are not unilaterally decided by the tutor.
the use of any activity beyond its aim (“study other subjects”) or as a spare hour (“to have fun”).
Table 22. Final aim of tutorship sessions
IT IS AN
HOUR TO:
Be listened and
considered
Enjoy and have fun Study other subjects
Students percentage
38’3% 11’8% 17’7%
IT IS AN
HOUR TO:
Solve my problems and
needs
Discover my lack of
academic-labor
information
To work upon the
information I need
Students percentage
68’2% 66’1% 67’8%
The practical sense students grant to tutorials is confirmed since 96’4% of them believe they are not a loss of time. Thus, individuals look for a kind a tutorship that satisfies their actual information needs to take a decision and to clarify their doubts and academic-labor related problems; issues that from their point of view fill sessions with content and meaning.
In short, from the results of this study we can conclude that:
• Most students consider the alternative of taking up a University course of studies.
Their choice has a gender component since boys are mostly inclined towards the scientific-technological area while girls prefer human and social sciences.
• Decision taking is based on personal criteria such as: preferences, capacity and
the need to do something to feel proud of. Academic capacity assessment is associated with the decision to follow either a University course of studies or a CFGS.
• Students feel mostly certain about the professional academic alternative they have
of studies and profession requirements. The latter leads us to think that the decision taking process lacks rigor and the consideration of each student’s actual possibilities.
• Students show serious lack of information concerning their professional-academic future. This lack of information results in an inadequate decision taking which calls for the structuring of a new program within tutorials that enables students to analyze themes such as labor-market demands, University jobs and examinations, requirements to practice certain professions, course of studies’ syllabuses, PAU characteristics, professions with good prospects, Universities where you can attend a given course of studies and the relationships between personal characteristics and those of the profession they like.
• Students do not make a positive assessment of the tutorship development. This is
motivated by the dysfunctionality between what they ask for and what they are actually given. In short, tutorship shall be an hour for students to solve problems and doubts, recognize lack of information and work with the information needed for their academic and labor future. In the light of this, tutorships are not believed to help in recognizing the relationships between personal characteristics and those of the profession they like, clarifying doubts about their academic-labor future or dealing with topics of concern.
• Students ask for a practical tutorial that satisfies their needs. In fact, they believe it
necessary for an adequate decision taking, suggesting that they cannot be used for reasons other than examining the necessary information to figure out their academic and professional options.
• Requests concerning the activities to be carried on during tutorships are mainly
focused in gathering information from direct sources (professionals) or from new information technologies. It stands also as a demand the fact that the information they discuss derive from student’s needs and not only from tutor’s planning. It is equally requested the filling of questionnaires which could grant the possibility to clarify and examine personal characteristics in relation to professional and academic demands (possibly due to the high degree of lack of information observed).
Education, in a broad sense, has to prepare young people not only for the academic and socio-labor transition process but also for both the waiting time before actual labor insertion or for the unemployment periods between one job and other.
Transition process can be performed basically in two ways: abruptly and without enough judgment elements for an adequate decision taking; or slowly through a complex game of evaluation possibilities, whereby each person decides which life project he wants and can carry on according to current circumstances. Guidance institutionalization, and its inclusion in the Center’s Educational Project, is a formula that -if done correctly- can facilitate equal opportunities in a basically unequal world. (Santana Vega, 2003; Martinez Bonafé, 1992).
Though school is currently in position to guarantee formal equality, since it seems equal treatment rules life in classrooms, this has not always been so (Fernández Enguita, 1999); we should go on working for such equality to be real and not merely a matter of “forms”. The fact that students can be educated until the age of 16 does not mean that the school institution behavior is fair and that its potential benefits reach everyone equally (giving each student what corresponds to him). Reality persistently shows us once and again that cradle differences go through school’s walls. When it comes the moment to have access to labor-market, differences are equally perceptible; not everyone enjoys a group of influential contacts that can smooth their transition to working life.
One of the aims LOGSE estimated essential for compulsory education was the need that students “learn for life”; however, to achieve this goal schools must provide a quality psycho-pedagogical guidance. The knowledge, abilities, skills, attitudes, norms and values acquired by students shall become their “passport for life” (utilizing the terminology used by the Commission presided by Delors on Education for the 21st century called by UNESCO in 1996).
Now, it is the job of teachers and psycho pedagogical teams to make real one of the most praised LOGSE´s ideas, one that has enjoyed great acceptance within the educational community, i.e. help students to understand the surrounding world. The latter asks for a broader reading of reality that enable us to figure out the political, socio-economic and cultural co-ordinates that organize and build what is called the global village5. If we are able
to make students understand the cultural clues of the surrounding world, we will have taken a giant step towards the reform final aim: to guarantee the basic learning needed for a responsible participation in democratic society6.
Teachers and school supporting sub-systems (Guidance Departments, Regional Psycho-pedagogical teams, Teacher’s Centers Curricular counselors...) do not have the magical stick to disentangle the complex social reality. Maybe they can only wish to adopt a sociocritic working approach being conscious about the reality they are in to include themselves in a community working model. From such model we have to work together with other social agents and from that interaction develop suitable strategies (political, economic and of intervention with certain social sectors…) that can improve or help to deal with the uncomfortable socio-economic and cultural deprivation young people were placed in by a given “socio-economic and political structure” (Santana Vega, 2001b).
Future counselors will have to be updated with political, socio-economic and cultural changes. Together with their specialized education in the psycho-pedagogical field, they shall be attentive to any change affecting manhood and to the clues of times. To guide, psycho-pedagogical knowledge is not enough, it is also necessary to determine towards what and where do we guide. The analysis of reality to understand it, interpret it, and if necessary, even challenge it, is part of their professional activities (Santana Vega, 2003).
Parsons´ coined formula of the perfect link between individual–job position, exemplified by the analogy “round pins for round gaps”, is no longer suitable. It is not enough
5 As Torres Santomé (1994: 152), says, to undersatand the sourranding wordls it is necessary to “understand how
knowledge is elaborated, spreaded and legitimated, how knowledge construction, reconstruction and selection are influenced by perspectives, personal experiences, presumptions, prejudices, reference frameworks and power positions”.
6
to establish a sameness of form between individual characteristics and those of the job position in order to achieve individuals` full development and an efficient industrial system.
It is no longer enough to channel vocation and give information so as to get a job position that can grant the happiness of “doing what you like”. Behind these ideas underlie normal biographies and predictable itineraries; however, the complexity of labor market makes the transition to working life extremely difficult. Once immersed in it, biographies and itineraries are constructed and reconstructed at the rhythm of changing fortunes of times.
Information in critical periods such as both academic and socio-labor transition has proved to be an utterly inadequate strategy. If we want to provide a quality socio-labor guidance, we shall include it in the different curricular areas (Santana Vega, 1995; Santana Vega and Álvarez Pérez, 1996; Santana Vega and González Herrera, 1998; Santana Vega and de Armas Torres; 1998; Santana Vega and Ramos Hernández, 2002; Santana Vega et. al., 2003; Fernández Sierra, 1999).
Socio-labor orientation is filled with slogans such as You decide, You choose, Your future depends on you, It is in your hands, etc. We add to this a number of guides, computing programs, informative handbooks… with the aim of supporting counselors in their labor guidance job (López y otros, 1999). However, though diverse information sources and personal quality knowledge is highly valuable, they are not enough to perform guidance on their own.
Educational, familiar, social, labor and economic reality (both formal/informal and permanent) exert a powerful influence in both the labor market access and the transition to working life. It is no longer sufficient to have the Ticket of education (understood as a broad scope of knowledge, skills and attitudes for the job) since it can be a ticket leading to “nowhere”. Nowadays, young people must have various tickets if they want to get on the job train: the ticket of basic professional education, the ticket of extra knowledge (a second and third language, computing knowledge, etc), the ticket of friendship and family influential relations (that opens many doors in the labor market), among others. With those tickets in hand you would be able to go along socio-labor life with less hindering obstacles (psychological, social and economic) (Santana Vega, 2001b; 2001c).