STUDY ON THE INFLUENCES OF ENVIRONMENTAL NOISES IN PUBLIC
SPACES ON CONVERSATION
PACS: 43.50.Qp
Yokoyama Sakae; Ueno Kanako; Tachibana Hideki Institute of Industrial Science, University of Tokyo Komaba 4-6-1, Meguro-ku, Tokyo
153-8505 Japan
Tel: +81-3-5452-6428 Fax: +81-3-5452-6426
E-mail: [email protected]
ABSTRACT
In order to examine the effect of environmental noise in public spaces on conversation, subjective experiments in a laboratory were performed. In this study, a 6-channel recording/reproduction system was applied to realize natural auditory impression in 3-dimensional spaces. The experiments on the effect of environmental noises on direct (face-to-face) conversation and telephone conversation were performed. As an additional study, the difference of languages, Japanese and English, was examined by focussing on the situation of “hearing”.
INTRODUCTION
In such public spaces as railway stations, airport lobbies and shopping arcades, it is often observed that the space is too much reverberant and noisy for conversation and hearing the announcements through public address system. In architectural design of this kind of spaces, acoustical consideration must be included as well as safety, fire prevention and maintenance. As a study to investigate such acoustical problems, the effect of environmental noises in public spaces on conversation was examined by laboratory experiments in this study.
To simulate actual noise environments in an acoustical laboratory, the 6-channel recording/reproduction system developed in our laboratory [1] was applied to the subjective experiments in this study. The experiments were performed in two steps: one is for the effect of environmental noises on direct (face-to-face) conversation and telephone conversation and the other is the experiment focussing on the easiness of hearing. In the latter experiment, the difference of language (Japanese and English) was examined.
EXPERIMENTAL SYSTEM
adjust the level in the simulated sound field. Although very simple in principle, 3-dimensional acoustic properties of the real sound fields can be simulated in an anechoic room and natural auditory sensation can be realized by this technique. In the simulated sound field, the listener may move his/her head within 30 cm around the center point. Within this area, the listener can obtain the same aural impression. The authors have been applying this simulation technique to psycho-acoustic experiments on the effect of environmental noises [2-5] and concert hall acoustics [6]. In the latter experiment in this study, another loudspeaker was added to the system to reproduce announcements.
Fig.1 Outline of the 6-channel recording/reproduction system
TEST SOUNDS USED IN THE EXPERIMENTS
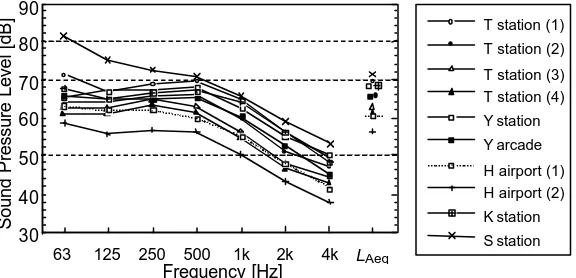
In various kinds of public spaces in Japan, environmental noises were collected through the 6-channel recording system mentioned above. Among them, ten kinds of noises with 30 s duration time excluding such specific noises as train passage and PA announcement were prepared as the test sounds for the experiments (see Fig.2). They were reproduced at the listening point in the test room at the same levels as in the real fields (56 to 72 dB in LAeq).
Fig.2 Test sounds used in the experiments
SUBJECTIVE EXPERIMENTS ON DISTURBANCE IN CONVERSATION
To examine the effect of noise on disturbances in conversation, two kinds of experiments were performed using the test sounds mentioned above; one is the effect of on direct conversation and the other is that on telephone conversation through mobile phones.
Experimental Method
Imaging being in a public space, the subject sitting at the listening position had a conversation with the experimenter (Japanese female, S. Yokoyama). In the experiment on direct
Loudspeaker 6ch.
2m
SP. SP.
Distance of the Microphones =135mm Data Recorder (SONY PC208A)
Equalizer
Power Amp.
SP.
SP. for “hearing” SP.
SP.
SP.
T station (1)
T station (2)
T station (3) T station (4)
Y station
Y arcade
H airport (1) H airport (2)
K station
S station
63 125 250 500 1k 2k 4k LAeq
30 40 50 60 70 80 90
Frequency [Hz]
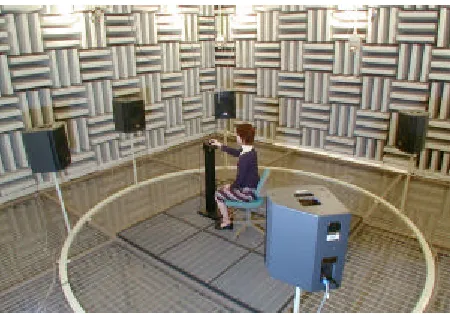
[image:2.596.158.446.479.618.2]conversation, the experimenter located at a position 1 m apart from the subject (see Fig. 3). In the case of telephone conversation, the subject sitting at the same position as in the former case talked with the experimenter outside the test room through PHS cordless cellular phones. The contents of the conversation were simple everyday conversation in Japanese. As the test method, the rating scale method was applied. That is, after the conversation, the subject was asked his/her impression during the conversation in four-step categories as shown in Table 1. In this study, the questionnaire included three items; the disturbance for “speaking”, “hearing” and “total conversation”. In each test for a subject, each test sound was presented 2 times in random order in a series of test. At the beginning of the experiment 5 trials were included. 32 (20 male and 12 female) Japanese subjects with normal hearing ability from 15 to 36 years old participated in the experiments.
Fig.3 Direct conversation
Experimental Results and Discussions
Although the subjective judgments were obtained in ordinal scale, the experimental results were treated as in interval scale and the following analyses were performed. Since the individual test-retest correlation and the correlation among subjects were considerably high for all subjects in both experiments, the average values of the subjective responses (64 judgments: 2 times 32 subjects) were calculated for each test sound in each condition.
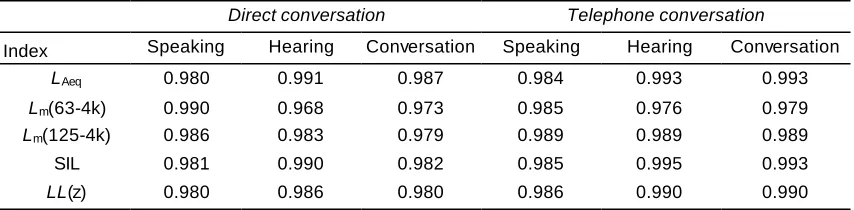
At first, the correlation between the subjective response to each of the questionnaire and the magnitude of the test sound (environmental noise) was examined using five indices. The results are shown in Table 2, in which very high correlation is seen in all cases. Among indices used here, Lm(f1-f2) is the arithmetic average of sound pressure levels in octave bands from f1 to f2 which is proposed as a simple loudness index [7].
[image:3.596.280.493.216.362.2]Figures 4 (a) and (b) show the relationship between the experimental results for each of the three items and LAeq of the test sounds in each experimental situation (direct conversation and telephone conversation). In both situations, the subjective impression of disturbance for each item is highly correlated with LAeq. To compare the two experimental situations, the judgment for “speaking” is almost the same, whereas the judgment for “hearing” is different (significance level; p<0.01). It means that disturbance in “hearing” is a bit higher in the case of direct conversation than in the case of telephone conversation. To see the results for “total conversation”, it is seen that the effect of noise is a bit more severe for direct conversation than for telephone conversation. To sum up the total results, it has been found that the response of “a little disturbing” appears when the environmental noise becomes at around 62 to 64 dB and that of “very disturbing” appears at around 67 to 69 dB in LAeq.
Table 2 The correlation between the disturbance in conversation and noise indices
Direct conversation Telephone conversation
Index Speaking Hearing Conversation Speaking Hearing Conversation
LAeq 0.980 0.991 0.987 0.984 0.993 0.993
Lm(63-4k) 0.990 0.968 0.973 0.985 0.976 0.979
Lm(125-4k) 0.986 0.983 0.979 0.989 0.989 0.989
SIL 0.981 0.990 0.982 0.985 0.995 0.993
LL(z) 0.980 0.986 0.980 0.986 0.990 0.990
4. extremely disturbing 3. very disturbing
2. a little disturbing
[image:3.596.84.511.659.764.2](a) Direct conversation (b) Telephone conversation Fig. 4 The relationship between the experimental results of disturbance and LAeq
SUBJECTIVE EXPERIMENTS FOR DISTURBANCE IN HEARING
As an additional study on the influence of noise on conversation, the difference of languages, Japanese and English, was examined by focussing on the situation of “hearing” as follows.
Experimental Method
[image:4.596.185.410.532.689.2]As shown in Fig. 5, the subject sat at the listening position as in the former experiments and by imaging being in direct conversation adjusted the announcement from the additional loudspeaker simulating the partner to the level judged proper for “hearing”. In this experiment, female announcements in Japanese and in English with 25 s duration, respectively, were used. As the test method, the rating scale method was again used. That is, after adjusting the level of the announcement, the subject was asked to answer the question regarding his/her impression while hearing the announcement in four-step categories shown in Table 1. In each test for a subject, each test sound was presented 2 times in random order. At the beginning of the experiment, 5 trials were included. 16 (3 male and 13 female) Japanese subjects with normal hearing ability from 21 to 27 years old participated in the experiment. They are divided into two groups; one is the group who lived only in Japan (10 students: group A) and the other is the group who have experience of living in foreign countries for one or more yeas where English is the main language (6 students: group B).
Fig.5 Hearing with image having a conversation
Experimental Results and Discussions
Figures 6 (a) and (b) shows the relationship between the level in LAeq of the announcement adjusted by the subjects and that of the environmental noise. In this result, it is seen that they are in high correlation but the level difference between them (S/N ratio) is not constant; that is,
55 60 65 70 75
1 2 3 4
Speaking
Hearing
Conversation
category
L
Aeq [ d B ]
55 60 65 70 75
1 2 3 4
Speaking
Hearing
Conversation
category
L
the higher the environmental noise is, the smaller the S/N ratio is. In both cases for the two subject groups, the announcement in English was adjusted a bit louder than that in Japanese (p<0.01).
In the same way as in the previous experiments, the experimental results were treated as in interval scale and the following analyses were performed. Since the individual test-retest correlation and the correlation among subjects are considerably high for all subjects in this case, too, the average values of the subjective responses were calculated for each test sound and in each condition.
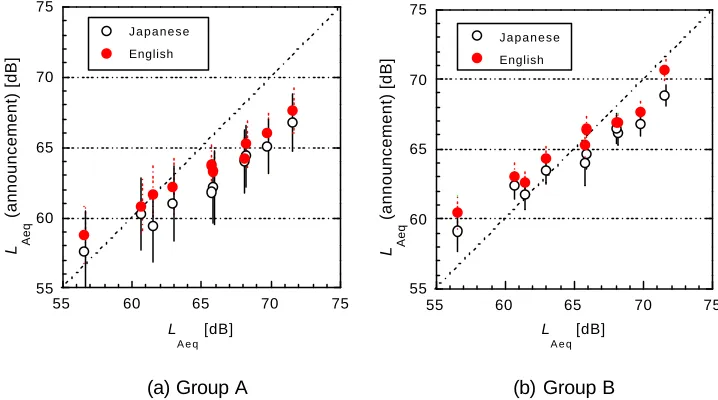
Figures 7 (a) and (b) shows the relationship between the experimental results for “hearing” and LAeq of the test sounds for the subject groups A and B, respectively. In the results for the group A, a slight difference is seen between the result for English announcement and that for Japanese one (p<0.05), whereas in the results for the group B, there is no difference between these two conditions.
Next, the experimental results for all subjects were averaged for the two conditions of Japanese announcement and English one. Figure 8 shows the relationship between the experimental results (categories) and LAeq of the test sounds. In this result, there is no difference between the result for Japanese announcement and that for English one. In both conditions, it is seen that the response of “a little disturbing” for “hearing” appears at around 61 dB and “very disturbing” appears at around 67 dB in LAeq.
[image:5.596.111.470.315.515.2] [image:5.596.86.507.561.753.2](a) Group A (b) Group B
Fig. 6 The relationship between the proper level of announcement (in LAeq) and the level of the environmental noise (in LAeq) ; Vertical line shows the standard deviation
(a) Group A (b) Group B
Fig.7 Relationship between the experimental results for “hearing” and LAeq of the test sounds
5 5 6 0 6 5 7 0 7 5
1 2 3 4
Japanese
English
category
L
A e q [dB]
5 5 6 0 6 5 7 0 7 5
1 2 3 4
Japanese
English
category
L
A e q [ d B ]
55 60 65 70 75
55 60 65 70 75
J a p a n e s e
English
L Aeq
(announcement) [dB]
L A e q
[dB]
55 60 65 70 75
55 60 65 70 75
J a p a n e s e
English
L Aeq
(announcement) [dB]
L A e q
Fig.8 Relationship between the experimental results for “hearing” and LAeq of the test sounds for all subjects
CONCLUSIONS
From the experimental results obtained in this study, the followings have been found regarding the effect of environmental noises in public spaces on conversation.
1) To compare the direct (face-to-face) conversation and telephone conversation, the disturbance of noise in “speaking” is almost the same, whereas the disturbance in “hearing” is a bit higher in the former condition than in the latter condition (p<0.01). Consequently, the disturbance of noise in “total conversation” is a bit higher in the case of direct conversation than in the case of telephone conversation.
2) In both cases of direct conversation and telephone conversation, the response of “a little disturbing” appears when the environmental noise becomes at around 62 to 64 dB and that of “very disturbing” appears at around 67 to 69 dB in LAeq. For reference, in the revised “Environmental Quality Standards for Noise” in Japan, 45 dB in LAeq is specified for the level to be kept indoors to preserve conversation from environmental noises. From the results of this study, it can be said that this specification is very conservative.
3) Regarding the difference of experience of living overseas (English conversation) among Japanese subjects, there is no serious difference in the response of disturbance of noise when hearing Japanese and English announcement.
BIBLIOGRAPHICAL REFERENCES
[1] S. Yokoyama, K. Ueno, S. Sakamoto and H. Tachibana, “6-channel recording/reproduction system for 3-dimensional auralization of sound fields,” Acoust. Sci. & Tech. 23. 2, 97 (2002). [2] S. Yokoyama, K. Ueno and H. Tachibana, “Experimental study on the effect of noises on conversation in public spaces using 6-channel recording/reproduction system,” Proc. of The Seventh Western Pacific Regional Acoustics Conference, 843 (2000).
[3] S. Yokoyama, M. Ikeda, K. Ueno and H. Tachibana, “Experimental study on the effect of road traffic noise by using a 6-channel recording/reproduction system” Proc. of the 17th International Congress on Acoustics (2001.9).
[4] K. Ueno, K. Yasuda, H. Tachibana and T. Ono, “Subjective effect of HVAC noise on music players,” Proc. of inter-noise 2000, 337 (2000.8).
[5] K. Ueno, K. Yasuda and H. Tachibana, “A psycho-acoustical experiment on HVAC noise,” Proc. of the 17th International Congress on Acoustics, (2001.9).
[6] K. Ueno, H. Tachibana, ”Experimental study on the evaluation of stage acoustics by music players using 6-channel sound simulation system,” Proc. of the 3rd Convention of the European Acoustics Association (2002.9).
[7] H. Tachibana, et al., “Validity of arithmetic average of sound pressure levels in octave bands as a loudness index,” J. Acoust. Soc. Jpn. (E) 14,3, 197 (1993).
5 5 6 0 6 5 7 0 7 5
1 2 3 4
J a p a n e s e
English
category
L
A e q