ABOUT THE DETERMINATION OF THE ACOUSTICAL PROPERTIES OF
SURFACES ‘IN-SITU’ USING THE ‘AUTO-POWER-DENSITY-SPECTRA’
PACS: 43.58.+z
Jörn Hübelt, Andreas Zeibig
Institut für Akustik und Sprachkommunikation Technische Universität Dresden
Mommsenstr. 13, 01062 Dresden Germany
Tel: +49 351 463 32449 Fax: +49 351 463 37091
E-mail: Joern.Huebelt@mailbox.tu-dresden.de
ABSTRACT
One of the commonly used ‘in-situ’ measurement techniques is the ‘Impulse-Echo-Method’. This technique is often applied by executing the robust ‘Subtraction’-technique, which requires two measurements. But the precision of this method depends strongly on the match of the group delay of both measured transfer functions.
An alternative technique of signal analysis has been introduced. This approach is based on the application of the ‘Auto-Power-Density-Spectra’. Here the phase information of the direct propagation path is cancelled. However it is imaginable that this method requires a more exact determination of the amplitude.
For the bias and random error estimation of the introduced method a model was deduced which accounts for significant errors. Furthermore a ‘Monte Carlo’ analysis has been carried out to examine the effect of time windowing.
INTRODUCTION
The successful optimization of porous road surfaces supposes the prediction of the sound field above the road. To proof this model an in-situ measurement technique had to be employed. One of the commonly used technique is the so called ‘impulse-echo-method’. This robust technique is often applied by executing the ‘Subtraction technique’, a method of signal analysis [Mom95].
Here for the determination of the acoustical properties (e.g. the reflection coefficient) two measurements have to be carried out, one close to the surface under test and the other one in a great distance to the surface (free field). Subsequently the impulse response of the surface can be extracted by the calculation of the difference between the two impulse responses.
The precision of this procedure depends on the match of the group delay of the impulse responses. Hence a deviation of temperature and thus a difference of sound speed during the measurements could lead to inaccuracy of the results.
In consequence of a permanent solar radiation a temperature gradient occurs above the road surface. That means the different spatial orientation of the measurement system (loudspeaker to microphone) during the measurement procedure leads to a deviation of the group delay of the impulse responses. The minimization of that deviations can be reached by use of a high sampling rate much higher as the ‘Nyquist-frequency’. This can be combined with a time shifting of one of the impulse responses using curve fitting (e.g. ‘spline’ - interpolation).
pt
(
t
) =
prd
(
t
) +
nprrn
∗
hn
(
t
−
τn
)
n
= (1
,
2
,
3
...
)
To avoid the requirement of very high sampling frequencies a technique of signal analysis has been developed whose accuracy is nearly independent on the aforementioned mismatch of time delay. Its mathematical description bases on the ratio of ‘Auto Power Density Spectra’ (PDS) of both impulse responses.
The accuracy of that extraction technique has been studied in regard to the measurement of the reflection coefficient of road surfaces.
An analytical description of the random and the bias error for the ‘PDS’- and the ‘Subtraction’-technique has been developed using the law of error propagation. In addition to it a ‘Monte Carlo’-analysis has been carried out to examine the effect of the time-windowing.
SOME BASIC PREDEFINITIONS
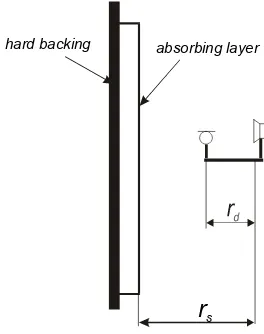
hard backing absorbing layer
[image:2.595.230.362.214.381.2]r
sFigure 1: The measurement set up.
assumption for the sound field; distance of the loud speaker to the surface under test:
In this examinations the angle of incidence shall be perpendicular to the surface under test. Hence it for a sufficient distance of the loud speaker to the surface under test rs (see Figure 1) and a small active area (‘Fresnel Zones’) [Boul97] the incident sound wave can be assumed as flat. For clarity the size of the active area is reciprocally proportional to the considered frequency.
distance of microphone to the surface under test, small active surface (‘Fresnel-Zones’): The total pressure ptreceived at the microphone can be written as
. (1)
Where * denotes the convolution, prd the impulse response of the direct propagating path, prr1 the impulse reflected from the surface under test and prr(n+1) the reflections from surrounding surfaces (reverberation, echo). In Equation (1) the extraneous background noise is neglected. Furthermore the length of propagating path rr1 can be easily calculated by (rr1=2rs-rd).
The reflection coefficient is by definition the ratio of the reflected to the incident sound pressure in frequency domain. That means using a geometrical spreading factor the reflection coefficient can be determined using the ratio of Prr1(ω) to Prd(ω).
The reflected part has to be extracted by time windowing. Here the inverse ratio of the lower cut off frequency fcl to the length of time window requires:
. (2)
Therefore a sufficient lower cut of frequency requires short distances of the microphone to the surface under test (in the most cases the distance to the surrounding surfaces is invariant):
. (3)
This premise is in accordance to the requirement for a small active surface (‘Fresnel Zones’).
r
d≈
r
r1THE DERIVATION OF ‘PDS’ THE TECHNIQUE
In 1984 Bolten et. al. [Bol84] suggests an extraction technique using the complex cepstrum. Here an ideal windowed impulse response of the system described in Equ. (1) is supposed (n=1). The fourier transform of that impulse response is:
. (4)
By applying the squared modulus and the natural logarithm Equation (4) yields to:
(5)
(the asterisk stands for conjugate complex).
Using the series expansion for
(6)
the inverse Fourier transform of Equation (5) gives:
(7)
(index c stands for cepstral range and ∗ for convolution).
Equation (7) describes an ‘impulse train’ in cepstral domain where the delay of the pulses is determined by the convolution of impulses response by itself. The impulse response of the reflecting surface h can be extracted by time windowing. But by considering the requirement of Equation (3) for a reasonable length of window the second term of Equ. (7) is included. Thus a significant error arises. To find a remedy the function in Equ. (4) is transformed by applying the squared modulus only:
. (8)
In this case in the cepstral domain two impulse responses at τ=0 can be observed (denoted by the first and the second term in Equ. (8)). The third impulse response occurs at τ=-τ1 and fourth at τ=τ1. Henceforth the impulse response at τ=τ1 can be extracted properly.
RANDOM AND BIAS ERROR ESTIMATES
As mentioned both the ‘Subtraction’– and the ‘PDS’-technique require two measurements. For the description of the first transfer function Pt(1) the Equation (4) can be applied. For the second transfer function Pt(2) the Equation (4) is also used. But here the value of Prr1 has to be set to zero.
P
t(ω) =
P
rd
(ω)
·
1 +
P
rr1(ω)
P
rd(
ω
)
·
H
(ω)
·
e
−jωτln
|
P
t(
ω
)
|
2=
ln
|
P
rd(
ω
)
|
2+
ln
1 +
P
rr1(
ω
)
P
rd(
ω
)
·
H
(
ω
)
·
e
−jωτ+
ln
1 +
P
rr1
(
ω
)
P
rd
(
ω
)
·
H
(
ω
)
·
e
+jωτln(1 +z) =z−z 2
2 +
z3 3 − · · ·
p
c t(
t
) =
p
c rd
(
t
) +
p
c rrp
c rdh
(
t
−
τ
)
−
p
c rrp
c rd 2h
(
t
−
τ
)
∗
h
(
t
−
τ
)
/
2 +
· · ·
+
p
c rr
p
c rdh
(
−
t
−
τ
)
−
p
c rrp
c rd 2h
(
−
t
−
τ
)
∗
h
(
−
t
−
τ
)
/
2 +
· · ·
|
P
t(
ω
)
|
2=
|
P
rd(
ω
)
|
2+
|
P
rr1(
ω
)
|
2
· |
H
(
ω
)
|
2+
P
rd
(
ω
)
·
P
rr1
(
ω
)
·
H
(
ω
)
·
e
+jωτ+
P
rd(
ω
)
·
P
rr1(
ω
)
·
H
(
ω
)
·
e
By assuming an ideal time window the magnitude of the reflection coefficient for the ‘Subtraction”-technique is:
(9)
and for ‘PDS”-technique:
. (10)
Supposing an ideal ‘cepstral’ window Equ. (10) yields to:
. (11)
Bias Error Estimates
In general the propagation of the bias error is:
(12)
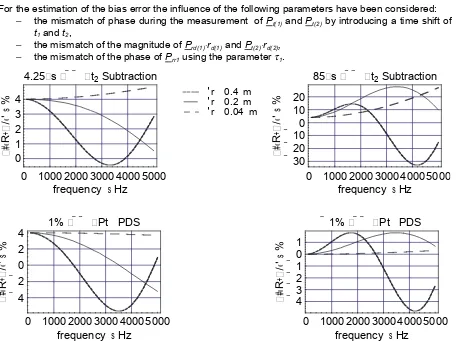
For the estimation of the bias error the influence of the following parameters have been considered: − the mismatch of phase during the measurement of Pt(1) and Pt(2) by introducing a time shift of
t1 and t2,
[image:4.595.73.529.376.717.2]− the mismatch of the magnitude of Prd(1)⋅rd(1) and Pt(2)⋅rd(2), − the mismatch of the phase of Prr1 using the parameter τ1.
Figure 2: The bias error ∆|R(ω)| of both extraction techniques.
Upper row: ‘Subtraction’-technique ∆pt(1)=∆pt(2)=1%, ∆τ1=1%,∆t(2)=4.25µs or 85µs Lower row: ‘PDS’-technique ∆pt(1)=1%, ∆τ1=1%, ∆t(2)= 85µs, ∆pt(2)= 1% or -1%.
∆
y
=
n
i=1
∂f
∂xi
·
∆
xi
0 1000 2000 3000 4000 5000
frequency
s
Hz
4
2
0
2
4
#«
R
+
/«'
s
%
1%
Pt PDS
0 1000 2000 3000 4000 5000
frequency
s
Hz
4
3
2
1
0
1
#«
R
+
/«'
s
%
1%
Pt PDS
0 1000 2000 3000 4000 5000
frequency
s
Hz
0
1
2
3
4
#«
R
+
/«'
s
%
4.25
s
t
2Subtraction
'r 0.04 m 'r 0.2 m 'r 0.4 m
0 1000 2000 3000 4000 5000
frequency
s
Hz
30
20
10
0
10
20
#«
R
+
/«'
s
%
In Figure 2 the bias error for both extraction techniques is shown. Clearly visible is the dependence of the bias error on the difference of direct and reflected path ∆r=rr1-rd.The error function upon
frequency follows a sine function. A small value of ω∆r/c leads to a decrease of the error in the lower frequency range. It has been confirmed that the accuracy of the subtraction technique depends strongly on the match of phase of both measurements Pt(1) and Pt(2). (see the upper half of Fig. 2, the time shift of 4.25µs corresponds to a twelve times over sampling of the signal fu=5kHz). In contrast the ‘PDS”-technique doesn’t depend on the phase mismatch of Pt(1) and Pt(2). For a small time shift there is nearly no significant difference in the predicted bias errors for both techniques.
The Random Error Estimates
The law of error propagation for the standard random error is by definition:
(13)
For the estimation of the random error the influence of the following parameters have been considered:
− the magnitude and the phase of Pt(1) and Pt(2), − the phase of Prr1 using τ1.
0 1000 2000 3000 4000 5000
frequency
s
Hz
1.5
2
2.5
3
3.5
4
#«
R
+
/«'
s
%
0.2
r
0 1000 2000 3000 4000 5000
frequency
s
Hz
1.5
2
2.5
3
3.5
4
#«
R
+
/«'
s
%
0.3
r
0 1000 2000 3000 4000 5000
frequency
s
Hz
2.5
2.75
3
3.25
3.5
3.75
4
4.25
#«
R
+
/«'
s
%
0.04
r
Sub
PDS
0 1000 2000 3000 4000 5000
frequency
s
Hz
1.5
2
2.5
3
3.5
4
#«
R
+
/«'
s
%
[image:5.595.70.527.289.592.2]0.1
r
Figure 3: The normalized random error ε[ |R(ω)|] of both extraction techniques.
input data: ε[|pt(1)|]= ε[|pt(2)|]=ε[|Arg(pt(1)))|]= ε[|Arg(pt(2))|]= ε[τ1]=1%. Parameter: ∆∆∆∆r=rr1-rd.
Figure 3 shows the normalized random error for the extraction techniques. As observed by the examinations of the bias error the value of random error depends on the difference of the direct and the reflected propagation path. In general for both extraction techniques there is nearly no significant difference in the predicted random errors.
By the way the consideration of Pt(i) as transfer functions (sound pressure to electrical signal) allows the estimation of the normalized random error of the measurements using the coherence function [Bendat78] (the coherence function is supported by the most of the common analysis systems):
, (14)
. (15)
σ
y=
n i=1∂f
∂x
i 2·
σ
2i
εPˆt(i)(ω)=εHˆxy(i)(ω)≈
1−γxy(i)(ω)
2
γxy(i)(ω)
2
·nd
MONTE CARLO ANALYSIS
In the examinations of the previous chapter the effect of ‘time’- and ‘cepstral’-windowing is omitted. But practical experiences have been shown that there is a strong influence of windowing on the extraction techniques. Therefore a ‘Monte Carlo” – analysis has been employed to study these effects.
Throughout the analysis to each set of time samples (Pt(1) and Pt(2)) a vector of normally distributed random numbers has been added. To the sets of vectors the extraction techniques have been employed. This procedure was repeated for the different vectors with arbitrary added random numbers. Here a saturation of the predicted values has been observed at a number of 128 cycles. Thus for each extraction technique 128 vectors of reflections coefficients upon frequency have been linear averaged. The concluding single number is an average of the reflection coefficient upon frequency values from 500 to 3000 Hz.
[image:6.595.194.432.302.431.2]In Figure 4 the logarithmic ratio of the single error number of the extraction techniques is shown (a positive value signifies that the error of the ‘Subtraction’-technique is larger than the error of the ‘PDS’-technique). For small deviations of ∆t(2) there is no significant discrepancy of the calculated errors. For higher values of ∆t(2) the error ratio increases. But for low values of the SNR the logarithmic ratio remains at small values. A variation of the difference between the direct and the reflected propagation path ∆r1 gave larger error values for the ‘PDS”-technique.
Figure 4:The calculated logarithmic ratio of the single error number occurring by the application of the ‘Subtraction’-technique related that of the ‘PDS’-technique
ratio=(20⋅log{ε[|R_subtraction(ω)|] / ε[|R_PDS(ω)|]}).
Input data: ε[|Pt(1)|]= ε[|Pt(2)|]=ε[|Arg(Pt(1)))|]= ε[|Arg(Pt(2))|]=1%, R(ω)=0.75.
CONCLUSION
In the examinations carried out the accuracy of the ‘PDS’-Technique in comparison to the ‘Subtraction’-technique has been studied.
It has pointed out that the bias error of the ‘Subtraction’-technique depends strong on the phase mismatch of both impulse responses. In contrast the accuracy of the ‘PDS’-technique is independent on the phase mismatch of both impulse responses. These results where confirmed by the results of a ‘Monte Carlo’-analysis. The random error analysis gave no significant deviation between the predicted errors for both methods. In general the function error upon frequency depends on the difference of direct and the reflected propagating path. Here a minimizing of the errors for a certain frequency range is imaginable.
REFERENCES
[Mom95] Mommertz, E.: Angle-Dependent In-situ Measurements of Reflection Coefficients Using a Subtraction Technique. Applied Acoustics 46 1995, S.251-263
[Boul97] Boulanger, P. and Waters-Fuller, T. and Attenborough, K. and Li, K. M.: Models and Measurements of sound propagation from a point source over mixed impedance ground. Journal of the Acoustical Society of America, 102 (3),1432-1442, 1997.
[Bol84] Bolton, J. S. and Gold, E.: The Application of Cepstral Techniques to the Measurement of the Transfer Functions and Acoustical Reflection Coefficients. Journal of Sound and Vibration, 93 (2), p. 217-233, 1984.
[Bendat78] Bendat, J. S. : Statistical errors in measurement of coherence functions and input/output quantities. Journal of Sound and Vibration, 59(3), p.405-421, 1978.
![Figure 3: The normalized random error input data: ε[|pt(1) �εεεετ �ε[ |R(ω)|] of both extraction techniques](https://thumb-us.123doks.com/thumbv2/123dok_es/5459596.111423/5.595.70.527.289.592/figure-normalized-random-error-input-eeeet-extraction-techniques.webp)
![Figure 4: The calculated logarithmic ratio of the single error number occurring by the application of the ‘Subtraction’-technique related that of the ‘PDS’-technique ratio=(20⋅log{ε[|R_subtraction(ω)|] / ε[|R_PDS(ω)|]})](https://thumb-us.123doks.com/thumbv2/123dok_es/5459596.111423/6.595.194.432.302.431/calculated-logarithmic-occurring-application-subtraction-technique-technique-subtraction.webp)
