RELATIONSHIP BETWEEN PHYSICAL AND PERCEPTUAL ATTRIBUTES
OF SOUNDS TRANSMITTED THROUGH A THIN GLASS PLATE
PACS Reference : 43.66.Lj
FAURE, Julien ; MARQUIS-FAVRE, Catherine
Laboratoire des Sciences de l’Habitat – D.G.C.B. URA CNRS 1652 Ecole Nationale des Travaux Publics de l’Etat
Rue Maurice Audin 69518 Vaulx-en-Velin France
Tel: +33.(0)4.72.04.70.31 Fax: +33.(0)4.72.04.70.41
E-mail: [email protected] and [email protected]
ABSTRACT
One of the main sources of noise pollution inside buildings comes from sounds transmitted through windows. Researches in physical acoustics have contributed to increase their sound transmission loss. Recent sound quality studies have shown that sound perception plays an important role in the assessment of the structure acoustic performances. This paper deals with the effect of a thin glass plate structural parameters variation on sound perception. The relation between the physical behavior of the structure and the perception of sounds transmitted are studied. Analysis is performed thanks to a sound perception test in which preference and perceived distances between sounds are judged. Thus the results will allow buildings acoustic comfort to be improved by increasing agreement of sounds transmitted through windows.
INTRODUCTION
The global increase in noise pollution brings the windows as one of the weak points of building envelope in terms of acoustic performances. Windows producers propose an important range of products with different acoustic performances due partly to their structural parameters values. The effects of these parameters on the vibroacoustical response of a simple glass plate is well-known and several indicators like sound transmission loss have been introduced to quantify their acoustical performances. However these indicators do not consider how sounds transmitted by the structure are perceived. The present paper aims at exploring the relation between the physical behavior of a single glass plate and the perceptual attributes of sounds it transmits. The influence of the precision of structural parameters values on perception are studied. This study can thus improve acoustic performances of this kind of structures by understanding and increasing agreement for sounds transmitted.
THE METHOD FRAMEWORK
The vibroacoustical response of the glass plate have been computed for several values of each studied parameter. The present paper deals with the study of the following parameters: thickness, Young’s modulus and structural damping of the plate. Only one parameter variation is considered at the same time. The “reference” plate, from which the variations of structural parameters have been done is a standard glass used in building industry. Its characteristics are given in table 1.
The glass plate, considered as simply supported, is embedded in an infinite baffle and radiates in a semi infinite field. It is excited by an oblique incidence plane wave with a white noise spectrum. The sound pressure level spectra are computed in two points corresponding to ears position of a human who is located in front of the plate. In addition, several acoustic and vibroacoustical indicators such as radiated power, sound transmission loss, quadratic velocity and radiation efficiency have also been calculated. The frequency step of the computation is equal to 2 Hz and the maximum limit frequency is equal to 16000 Hz. These values have been determined by a perceptual experiment based on differential threshold judgments. The sounds have been synthesized from the sound pressure level spectra using the Inverse Fourrier Transform method. They have been corrected by the Head Relative Transfer Function (Neutrik Cortex MK1) and the transfer function of the headphone (Sennheiser HD600) used for the restitution during the sound perception test.
The perception test takes place in a quiet room. Sounds are submitted by pair to 40 subjects between 22 and 45 years old. For each pair presented in random order, subjects are asked to give a dissimilarity judgment on a seven-point interval scale with verbal labels at the end points (from “0” to “6” respectively referred to as “very similar “ and “very different”). They are also asked to choose the sound they prefer. Subjects have been all trained with several representatives pairs submitted in the test. The test was separated in two parts of time duration inferior to 30 minutes each.
Width 0.4 m
Height 0.6 m
Thickness 4×10⁻³ m Young’s modulus 7×10¹⁰ Pa Structural damping 0.03 Density 2500 Kg/m3 Poisson’s ratio 0.22
[image:2.596.207.388.404.528.2]Boundary condition Simply supported Table 1. Reference plate characteristics.
For each parameter, an upper triangular dissimilarity matrix is built from the mean values of dissimilarity judgments. This matrix is then analyzed with Kruskal’s Multidimensional Scaling method [2] to obtain Euclidean distances between sounds. Stimuli can thus be represented in a multidimensional space in which axes represent attributes describing perceptual judgments. These attributes are evaluated by studying the correlation between the values of perceived distance (projected on the axes of the multidimensional space) and classical psychoacoustic metrics or physical indicators (dBA, SPL...).
Preference judgments are transformed in preference notes using the method of paired comparisons [3]. As for the perceived distance analysis, correlation between preference notes and indicators is investigated to explain preference judgments.
RESULTS
Structural Damping Variation
The studied values of structural damping çs have been chosen between 5 ×10⁻³ and 8×10⁻² which is the current range used for glass in material library of computation codes.
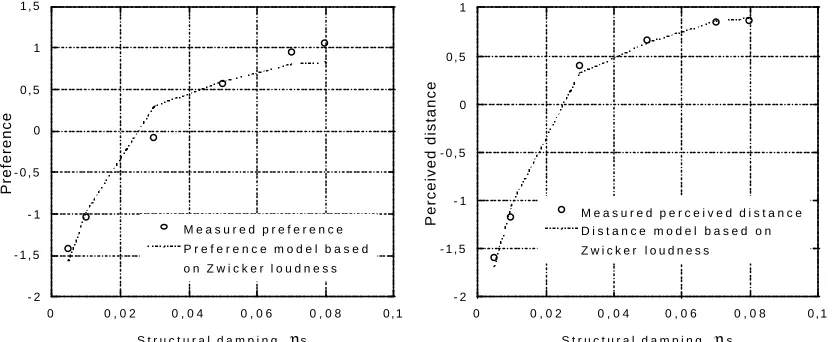
The analysis of the dissimilarity matrix in a two-dimensional space leads to the degeneracy of the Kruskal’s algorithm which results in a stimuli representation curve shaped as an arc of circle. This degeneracy means that the space has only one dimension, so perceived distances between sounds can be explained by only one perceptual attribute. The most correlated metrics with perceived distance is the Zwicker loudness (R=-0.997; p<10-5). Figure 1 shows the evolution of distance between sounds for structural damping variation. A model has been built using the correlation between distances and Zwicker loudness. One can observe that distance between sounds is not perceived as a linear function of structural damping values. Variation of çs at low values of structural damping has a greater effect on perception than at higher values. This shows the importance of structural damping accuracy especially at low values. Figure 2 represents preference notes versus structural damping variation. The observed tendency is the same as the one obtained for the perceived distance. Preference is also explained by the loudness variation. In the case of oblique incidence plane wave, structural damping variation leads to important variations of sound transmission loss. The latter increases with çs values (8 dB between the lowest and the highest values studied in this test). The loudness at the receiver points, and therefore the preference, are directly linked to this variation. For normal incident plane waves, the structural damping variation do not have a great effect on global sound transmission loss values. In this specific case, during a previous study [4], loudness variation at the receiver points has been noticed to be of the same order of magnitude as for this study. The same is observed for preference and perceived distance trends. Consequently, the sound transmission loss currently used to characterize building structures in not sufficient in the assessment of the acoustic comfort.
- 2 - 1 , 5 - 1 - 0 , 5 0 0 , 5 1 1 , 5
0 0 , 0 2 0 , 0 4 0 , 0 6 0 , 0 8 0 , 1
M e a s u r e d p r e f e r e n c e P r e f e r e n c e m o d e l b a s e d o n Z w i c k e r l o u d n e s s
Preference
S t r u c t u r a l d a m p i n g , ηs
- 2 - 1 , 5 - 1 - 0 , 5 0 0 , 5 1
0 0 , 0 2 0 , 0 4 0 , 0 6 0 , 0 8 0 , 1
M e a s u r e d p e r c e i v e d d i s t a n c e D i s t a n c e m o d e l b a s e d o n Z w i c k e r l o u d n e s s
Perceived distance
S t r u c t u r a l d a m p i n g , ηs
Figure 1. Perceived distance versus structural damping values.
Figure 2. Preference versus structural damping values.
Young’s Modulus Variation
[image:3.596.89.505.420.591.2]Dimension 1 Dimension 2 Sub.1 Sub.2 Sub.3 Sub.4 Sub.5 Sub.6 Sub.7 Sub.8 Sub.9 Sub.10
Sub.11 Sub.12
Sub.13 Sub.14 Sub.15 Sub.16 Sub.17 Sub.18 Sub.19 Sub.20 Sub.21 Sub.22 Sub.23 Sub.24 Sub.25 Sub.26 Sub.27 Sub.28 Sub.29 Sub.30 Sub.31 Sub.32 Sub.33 Sub.34 Sub.35 Sub.36 Sub.37 -1,0 -0,6 -0,2 0,2 0,6 1,0 1,4
-1,4 -1,0 -0,6 -0,2 0,2 0,6 1,0 1,4 1,8
Group 1
Group 2
Figure 3. Cluster of subjects for the answers of dissimilarity test on Young’s modulus variation.
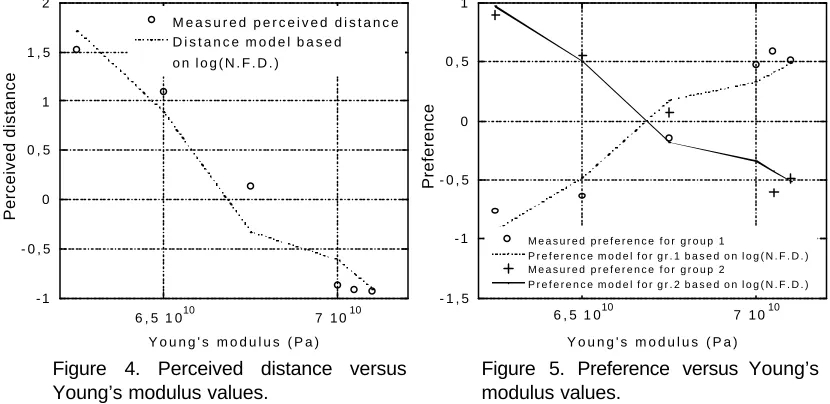
For perceived distance analysis, the mean dissimilarity matrix of all subjects has been scaled. The analysis has proved the existence of a single perceptual dimension. Figure 4 shows that the relation between perceived distances and Young’s modulus values is almost linear, so the precision on Young’s modulus has the same effect at low or at high values of this parameter. A metrics, called N.F.D. has been calculated to highlight the phenomena of resonant frequency shift due to the Young’s modulus and thickness variation. This metrics has already been used in precedent studies on steel plate [5]. The shift in frequency leads to tonality variations, but these variations are not enough important to be taken into account by the algorithm of tonality metrics computation [6]. Only the use of the N.F.D. metrics emphasizes the perception of the resonant frequency shift for the considered Young’s modulus variation.
Perceived distance between sounds is explained by the logarithm of the N.F.D. metrics (R=-0.96 ; p<0.0016). The logarithmic relation between perceived distance and N.F.D. has already been observed in the case of steel material [7]. The overall variation of global sound transmission loss is less than 1 dB. It leads to low loudness variation (7 sones between the maximum studied variation of Young’s modulus values) which is not sufficient to be used by subjects in their judgment.
- 1 - 0 , 5 0 0 , 5 1 1 , 5 2
6 , 5 1 010 7 1 010 M e a s u r e d p e r c e i v e d d i s t a n c e D i s t a n c e m o d e l b a s e d o n l o g ( N . F . D . )
Perceived distance
Y o u n g ' s m o d u l u s ( P a )
- 1 , 5 - 1 - 0 , 5 0 0 , 5 1
6 , 5 1 010 7 1 010 M e a s u r e d p r e f e r e n c e f o r g r o u p 1
P r e f e r e n c e m o d e l f o r g r . 1 b a s e d o n l o g ( N . F . D . ) M e a s u r e d p r e f e r e n c e f o r g r o u p 2
P r e f e r e n c e m o d e l f o r g r . 2 b a s e d o n l o g ( N . F . D . )
Preference
Y o u n g ' s m o d u l u s ( P a ) Figure 4. Perceived distance versus
Young’s modulus values.
Figure 5. Preference versus Young’s modulus values.
[image:4.596.161.432.86.250.2] [image:4.596.90.505.494.696.2]values of Young’s modulus (R=0.94 ; p<0.004). The second group prefers stimuli which sound more bass ( and thus low values of Young’s modulus (R=-0.97 ; p<0.002).
Even if two classes of subjects exist, results of perceived distance analysis and those of preference analysis are coherent. This dual tendency on preference results do not allow one to give some recommendations on the best value of Young’s modulus for conception of glass material for building structures. But nevertheless this study enables one to understand how the variation of Young’s modulus is perceived and what are the sounds characteristics used by subjects to identify this variation.
Thickness Variation
Studied values of thickness correspond to three standard European glasses values: 4.0×10⁻³, 5.0×10⁻³ and 6.0×10⁻³ m. The influence of tolerance of these thickness values on perception will be also investigated. The tolerance is equal to 0.2 millimeters for each of the three studied thicknesses. Thus 9 stimuli are considered: 3.8×10⁻³, 4.0×10⁻³, 4.2×10⁻³, 4.8×10⁻³, 5.0×10⁻³, 5.2×10⁻³, 5.8×10⁻³, 6.0×10⁻³ m and 6.2×10⁻³m.
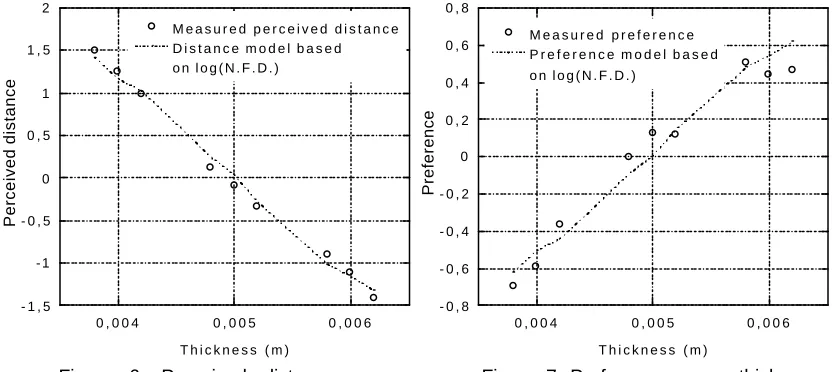
The analysis of dissimilarity matrix has proved the existence of one perceptual dimension. Figure 6 shows that distance is perceived as a linear relation of thickness. For each of the three values of standard thickness, the variation of 0.2 millimeters is perceived and stimuli are clearly differentiated by subjects. The dissimilarity judgments are explained by the variation of the logarithm of N.F.D. (R=0.99 ; p<10-5). The correlation coefficient between perceived distances and loudness values is only equal to 0.73. This result can be explained by the low overall loudness variation which is less than 20 sones for 9 different stimuli. The overall sound transmission loss variation is close to 7 dB. The relation between the global loudness range of sounds submitted to a perceptual test and the occurrence of loudness metrics to explain the perception has already been highlighted in a precedent study [7].
Preference notes plotted on Figure 7 show that subjects have preferred high thickness values, and this preference is also explained by the logarithm of N.F.D. variation.
These results show the importance of thickness precision on perceptual judgment. Perceived distance and preference notes are not explained by the loudness reduction as the latter is too small to be perceived, but they are explained by the shift in frequency of the plate resonant modes. The linear form of the preference and perceived distance charts means that the absolute error of 0.2×10⁻³ m induced by the tolerance is perceived in the same way at all standard thickness values, even if the relative error diminishes (i.e. a relative error of 5% at 4×10⁻³m corresponding to the tolerance has the same effect on perception as a relative error of 3.3% at 6×10⁻³m). A smaller tolerance of thickness for glass plate may allow more efficient products to be designed by controlling the agreement of sounds transmitted by the structure.
- 1 , 5 - 1 - 0 , 5 0 0 , 5 1 1 , 5 2
0 , 0 0 4 0 , 0 0 5 0 , 0 0 6 M e a s u r e d p e r c e i v e d d i s t a n c e D i s t a n c e m o d e l b a s e d o n l o g ( N . F . D . )
Perceived distance
T h i c k n e s s ( m )
- 0 , 8 - 0 , 6 - 0 , 4 - 0 , 2 0 0 , 2 0 , 4 0 , 6 0 , 8
0 , 0 0 4 0 , 0 0 5 0 , 0 0 6 M e a s u r e d p r e f e r e n c e
P r e f e r e n c e m o d e l b a s e d o n l o g ( N . F . D . )
Preference
T h i c k n e s s ( m ) Figure 6. Perceived distance versus
thickness values.
[image:5.596.90.508.538.724.2]CONCLUSIONS
Phenomena governing perception of sounds transmitted by the single glass plate according to the variation of structural parameters have been determined by the combination of physical and perceptual analyses. Each of the three studied parameters plays an important role on perception of sounds transmitted by the structure. As the structural damping increases, the reduction in loudness at the receiver points leads to an increase in preference expressed by subjects for the transmitted sounds, and this, whatever the variation of the sound transmission loss. For thickness and Young’s modulus, N.F.D. metrics calculated from physical observations seems to be an efficient metrics in its logarithmic form to predict perceived distance and preference notes. Young’s modulus differs from other parameters because of the existence of 2 groups of subjects with opposite judgments concerning the preference. However, even if no advice can be proposed, the study allows one to understand how Young’s modulus variation acts on perception. The thickness variation study has brought relevant information on the none negligible effect of the tolerance on sound perception. furthermore, it acts with the same effect at any value of the considered thicknesses.
These results show that simple glass structures can be improved by taking into account perception in the physical analysis and thus controlling the agreement of sounds transmitted by them.
ACKNOWLEDGEMENTS
The authors want to express their gratitude for the support provided by the A.D.E.M.E. (Agency for the Environment and Energy Resources)
REFERENCES
[1] P. SUSINI and S. McADAMS, "A multidimensional technique for sound quality assessment," ACUSTICA - acta acustica, vol. 85, 5, pp. 650-656, 1999.
[2] J. B. KRUSKAL, "Multidimensional scaling by optimizing goodness of fit to a nonmetric hypothesis," Psychometrika, vol. 29(2), pp. 1-27, 1964.
[3] L. L. THURSTONE, "The method of paired comparisons for social values," J. Abn. and Soc. Psychol., vol. 21, pp. 385-400, 1927.
[4] J. FAURE, C. MARQUIS-FAVRE, and S. VIOLLON, "Qualitative evaluation of sounds radiated from a steel plate: influence of mechanical and geometrical parameters," presented at Euronoise, Patras, Greece, 2001.
[5] C. MARQUIS-FAVRE and J. FAURE, "Coupling of quantitative and qualitative studies for the understanding of mechanical parameters variations influence: application to a radiating plate," presented at Euronoise, University of Patras, Greece, 2001.
[6] E. TERHARDT, G. STOLL, and M. SEEWANN, "Algorithm for extraction of pitch and pitch salience from complex tonal signals," Journal of Acoustical Society of America, vol. 71(3), pp. 679-688, 1982.