This is the published version of a paper published in
Letters in spatial and resource sciences
.
Citation for the original published paper (version of record):
Lundberg, J. (2017)
On cartel detection and Moran’s
I
.
Letters in spatial and resource sciences
, 10(1): 129-139
https://doi.org/10.1007/s12076-016-0176-4
Access to the published version may require subscription.
N.B. When citing this work, cite the original published paper.
Permanent link to this version:
DOI 10.1007/s12076-016-0176-4
O R I G I NA L PA P E R
On cartel detection and Moran’s
I
Johan Lundberg1
Received: 10 January 2016 / Accepted: 28 July 2016 / Published online: 6 August 2016 © The Author(s) 2016. This article is published with open access at Springerlink.com
Abstract This paper explores the potential of using the Moran’sI statistic to detect complementary bidding on public contracts. The test is applied to data concerning the so-called Swedish asphalt cartel, which was discovered in 2001. Using information on submitted bids and procurement characteristics for both the cartel period (1995–2001) and the post-cartel period (2003–2009), the Moran’sIcorrectly predicts complemen-tary bidding behavior for linear and quadratic specifications when such behavior is likely to exist, and rejects such behavior when it’s unlikely to be present. Remarkably, the Moran’sI also correctly indicates and rejects complementary bidding on the basis of information on the separate bids alone.
Keywords Antitrust·Auction·Cartel and collusion·Complementary bidding· Public procurement·Spatial econometrics
JEL Classification D44·H57·L10·L40
1 Introduction
The detection of cartels and collusive bidding behavior for public contracts has received increasing attention in the economics literature during recent decades, seeBajari and Summers(2002) andHarrington(2008). One reason for this is that competition lies at the very core of economics. Another reason is that cartels and collusive behavior among firms lead to higher prices, which is bad for private consumers and makes the issue of
B
Johan Lundbergjohan.lundberg@econ.umu.se
1 Department of Economics, Umeå School of Business and Economics, Umeå University, Umeå,
cartel detection highly relevant from a policy perspective. For instanceConnor(2004) found the median increase in price attributable to collusion to be around 25 %. Even though cartels and collusive bidding behavior are illegal, they exist and attempts to coordinate price-setting and production volumes are often effective. Antitrust author-ities (and sometimes competing firms and private consumers) do their best to find and report suspicious behavior, but cartels are often difficult to detect.Harrington(2008) suggests that one should start by looking at markets characterized by few rivals and homogenous products, but there are many markets with exactly those characteristics. Other indicators to look for are suspicious patterns of behavior such as direct evi-dence of communication via illicit meetings and messages, or patterns in prices and quantities that indirectly reveal collusion.
This study lies within the last of these traditions, which Harrington further divides into tests based on four questions: 1. Does the actual behavior differ significantly from that which should follow from competitive behavior? 2. Is there a structural break in behavior that could, for example, mark the formation or demise of a cartel? 3. Does the behavior of a set of firms that are suspected to have formed a cartel differ from that of other firms? 4. Does a collusion model better describe the available data than a competitive model? The method described herein is based on the third kind.
The main purpose of this paper is to illustrate how the Moran’sItest statistic can be used to test for potential collusive bidding behavior (complementary bidding among cartel members) on public contracts. The test builds on the work ofMoran(1948) and was generalized byCliff and Ord(1972) in order to derive a test for spatial correlation in linear regression models; it has since become probably the most frequently used test for spatial correlation.1The main advantage of the proposed method lies in its simplicity and comparatively modest data requirements, which make it suitable for use by organi-zations such as antitrust authorities as a fairly simple way of screening large numbers of different markets and procurements for potentially suspicious bidding behavior.2It’s low data requirement is of importance as the collection of complementary information (besides the separate bids) from procurements is costly, time consuming and in some cases almost impossible.3The test is applied to data relating to the so-called Swedish asphalt cartel, which was detected in 2001, and the analysis presented here comple-ments that ofBergman et al.(2015), who apply a spatial lag regression approach on the same data set to verify the cartel’s existence.4It should be noted that while methods
1 Burridge(1980) demonstrated that the Moran’sI test statistic is equivalent to a Lagrange multiplier
test statistic derived from a linear regression model without a spatial lag. Its large sample properties and asymptotics have been analyzed byPinkse(1999) andKeleijan and Prucha(2001). See alsoAnselin(1988, chapter 8). For an introduction to spatial econometrics in general, see the seminal work ofAnselin(1988).
2 Abrantes-Metz et al.(2006) propose an alternative screening method based on price movements before
and after the collapse of a bid-rigging conspiracy. Using a data set covering the retail gasoline industry in Louisville, U.S.A., they found that the average price decreased by 16 % after the collapse, while the standard deviation of the prices increased by over 200 %.
3 An ideal method would enable cartel detection based on the bids alone.
4 Heijnen et al.(2015) also use spatial econometric tools to screen for local cartels. In their analysis of
such as those proposed herein can be used to obtain evidencesuggestiveof collusion or cartel activity, we would be the first to acknowledge that additional evidence and other forms of proof would be required to support any kind of legal action.5
The rest of this paper is organized as follows: a brief review of the asphalt cartel’s history along with a description of the data set used and the Moran’s I statistic are given in Sect.2. This section also contains the very important definition of the elements of the spatial weights matrix.6The results are presented and discussed in Sect.3, and concluding comments are given in the final section.
2 The data and Moran’s
I
2.1 The data
As the entity responsible for the Swedish road transport system, including road build-ing, operation and maintenance, the Swedish Road Administration (SRA) is a frequent buyer of road pavement and pavement repair services. Following the general princi-ples for public procurement within the EU, it allocates its contracts using competitive bidding, typically in the form of first-price sealed-bid auctions. During the period for which we have data (1995–2009), the SRA was organized into seven autonomous districts, each of which was responsible for road maintenance and for organizing pro-curement auctions relating to road maintenance activities within its geographical area of responsibility. The districts’ responsibilities included designing calls for tenders, specifying the conditions of the auctions, drawing up the contracts, and evaluating the bids.7
On October 24, 2001, the Swedish Competition Authority (SCA) conducted unan-nounced raids on a number of companies in the Swedish asphalt paving industry. The purpose of these raids, which continued for two days, was to find documents that could verify suspicions of illegal collusive bidding on public contracts, including com-munications between the firms. The resulting trials at the Stockholm District Court lasted over 40 days. In 2003, nine firms were convicted of collusive bidding. The con-victed firms appealed against the decision at the Market Court, which confirmed the District Court’s decision. On July 10, 2007, the court ordered the nine companies to pay overe133 million in fines. Documentation provided by theSCA(2009) suggests that the cartel began operating in 1993 and that non-winning firms were compensated for not bidding or for submitting fake bids, i.e. engaging in complementary bidding.
5 SeeBaker and Bresnahan(2008),Harrington(2008), andAbrantes-Metz and Bajari(2009) for a
discus-sion of why econometric evidence must be accompanied by additional evidence and other kinds of proof to be usable in court. This is also discussed byHeijnen et al.(2015).
6 As pointed out by one referee, a more appropriate name in our context would be a bidding matrix. 7 The seven autonomous districts were the North (encompassing the counties of Norrbotten and
The definition of the elements in the bidding matrix defined below is based on this information.8
The data set used in our analysis was compiled from procurement documents held by the SRA. On the basis of these documents, the court order, and interviews with investigators and analysts at the SCA, the data were divided into two subsets, one relating to the period when the cartel was active (1995–2001) and the second relating to the post-cartel period (2004–2009). As it is possible that the companies under investigation did not directly realize the seriousness of the charges before the first court order in 2003, data from 2002 and 2003 are excluded.9Because combinatorial bidding strategies are substantially more complex than those used in standard auctions, auctions with combinatorial bids are excluded.
In total, the data set contains information on 233 procurements involving 429 con-tracts and 2130 bids submitted by 58 individual firms. The key variable,bi,c, is the bid
placed by firmi on contractcper square meters of paving at the 2009 price level, in SEK.10,11The data set also contains information on the type of procurement proce-dure applied (direct, negotiated, restricted, open, simplified, informal, or unknown), the size of the contract measured in square meters of asphalt(Ar eac), the population
density of the regionr in which the contract was procured(Densr), the number of
bidders on each separate contract(Compc), and region-, year-, and company-
spe-cific fixed effects. These variables are assumed to reflect differences inbi,cresulting
from variation in procurement procedures, economies of scale, production costs,12 market structure, and regional-, annual-, and company-specific effects, respectively. Descriptive statistics forbi,c,Comp,Ar ea, andDensare presented in Table1below.
The average contract size differs quite substantially between the two periods, as does the population density. This is because several larger projects were procured during the cartel period, leading to differences in the average bids,bi,c, andAr eabetween
the two periods. The difference in population density is explained by the fact that during the post-cartel period, no procurements using the standard auction procedure were conducted in the Stockholm region, which is the most densely populated part of Sweden (see Table2below).
8 Documentation provided by theSCA(2009) suggests that the cartel members met regularly to allocate
the coming year’s contracts and coordinate bidding within their geographical areas. Other firms were com-pensated for not bidding or for submitting fake bids (complementary bidding) by being granted profitable subcontracts, free services, or direct monetary transfers. Eventually, the cartel expanded to include almost every firm operating in the market.
9 This approach was discussed with SCA officials, who agreed that it is reasonable to exclude 2002 and
2003.
10 Ideally, the bids would be measured in tons. However, the information needed for conversion into units
of mass is not available. Because we only consider procurements of relatively non-complex asphalt and paving works (only surfacing), we believe this to be a minor problem.
11 In 2009, EUR 1 was approximately SEK 10.62 and USD 1 was SEK 7.65.
12 In Sweden, the more densely populated areas are also smaller in geographical terms. During the period
Table 1 Descriptive statistics
Mean SD Min. Max.
Whole period
bi,c 1629.8 7683.4 6.19 92,161.5
Comp 5.42 1.50 1 10
Ar ea 52,486 48,129 9630 154,311
Dens 64.52 62.42 3.29 196.9
Observations 2130 Contracts 429
Cartel period 1995–2001
bi,c 1717.2 8036.8 12.1 92,161.5
Comp 5.61 1.47 1 10
Ar ea 42,376 39,473 9,630 154,312
Dens 72.28 63.47 3.30 196.9
Observations 1830 Contracts 353
Post cartel period 2004–2009
bi,c 1096.8 4991.6 6.19 39,300
Comp 4.25 1.07 1 7
Ar ea 114,161 50,202 11,027 154,312
Dens 17.23 22.12 3.29 108.76
Observations 300 Contracts 76
Table 2 Descriptive statistics
Share per procurement type
1995–2001 2004–2009
Dir ect 0.004 0.040
N egoti ated 0.012 0.000
Restr i cted 0.009 0.000
O pen 0.189 0.027
Si mpli f i ed 0.739 0.933
I n f or mal 0.007 0.000
U nknown 0.032 0.000
Share per region
1995–2001 2004–2009
Regi on1 (North) 0.094 0.540
Regi on2 (Middle) 0.004 0.153
Regi on3 (Stockholm) 0.198 0.000
Regi on4 (Mälardalen) 0.180 0.030
Regi on5 (West) 0.298 0.200
Regi on6 (Southeast) 0.122 0.053
2.2 Moran’sI
The Moran’s I test can either be applied directly onbi,c or on the residuals from a
regression equation such asbi,c=α+βxi,c+εi,c. If the latter approach is adopted,
the statistic becomes conditional on other potentially important determinants ofbi,c.
Suppose one wishes to apply the test directly onbi,c. Assume two types of bidders,
AandB, where type Abidders engage in collusive bidding behavior (i.e. they form a cartel) and type B bidders do not. Define a matrixWof dimension(n×n)with elements wi c,j c such that wiAc,jAc > 0, wiBc,jBc = wi∗c,i∗c = 0 for all i = j.
Hence,wi c,j c >0 when bothiand j are typeAfirms bidding on the same contract,
otherwisewi c,j c =0. Assume the simplest possible bidding strategy among type A
firms, whereby only one typeAbidder places a low bid on a specific contractcwhile the rest of typeAbidders engage in complementary bidding and place high bids. The use of this strategy by the actual cartel was suggested in the court order from 2003 and confirmed in the court order from 2007. To test for complementary bidding among the cartel members, if firmiAis the cartel member who places the lowest bid on contract c, thenwiAc,jAc=0.13
When applying this test,Wis usually row-standardized, so each row-sum ofW equals 1. The Moran’sIstatistic is then calculated as
I =
i
j
wi c,j c
bi,c−μ bj,c−μ
× 1
i
bi,c−μ
2 (1)
wherebi,candbj,care bids placed by firmsiandjon contractcwith meanμ. The test
statistic is compared to its theoretical mean,E(I)= −1/ (n−1), whereE(I)→0 asn→ ∞. The null hypothesisH0:I = −1/ (n−1)is tested against the alternative
Ha:I = −1/ (n−1).
IfH0is rejected, then there are two alternative interpretations depending on whether
the test statistic I is significantly higher or lower than its expected value. If H0 is
rejected andI >−1/ (n−1), a positive spatial correlation is indicated, meaning that typeAfirms (other than the one that places the lowest bid) place more similar bids on a specific contract than would be expected by chance alone. Their bidding behavior is thus consistent with complementary bidding. IfH0is rejected andI <−1/ (n−1),
a negative spatial correlation is indicated—that is, type Afirms place a mixture of high and low bids on the same contract. Because the test statistic is compared to its theoretical mean, inference is often based on thez-statistic
z= [I−E(I)]
SD(I) (2)
where S D(I)is the theoretical standard deviation of I.14 If z > |1.98|, I differs significantly from−1/ (n−1)at the 95 or a positive spatial correlation.
13 The definition of the elements in the bidding matrix is based on documentation from theSCA(2009),
the court order, and interviews with investigators and analysts at the SCA.
Table 3 Model specifications
bi,c ln
bi,c
ols1 ols2 ols3 ols4 ols5 ols6
Linear Y N Y Y Y Y Y N
Log-linear N Y N N N N N Y
Procurement procedure specific effects
N N N Y Y Y Y Y
Firm specific effects N N N N Y Y Y Y
Regional specific effects
N N N N N Y Y Y
Time specific effects N N N N N N Y Y
3 Results
The results presented in Table2below are based on the pure bids,bi,c, ln
bi,c
,and the residuals from OLS regressions of different specifications of
bi,c =α+βComp×Compc+βDens×Densr +βAr ea×Ar eac
+αp+αt+αr +αf +εi cr (3)
where theα’s andβ’s are parameters to be estimated, andεis the error term. The
αp are procurement-specific characteristic dummy variables for direct, negotiated,
restricted, open, simplified, informal and unknown procurement procedures; theαtare
year dummy variables (to capture time trends), theαr are regional dummy variables
(to capture region-specific characteristics), andαf are firm-specific fixed effects (to
capture cost differences across firms).
The different specifications of Eq. (3), denoted bi,c, ln
bi,c
, and ols1–ols6 are explained in Table3below. For instance, ols1 is a linear specification whereαp =
αt =αr =αf =0. That is, no procurement-, time-, regional-, or firm specific effects
are included, only the explanatory variablesComp,Dens, andAr ea.15In ols2,Comp, Dens, and Ar eaare included together with procurement-specific effects, and ols6 is a log-linear specification with procurement-, firm-, region-, and year-specific fixed effects.16
15 Even though we only present values of the Moran’s Istatistic based on the residuals for 6 different
specifications of Eq. (3) here, we have performed the test for all possible combinations of procurement, time, year, and firm-specific effects. The results, which are available from the authors on request, do not differ from those presented in the paper.
16 The variableCompis potentially endogenous, making the parameter estimate ofβCompin Eq. (3)
Table 4 Moran’sIstatistics
Model specification Moran’sI
Cartel period 1995–2001 Post-cartel period 2004–2009
bi,c 1.326 (37.444) 0.038 (0.393)
ln(bi,c) 1.104 (30.575) 0.714 (6.317)
ols1 1.325 (37.396) 0.063 (0.628)
ols2 1.325 (37.413) 0.066 (0.654)
ols3 1.331 (37.549) 0.050 (0.496)
ols4 1.313 (37.006) 0.052 (0.516)
ols5 1.314 (37.021) 0.050 (0.492)
ols6 0.941 (26.067) 0.850 (7.515)
z-Statistics within parenthesis
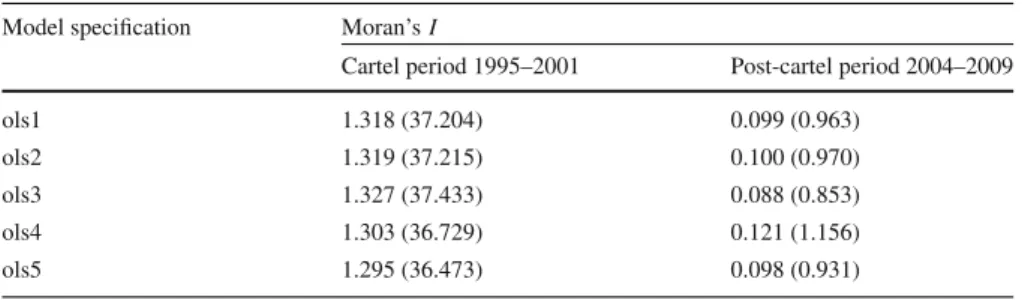
Table 5 Moran’sIstatistics based on residuals from a quadratic specification
Model specification Moran’sI
Cartel period 1995–2001 Post-cartel period 2004–2009
ols1 1.318 (37.204) 0.099 (0.963)
ols2 1.319 (37.215) 0.100 (0.970)
ols3 1.327 (37.433) 0.088 (0.853)
ols4 1.303 (36.729) 0.121 (1.156)
ols5 1.295 (36.473) 0.098 (0.931)
z-Statistics within parenthesis
The Moran’sIstatistics for different specifications of Eq. (3) are displayed in Table 4below. The main result is that the Moran’s I based on the bidding matrix defined above correctly identifies a significant correlation between bids placed by type A bidders (i.e. cartel members) during the period when the cartel was active, and rejects such correlations for the later period when such behavior is unlikely to have occurred. This result is consistent with complementary bidding and holds for tests based directly on the bids,bi,c, and for tests based on the residuals,ε, i.e. tests that are conditional on
the other explanatory variables. However, this result is only true for linear models and not for log-linear specifications of Eq. (3). When based on a log-linear specification, the Moran’sIstatistic indicates complementary bidding among former cartel members even when such behavior is unlikely to exist.
Table 5 displays Moran’s I statistics and corresponding z-values based on the residuals from different specifications of
bi,c =α+βComp×Compc+βDens×Densr +βAr ea×Ar eac
+βComp2 ×Comp2c+βDens2×Densr2+βAr ea2×Ar eac2
Equation (4) is in some respects less restrictive than a logarithmic specification. The Moran’sIvalues based on the residuals from five different specifications are displayed in Table5below. For all specifications, the Moran’sIcorrectly indicates complemen-tary bidding behavior during the cartel period and rejects such bidding behavior for the post-cartel period.
The main conclusion from the results presented in Tables4and5is that the Moran’s I correctly predicts complementary bidding behavior for linear and quadratic spec-ifications when such behavior is likely to exist, and rejects such behavior when it’s unlikely to be present. The Moran’sIalso correctly indicates and rejects complemen-tary bidding based on information on the separate bids alone.
3.1 How can this technique be applied when the cartel’s identity is unknown?
While the ability to detect complementary bidding among known cartel members is interesting, the method may also be useful to antitrust authorities looking to screen many different markets and procurements for suspicious bidding behavior in cases where the identities of the potential cartel members are unknown. From a practical point of view, the crucial issue is to reduce the number of likely combinations of firms to be defined as cartel members. For instance, given a market with a total of 10 firms, there are 1013 unique combinations of cartel members and hence 1013 differentW. If on top of these combinations we introduce temporal sequencing of bids (which greatly complicates the analysis), the number of different bidding matrices and the number of Moran’s I tests to be conducted will increase rapidly. Thus, while it is (at least in theory) possible to run the test using all possible combinations of definitions of the elements in the bidding matrix, it is not practical or realistic for antitrust authorities to do so. It is therefore preferable to take advantage of some prior information/knowledge or assumptions about potential cartel members and their bidding strategy.17Therefore, we outline a four step procedure (the third step of which can be omitted if temporal sequencing of bids is disregarded) for reducing the set of combinations of colluding firms and the number of potential bidding strategies within the cartel:
1. Define potential cartel members as the 3 or 4 firms on the market with the highest turnover or the 3 or 4 most frequent bidders. The focus on the largest firms and/or the most frequent bidders is motivated by the fact that if they collude, they will most likely cause more substantial harm to the functioning of a market than would occur in the event of collusion between small firms that bid on few contracts only. We thus argue that an antitrust authority with scarce resources should focus on large firms that place bids on a large proportion of contracts.
2. ConstructWbased on all possible combinations of these 3 or 4 firms assuming complementary bidding and that either all firms in the cartel have equal bargaining power or that their bargaining power is a function of their relative turnover or bid-ding frequency. Then calculate Moran’sIbased onband, if additional information
17 Prior assumptions regarding bidding strategies is also assumed in previous papers on collusion screens
is available,ε. This reduces the number of unique combinations with at least two firms involved in the cartel to 11.
3. ConstructWbased on the above procedure with temporal sequencing of bids and compute Moran’sI based on bothbandε.
4. If indications of collusive bidding are found, dig deeper into this market to find accompanying evidence. Otherwise, continue to the next market.
This will dramatically reduce the number of alternative definitions ofWand hence the number of Moran’sI calculations.
4 Concluding remarks
We have evaluated the capacity of the Moran’sI test for spatial correlation to serve as a tool for detecting potential complementary bidding behavior on public contracts. The test was applied to bids submitted by the so-called Swedish asphalt cartel, which was active during the 1990s. Based on data from procurements conducted during the cartel’s period of activity and after its detection in 2001, the Moran’s I correctly indicates complementary bidding behavior when such behavior is likely to be present and rejects such behavior when it’s less likely to exist. On the basis of the results presented herein and our proposed 4 step procedure, we argue that the Moran’s I test statistic may be used as a first indicator of complementary bidding behavior by organizations such as national antitrust authorities. Its main advantage is its relative simplicity and low data requirements. However, we readily acknowledge that much more evidence than just a significant Moran’sI value would be required to support legal proceedings.
Open Access This article is distributed under the terms of the Creative Commons Attribution 4.0 Interna-tional License (http://creativecommons.org/licenses/by/4.0/), which permits unrestricted use, distribution, and reproduction in any medium, provided you give appropriate credit to the original author(s) and the source, provide a link to the Creative Commons license, and indicate if changes were made.
References
Abrantes-Metz, R.M., Bajari, P.: Screens for conspiracies and their multiple applications. Antitrust24(1), 66–71 (2009)
Abrantes-Metz, R.M., Froeb, L.M., Geweke, J.F., Taylor, C.T.: A variance screen for collusion. Int. J. Ind. Org.24(3), 467–486 (2006)
Anselin, L.: Spatial Econometrics: Methods and Models. Kluwer Academic Publishers, Dordrecht (1988) Baker, J., Bresnahan, T.F.: Economic evidence in antitrust: defining markets and measuring market power. In: Buccirossi, P. (ed.) Handbook of Antitrust Economics, vol. 1, pp. 1–42. MIT Press, Cambridge, London (2008)
Bajari, P., Summers, G.: Detecting collusion in procurement auctions. Antitrust Law J.70(1), 143–170 (2002)
Bergman, A.M., Lundberg, J., Lundberg, S., Stake, J.Y.: Using spatial econometrics to test for collusive behavior in procurement auction data. Umeå Economic Studies, No. 917 (2015). doi:10.2139/ssrn. 2696895
Burridge, P.: On the cliff-ord test for spatial correlation. J. R. Stat. Soc. B42, 107–108 (1980)
Connor, J.M.: How high do cartels raise prices? Implications for reform of the antitrust sentencing guidelines. In: Working paper 04-01, American Antitrust Institute (2004)
Harrington, J.E.: Detecting cartels. In: Buccirossi, P. (ed.) Handbook of Antitrust Economics, vol. 1, pp. 213–258. MIT Press, Cambridge, London (2008)
Heijnen, P., Haan, M.A., Soetevent, A.R.: Screening for collusion: a spatial statistics approach. J. Econ. Geogr.15(2), 417–448 (2015)
Keleijan, H.H., Prucha, I.R.: On the asymptotic distribution of the MoranItest statistic with applications. J. Econ.104, 219–257 (2001)
Moran, P.: The interpretation on statistical maps. J. R. Stat. Soc. B10, 243–251 (1948)
Pinkse, J.: Asymptotic Properties of Moran and Related Tests and Testing for Spatial Correlation in Probit Models. University of British Columbia and University College, Department of Economics, London (1999)