Assessing water pricing policies to enhance water efficiency in agriculture
22
0
0
Texto completo
(2) Giannoccaro, Prosperi, Zanni. method,. in. which. each. user. is. charged. development of this technique is proposed by. proportionally to water consumption.. Korhonen and Luptacik (Korhonen and Luptacik,. The economic concept underlying this approach is. 2004), in which the DEA is used to measure the. that perfect competitive markets of goods and. ecological efficiency of decision making units that. resources are capable of achieving the most. is, the ratio between multiple outputs and multiple. efficient allocation of resources, since the price. externalities caused by the production process. In. works as an indicator of scarcity. The drawback of. other words, the ecological efficiency represents. this approach is that in the real world there are. an indicator of the pressure of the firm on the. several market failures hindering the perfect. environment.. allocation of water resources. Among the most. From the methodological point of view, a. relevant causes of market failures, it is worth. full. mentioning the fact that water resources are. performed with traditional policy evaluation. public goods (with ill-defined property rights), and. analysis (e.g. Cost-Effectiveness Analysis, Cost-. water services are often managed under natural. Benefit Analysis). However, in the specific context. monopoly conditions (Dosi and Easter, 1994). In. of the WFD, Messner (2006) argues for the. addition, water uses cause negative externalities. homogeneity assumption regarding measurement. (e.g. pollution of water bodies, salinization and. effects and their costs and for the existence of. depletion of groundwater). Consequently, the. multiple water-related benefits and objectives as. analysis of the technical efficiency may provide a. limitations for the CEA. In particular, two main. valuable source of information in the process of. limitations of the CEA approach have been. water policy design.. pointed out in this respect: i) the need for all. assessment. of. policy effects. is. usually. Contrarily to the analysis of the economic. outcomes to be expressed in monetary units. efficiency, which measures the irrigator and water. (water management typically involves many non-. distributor losses caused by any disturbance of the. market factors that are not easy to assess); and ii). competitive. efficiency. the difficulty of achieving a fair distribution of. evaluates how different decision making units. resources among stakeholders (Hajkowicz and. (e.g. firms, departments, sellers) are able to. Higgins, 2008). Furthermore, CEA and CBA. allocate inputs to generate one or more outputs. provide useful information on the profitability of. and, therefore, how far they are from the. the policy, but do not take into account of the. production frontier. In the case of a single output. efficiency. and a single input, the technical efficiency consists. management, is one of the most relevant. on the ratio between the two, while in the case of. objectives of the policy (as stated by the EU Water. multiple outputs and inputs a more sophisticated. Framework Directive).. market,. the. technical. method is required. To this purpose, the Data Envelopment. Analysis. is. a. Therefore,. in. the. the. DEA. case. of. water. represents. an. flexible. alternative and complementary policy assessment. technique which has been developed to calculate. tool, since it is an objective and rigorous method,. the ratio between the weighted sums of multiple. which does not require prior assumptions on. outputs and multiple inputs (the ratio between. input and output prices (Coelli et al., 1998;. the so-called virtual output and virtual input). Sengupta, 1999)1. This is an advantage, since. (Charnes et al. 1978; Cooper et al. 2000). Further. administrative tariffs are applied to public goods. Ambientalia SPI(2010). (DEA). which,. 2.
(3) Giannoccaro, Prosperi, Zanni. (e.g. water). In fact, monetary methods require. second, the representative of the stakeholders of. weights to evaluate the relative social value of. the agricultural sector (farmers’ associations),. inputs and outputs of the policy (criteria), which. which are the main players affected by the policy. are difficult to be evaluated (Tyteca, 1996).. reform, may be more interested to economic gains. Therefore,. this. paper. proposes. a. deriving from efficient resources allocation. In this. methodology in which the effects of different. case, input and output are referred to the private. water pricing schemes are simulated on a group. domain. The information to public decision maker. of farms, and the DEA is applied to measure the. and to stakeholders is intended to facilitate the. different performances of firms operating under. public debate and negotiation process, based on. different water policy regimes. Analysis on. scientific evidence.. simulated policy scenarios have been proposed by. In the specific context of this paper, a two-. Bono and Matranga (2005) and Musolino and. step DEA has been applied to evaluate the. Rindone (2009). In our case, the efficiency. technical efficiency to a group of farms operating. depends on the capacity of producing output. under. from input (technical efficiency) and also the. particular, the objective is to verify whether, as. production of output and externalities (ecological. stated by the economic theory, volumetric water. efficiency). The paper deals with two aspects of. pricing schemes are always the most efficient,. the efficiency. The first, the technical efficiency,. compared to indirect pricing schemes (e.g. input,. depends on the optimal allocation of the resource. output, area). The hypothesis we challenge in this. to the most profitable crops (ceteris paribus). The. paper is that, the unavoidable market failures. second, the ecological efficiency, considers the. affecting the allocation of water resources in. externalities caused by the irrigated crops on the. agriculture already mentioned above, may flatten. environment,. groundwater. the differences between volumetric and indirect. depletion and pollution. In both cases, the water. pricing schemes. In fact, according to our findings,. pricing scheme will be preferred if it induces an. we found that the gain of efficiency due to the. increase of output, or the reduction of the. introduction of the volumetric pricing does exist,. externality, by consuming the same volume of. but they are rather limited or absent, if compared. water. Alternatively, the policy is preferred if the. to indirect pricing schemes.. and. particularly. same output or externality is produced, with less water.. different. water. pricing. schemes.. In. The study is based on the simulation of the effects of the water pricing reform on farms. The analysis may be applied in order to. located in the watershed of the Candelaro river. follow two different perspectives: public and. located in the province of Foggia (Italy), by a. private approaches. In the first, the public decision. territorial linear programming model. In order to. maker may be interested in evaluating whether. estimate the efficiency of the policy, a comparison. the policy produces some social benefit from an. of the direct pricing scheme with indirect pricing. efficient allocation of resources (including water),. schemes (input, output, and area) is performed.. with. (e.g.. Public and private perspectives of the efficiency. economic growth or externality reduction) and. are compared, in order to consider the point of. minimum cost or external effects. Input and. view of regulators and farmers, which are. maximum. production. of. output. output are referred to the public domain. In the. Ambientalia SPI(2010). 3.
(4) Giannoccaro, Prosperi, Zanni. involved in the negotiation process of the water. costs. pricing reform.. impoundment, storage, treatment and distribution. of. water. services. (abstraction,. In the next paragraph, an overview of. of surface water or groundwater, waste water. pricing policy concepts and the characteristics of. collection and treatment facilities) and specifically. the most diffused water pricing methods are. include environmental and resource costs. This. described. In paragraph 3, the methodology for. implies that water pricing has to be seen and used. measuring the relative efficiency of alternative. within the frame of the environmental objectives. water pricing policy based on a two step DEA is. of the WFD.. proposed. Paragraph 4 deals with the empirical. The economic theory suggests coherently. case of study, that is based on the comparison of. with the WFD approach, that the most suitable. the efficiency of volumetric pricing methods, with. water pricing scheme is represented by direct. indirect pricing methods (input, output, and area),. pricing methods, based on volumetric methods. In. and a quota system, in the province of Foggia. this way, users will pay proportionally to their. (Italy). In paragraph 5, the results are shown,. consumption, and a certain degree of fairness. while paragraph 6 closes with some concluding. among users is also pursued. The drawback of this. remarks and discussions.. approach is that the externalities (either positive or negative) of irrigation are not always taken into. 2. WATER PRICING POLICY OPTIONS. account. In fact, crops may lead to different environmental impacts that are not always related. The idea of managing water resources. with water use. In a similar manner environmental. through water pricing dates back several decades,. benefits occur with irrigation (Goméz-Limón,. but in 1992 the Dublin International Conference. 2006), and generally the return of water flow. on Water and the Environment proposed that the. downstream is related to water use.. management of the water source as an economic. In addition, it is claimed that by direct water. good may lead to an efficient and equitable use. charging, the signal of the scarcity of the water. and effective to encourage the conservation and. resource is directly and effectively conveyed to. protection of water resources. In addition, the Rio. farmers, who are supposed to promptly react by. Declaration. the. adopting a water saving technology (Tsur and. Development of the United Nations in 1992. Dinar, 1995, p.21). Empirical evidence, however,. mentions the legitimacy of an economic analysis. shows that technology choice is hardly driven by. and. water price. It is mainly determined by structural. on. the. economic. Environment. tools. to. and. support. the. implementation of regulatory measures (Molle. factors,. and Berkoff, 2007a).. constraints (see Molle and Berkoff, 2007b), as well. Water pricing is seen in the WFD as an. agronomic. conditions. and. financial. as crop choice (Varela-Ortega et al. 1998).. efficient system for natural resources management. Numerous obstacles hinder progress in. in general and specifically for water management.. implementing volumetric rates. Among them, the. It is seen as a way to ‘internalize’ costs and it. fact that it may not be efficient to do so under a. reflects scarcity in resources that lack of a proper. broad range of realistic situations. A relevant. market. The directive obliges Member States to. obstacle for its application in many European. take into account the principle of recovery of the. irrigation districts is the lack of appropriate water. Ambientalia SPI(2010). 4.
(5) Giannoccaro, Prosperi, Zanni. metering devices. Yet, volumetric systems are. water pricing policies are related to surface water. costly and not suitable for monitoring natural. under. water sources (e.g. groundwater, streams, natural. groundwater may account locally for 100% of. reservoirs, etc.). Work done by Tsur and Dinar. irrigation. The majority of countries do not. (1997) illustrates how the efficiency gains may not. consider any form of ‘eco-tax’ for groundwater, or. justify the costs of restructuring tariffs.. any kind of economic instrument in areas with. Therefore, in order to comply with these. public. schemes,. but. the. use. of. local aquifers at risk of over-exploitation.. aspects, some other alternative pricing methods. After it came into force a decade ago,. may offer some advantages, such as requiring. progress in the implementation of the WFD is. lower management costs, being easily monitored,. reported in a working document elaborated by. or suitable for pricing diffused natural water. the European Commission (CEC, 2007)2. The. sources. The comparison of pricing methods. conclusion of the document highlights both. adopted in different countries in terms of. positive and negatives results, and as a whole. efficiency, equity and water quality management. progress “…has been made 'Towards Sustainable. is already documented in the literature (Tsur and. Water Management in the European Union'.. Dinar, 1995; Dinar and Subramanian, 1997;. However, there is still a long and challenging road. Johansson et al., 2002). In general, it is pointed. ahead” (CEC, 2007). Based on the literature, the pricing. out that the implementation of volumetric pricing is complicated (Burt, 2007) while per area pricing. scheme. is easier. Other pricing schemes, such as output or. considered in this research are as follows:. input. relatively. a) per area pricing: water fees are proportional to. Subramanian,. the irrigated farmland, regardless of the actual. and. tiered. complicated. schemes. (Dinar. are. and. alternatives. to. volumetric. pricing,. several. demand of water. This method can be easily. European countries are shown in Berbel et al.. implemented, and could be managed and. (2007). They review the irrigation pricing policies. monitored through GIS systems. However, it. that were in place in a selection of European. shows some shortcomings, in terms of fairness, as. countries before the WFD was adopted in 2000. A. water consuming crops are considered similarly to. variety. water saving crops, and also farmers do not have. 1997).Irrigation. of. water. charges. legislative. in. and. institutional. arrangements across European members emerge.. any incentive to adopt water-saving technologies;. Agricultural water tariffs are quite heterogeneous. b) input pricing: water charges are estimated as a. across countries, regions and even within regions.. proportion of the cost of the. Tariff structures apply almost exclusively to surface. irrigated crop (e.g. seeds, plants, mulching. water and they rarely reflect relative water. materials, etc.). To a certain extent, this method is. scarcity,. coherent with the principle that in most cases. which. depends. on. complex. geographical, technical and institutional factors.. intensive. Fixed per hectare tariffs are predominant in. externalities and, therefore, it is coherent with the. Southern European countries, mostly in districts. polluter pays principle;. supplied. publicly. c) output pricing: in this case the cost of water. volumetric. consumption is calculated from the output of. charges prevail in northern countries. Most of the. irrigated crops. It is relatively fair, but may not. developed. with. surface. water. infrastructure,. Ambientalia SPI(2010). from. while. crops. are. also. specific input of. responsible. for. 5.
(6) Giannoccaro, Prosperi, Zanni. induce farmers to choose the most profitable use. using pulp and three other inputs in order to. of water;. produce paper and four pollutants. In their. d) quota: in addition, the pricing schemes are. research they assumed weak disposability of. compared with the quota method, since it is more. undesirable outputs. Their results showed that the. popular among policy makers. According to this. performance rankings of DMUs turned out to be. method, farmers have the right to use an amount. very sensitive, whether or not undesirable outputs. of water which depends on historical records (the. were included.. so-called prior-appropriation water rights). These. However, the emphasis on the ecological. amounts could be modified by the ruling. issue. authority, but since in most of cases it does not. externalities have been treated as undesirable. require the payment of any relevant fees, it enjoys. outputs of the production process. Tyteca (1996). a wider consensus among farmers. In some other. presents an exhaustive literature review, and. cases, farmers are allowed to make the best use of. found that the DEA is frequently used to measure. a limited amount of water resource, for which. the efficiency of decision units, such as firms,. they pay a discounted tariff. The drawback of this. industrial. method is that by applying tariffs that are lower. (Glass et al., 2006; Bono and Matranga, 2005;. than the marginal productivity, it usually induces. Korhonen e Luptacik, 2004).. farmers to an inefficient use of the water resource.. In this paper, we adopt the modified two steps. In this paper it is assumed that the farmers detain. DEA, as first proposed by Korhonen and Luptacik. full information and decision making is rational, in. (Korhonen and Luptacik, 2004, 437-446), in order. the sense of maximizing the value function, under. to measure the technical and ecological efficiency. a set of technical and economic constraints. The. of. application of different water pricing schemes are. methodology allows the calculation of relative. supposed to affect farmers’ behaviour in terms of. efficiency and, consequently, the ranking of the. resource availability (technical constraints), or. most efficient policies, considering the technical. resource price (economic signal for scarcity), and. and the ecological aspects.. in both cases farmers will pursue the optimal. Luptacik (2004) propose to measure the eco-. allocation of the resource. Finally, it is assumed. efficiency of 24 power plants in Europe in two. that the transaction costs of the policy option. different ways. In the first approach, they measure. implementation are negligible.. the eco-efficiency in two steps. First, technical. has. occurred. plants,. different. later,. and. governmental. water. pricing. generally. departments. policies.. Korhonen. This. and. In this context, it is expected that different. efficiency and the so-called ecological efficiency. pricing schemes induce different technical and. are estimated separately. Then, the results of both. ecological efficiencies of irrigated farms.. models are taken as the output variables for the new DEA model (with the inputs equal to 1),. 3. METHODOLOGY. which provides the indicator for eco-efficiency. In the second approach, they attempt to build up a. The first attempt to compare the multiple. ratio that simultaneously takes into account the. performance of firms in terms of desirable and. desirable and undesirable outputs. The authors. undesirable outputs is reported in Fare et al.. found that both approaches (i.e., separate and. (1989), in which a data set of 30 US paper mills. simultaneous) achieve almost the same result in. Ambientalia SPI(2010). 6.
(7) Giannoccaro, Prosperi, Zanni. terms of finding the most efficient plants,. parameters that can be fed into the mathematical. although the ranking for all power plants is. model, in order to evaluate the impact on. slightly different.. agricultural system according to the different. In this research the first approach is. pricing policy scenarios.. adopted, where the comparison of the eco-. On the basis of existing studies, paying. efficiency is made among the performances of the. special attention to the OECD report (OECD,. local irrigated farms, under different water pricing. 2001), and Berbel and Gutierrez (2005, pp. 52-55),. hypotheses. Both efficiency measures reveal the. a series of indicators has been selected. Indicators. actual contribution of the water pricing reform to. express the impact per hectare of used farmland,. the enhancement of water use efficiency, as. and according to the simulated cropping pattern. stated by the Water Framework Directive.. (different crops exert different impacts), they result. In order to compare the relative efficiency. in the impact on the agricultural system.. of n water pricing schemes, the analysis is. The most obvious indicators are those. performed on data derived from the simulation of. pertaining to the consumption of water and. the effects of the policy. There are two reasons. indicators of the economics of farming. For latter. justifying this approach. Firstly, by working on. concept, it should be considered the firm. simulated data, the interferences on the efficiency. perspective (that is, farm revenue), as well as the. due to other factors than the water policy are. public perspective, taking into account the value. avoided, and therefore the measure of the relative. added of agricultural system. Further indicators. efficiency is truly referred to the policy reform.. are related to the environmental issues. In. Secondly, it is hard to finding reliable data of. particular, we select the fertilizer and pesticide. similar irrigated agricultural systems. National and. impacts of cropping patterns (non-point pollution. regional regulations will often affect farming. caused by nitrogen fertilization and pest control).. cropping schemes, and farming cropping systems. Water conservation (i.e. water saved) is seen as a. or local constraints may exert a strong impact,. positive environmental externality3.. regardless of the water pricing scheme. The simulation of the effects of different water pricing policy is made through a multi-. The values of these variables are the outcomes of the agricultural system and will be used later in the DEA.. agent regional linear programming model (Tisdell,. The model is based on the assumption of. 2001; Berbel and Gutierrez, 2005; Giannoccaro et. the maximization of the regional agricultural net. al., 2008; 2009). This sort of mathematical. revenue (NR), in accordance with the following. programming model is applied in order to. equation:. simulate farmers’ decision making, in terms of cropping patterns and the allocation of irrigation. Max NR = Σj λj {Σi xi,j [qi pi – Σz (ci,z vi,z) – mlsi,j ]–WCj–. water. The decision variables of the model are the. Fixj+SFPj}. crops’ activity levels (i.e. crop areas), which. s.t.. determine the utilization of production inputs. Σi (xi,j ts,i ) ≤ Ts,j : seasonal occupation of the. including water. In addition, environmental data. land use necessary to the cultivation of the xi. on pollutants emitted by the agricultural practices. cropped area, constrained by the overall farmland. are also estimated.We estimate a number of. availability T in each season s, for the j farm type;. Ambientalia SPI(2010). (1). 7.
(8) Giannoccaro, Prosperi, Zanni. Σb ai,b) ≤ Wb,j : water specific. In particular, the volumetric pricing is. consumption a (cubic metres per hectare) for the. modelled considering a water charge that is. crop i, constrained by the water availability W for. proportional to the water consumption: WCV = Σi. the b water source type and the j farm type;. Σb (xIi ai,b wi,b ), where ai,b and wi,b are the technical. Σi (xi,j. Σi (xj,i lc,i ) ≤ Lc,s,j : labour type c (hours of. coefficients. referring. to. the. specific. water. labour) required by the i crop during season s,. consumption (cubic metre per hectare of the. constrained by the farm endowment L (hour of. irrigated area xIi) from the b source type (e.g.. labour per year),. different block, in the increasing block tariff method applied by the CBC, or ground water),. where: λj : weight of the j farm type (number of farms);. subject to w tariff or extraction cost (EUR/ cubic. xi,j : cropped area (hectares) devoted to the. metre). The superscript I denotes the irrigated. cultivation of the i crop by the j farm type;. crops included in the set of all the possible crops i.. ts,i : seasonal farmland use (hectares per season). In the case of input pricing, the water cost is. required to cultivate the i crop, during the season. proportional to the sum of all variable costs that. s;. are specific for irrigation crops: WCI = αIi Σz (xIi,j cIi,z. Ts,j : total farmland availability (hectares), referred. vIi,z ), where α is an empirical parameter4, while cI. to the s season and the j farm type;. and vI refer to technical coefficients and related. qi , pi : yield (tons) and market price (EUR), of the. prices of input that are specifically related to. produce of the i crop;. irrigate crops (e.g. material propagation, such as. mlsi,j : differential competitive margin, due to the. seeds or bulbs, disposable irrigators, fertirrigation,. different technology (yields and input) and market. pesticides and herbicides).. prices of the i crop for the j farm type. Similarly, output pricing considers the water cost. (EUR/hectare);. as the proportion of the total value of product. ci,z , vi,z : amount of the z variable technical input. obtained by the irrigated crops: WC O = Σi αOi (xIi. (kg per cropped area), and its related market price. qi pi ). (EUR);. Area pricing is calculated by applying a. Fixj : fixed running costs of the j farm (EUR/farm),. tariff to the area devoted to irrigated crops:. including. WCA = αA Σi xIi. insurance,. maintenance. and. depreciation of equipment and building, tax. Finally, the quota system is modelled by reducing. SFPj : the single farm payment under the CAP. quota allotments per hectares according to the. regime (EUR/farm);. water rights of each farm type. This is included in. WCj : cost for irrigation water, faced by the j farm. the model by reducing the parameter Wb,j in the. (EUR). constraint: Σi (xi,j ai,b) ≤ (Wb,j) The above economic model has been. Simulations are performed by changing the. adapted in order to simulate different water. water pricing scheme, affecting the level of pricing. pricing. different. and the water availability allocated to each farm. specification of the water cost (WC) faced by each. type. From the data simulation of each policy, the. farm type.. agricultural system variables are selected and. schemes,. Ambientalia SPI(2010). according. to. 8.
(9) Giannoccaro, Prosperi, Zanni. categorised as inputs, desirable outputs, and. new DEA model (with the inputs equal to 1), in. undesirable outputs.. order to find an indicator for eco-efficiency.. The two steps DEA are performed on the pay-off matrix obtained. The first step for calculating the relative technical efficiency is performed by the traditional DEA, where the. 4. CASE STUDY 4.1 Area description. technical efficiency of the policy '0' (h0). This model is also named “Frontier Economics”, and consists of a linear programming model through which the (positive) weights to be applied to outputs (μr) and inputs (νi) are estimated, in order to find a ratio of output on inputs that ranges from 0 to 1: Max h0 = (. ∑. ∑. Italy within the Capitanata Board (CBC) system that covers a surface of 442,000 ha and a population of less than 500 thousand people living in 39 municipalities (ISTAT, 2001). The irrigation board is located within the Apulia region,. k r =1. μr yr ) / ( 0. ∑. m. i =1. vi yi ) (2) 0. s.t. (. The Candelaro river is located in southern. r =1. μr yr ) / ( j. ∑. m. i =1. area. with. fluctuating. precipitation and increasing man-made pressures. The yearly average of rainfall is 500-700 mm, there are also recurrent periods of drought. In. vi yi ) <= 1, j = 1,2,…,n j. addition, water management issues include, water allocation among sectors (i.e. agriculture, industry and urban) water quality, and, in many areas, groundwater overdraft.. ε >0 (Non-Archimedean) The. second. step. consists. of. the. measurement of the ecological efficiency (g0), through the calculation of the weights to be applied to the desirable outputs (μr) and the undesirable outputs (μs). This model is also denominated “Deep Ecology” (Korhonen and Luptacik, 2004): Max g0 = (. ∑. k r =1. μr yr ) / ( 0. ∑. p. s =k +1. Water supply for irrigation campaigns lasts from April to November, and every year the system. conveys. catchment. r =1. μr yrj) / (. ∑. s =k +1. million. of. m3. systems.. Apart. from. the. water. source serving the agriculture, estimated to cover about 60% of the overall irrigation water (INEA,. μs ys ) (3) 0. 2005). irrigation. p. 106. conveyed by the CBC, groundwater is the other. The k. about. accumulated in autumn and winter in the. s.t.. ∑. semi-arid. mostly concentrated in autumn and winter, but k. μr , νi => ε , r=1,2,…,k ; i=1,2,…,m. (. a. μs ysj) <= 1, j = 1,2,…,n. infrastructure board. consists. managed of. a. by. network. the of. underground pipelines, through which highpressure water is conveyed to final distribution. μr => ε , r=1,2,…,p. points, from which farmers may directly attach. ε >0 (Non-Archimedean). systems). The water supply is available on. Then it is possible to combine the results of both models as the output variables for the. their. devices. (e.g.. sprinklers,. drip irrigation. demand. At present, water is allocated through a system of water rights. In most cases, water rights are based. Ambientalia SPI(2010). 9.
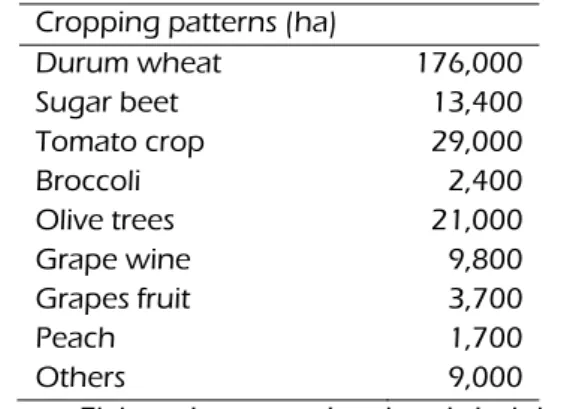
(10) Giannoccaro, Prosperi, Zanni. on the historical use of the resource by the. (Consorzio per la Bonifica della Capitanata, CBC),. farmers. Farmers are not allowed to exchange. referred to year 2006.. their water use rights, although the use of water is indirectly. transferred. through. the. lease. of. farmland. In the case of water shortages, water is diverted from irrigation to industry and municipal uses, with no compensation given for farmers’ loss in revenue. The types of agricultural systems found in the area are mainly, rain fed cereals, basically durum wheat amounting to 61% of UAA (CCIAA, 2007). A single crop system based on durum wheat is farmed in most of area where water is unavailable. Depending on water availability, vegetable and orchard crops (which are irrigated crops) are highly profitable, compared to wheat. Among. them,. processed. tomato. (4%). and. vineyard (7%) are the major profitable crops. In addition, irrigated agriculture consists of the fresh vegetable crops, representing important cash crops for the region, covering 9% of area. Finally, the olive grove systems for olive oil production cover almost 12% of the area. Olive grove is a Mediterranean crop with a strong capacity to adapt to water scarcity and is a partially irrigated crop, according to water availability. Some descriptive data are reported on Table 1. Table 1: Main crops data of the case study Cropping patterns (ha) Durum wheat 176,000 Sugar beet 13,400 Tomato crop 29,000 Broccoli 2,400 Olive trees 21,000 Grape wine 9,800 Grapes fruit 3,700 Peach 1,700 Others 9,000 Source: Elaboration on national statistical data (ISTAT) and Capitanata Irrigation Board. 4.2. Data modelling Farms were classified into three main groups according to farm size and cropping patterns. According to the ISTAT (2001) data, farms are conducted by elderly farmers (40% of whom are over 65 years old), and labour is provided by the farming family (in 95% of cases). The major difference between farms types concerns labour. In small farms, the labour is provided by the farmer’s family members, while in the case of large farms, it is provided by hired workers. The three types of farms also differ in terms of the “single farm payment” under the current CAP regulation. In addition, there are some relevant differences among the crops (such as yields, prices, and input uses), which have been included in the model. Although irrigation technology varies across crops, it is almost the same across the farms operating in the area. Drip irrigation is the dominant technique, for irrigated crops, while durum what is always rain fed. The technical coefficients consider the agronomic rotations typically adopted by the farmers in the area. Input and output prices are based on the average (2004-2007) local market prices (Bulletin of the Chamber of Commerce). The size of each farm is fixed. Demand and supply constraints (agronomic operations, input availability, permanent crop area, and CAP framework) reflect the current farms’ features. The resource constraint for water is specified to accommodate the water delivery schedule from the CBC, which distributes some 106,000,000 m3 between April and November. In the case of the non-CBC water source, there are constraints with regard to delivery, and availability. Ambientalia SPI(2010). 10.
(11) Giannoccaro, Prosperi, Zanni. is estimated at 89,000,000 m3 at the most. The. authorities. In fact, a reform to control the. latter is particularly fragile and it is currently. excessive exploitation of natural resources leading. monitored and controlled very little by water. to. irreversible. Table 2: Variables for measuring input, output and externalities Conventional Resources Input Land Unit of measurement. Labor. 3. 10 hectares. 3. 10 hours. Output Farmer’s Revenue Value added. Capital Water 106 euro. 106 m3. 106 euro. 106 euro. Environmental Externalities Desirable outputs Water saving Unit of measurement. Undesirable outputs Pesticides risk. 106 m3. 103 Kg. environmental degradation started in 20085. The. variables. of. input,. output. Nitrate surplus 106 t. Finally, as pointed out by Korhonen and and. Luptacik (2004), positive externalities can also be. externalities derived from the optimal solution. included as desirable environmental outputs.. representing the current situation (baseline) is. Taking into account the most sensitive water. shown on (Table 2).. problem for the area study on groundwater. Pesticides and fertilisers impacts represent. depletion, water saving is referring to the amount. the environmental undesirable outputs. Pesticide. of groundwater saved from agriculture system. risk is estimated by combining information about. under different pricing options.. a pesticide’s toxicity and exposure to that pesticide, with information about pesticides use. 4.3 Water policy scenarios. (OECD, 2001, pg. 149). Nitrate surplus is the physical difference between nitrogen inputs and. Simulations are made to consider both the. outputs from an agricultural system, per hectare of. effects of the pricing scheme and the level of the. agricultural land (OECD, 2001, pg. 20). All. price charge, in order to consider the effects of the. nitrogen put into cultivated soil is considered to. enforcement. be input, while that embedded into the harvested. considered in the analysis are presented on Table. production is considered as output.. 3.. of. the. WFD.. The. scenarios. For the purposes of this research, data on pesticides risk and nitrate surplus are from. Table 3: Structure of the water pricing policy. Giannoccaro et al. (2009). For the case study,. simulations. values are referred to each crop (per hectare of farmland). on. the. basis. of. technical. and. agronomical farming practices typically adopted by farmers in the area.. Ambientalia SPI(2010). Pricing scheme. Price charge Current. Baselin 1a.Baselin e e. Moderate Significant increase increase 1b.Baseline +. 11.
(12) Giannoccaro, Prosperi, Zanni. Tot_Vo 2a.Tot_Vol 2b.Tot_Vol+ 2c.Tot_Vol+ l + Area 3a.Area 3b.Area+ -. tariffs, while a volume tariff is also applied to. Input 4a.Input Output 5a.Output Quota 6a.Quota. efficiency is expected;. 4b.Input+ 5b.Output+ 6b.Quota+ 6c.Quota++. groundwater. In this case, the rise of the eco2b.Tot_Vol+: a moderate increase in water tariffs is assumed for both pressure and natural source water. Consequently, farmers are expected. As follows, a brief description of the main features of each scenario is provided. 1a.Baseline: the current situation refers to a. to make a more efficient use of both water sources, leading to an increase in the technical and the eco-efficiency;. situation in which the pressure water distributed. 2c.Tot_Vol++: a significant increase in water. by the water irrigation board is charged according. tariffs is applied, closer to its marginal product. to increasing block tariffs, while the water from. value. According to the WFD, this will lead to a. other sources (non-CBC) is free of charge,. higher efficiency. However, from the farmers’. although farmers have to face the burden for. point of view, this implies an excess of burden. pumping the water and pressuring into their. and, therefore, a reduction in terms of technical. irrigation systems. Water pricing currently consists. efficiency;. of a fixed annual fee per hectare (around 15. 3a.Area: volume pricing is substituted by a. EUR/ha), and Increasing Block Tariffs. Two tariffs,. fixed charge per hectare of irrigated land,. respectively 0.09 EUR/m3 for consumption up to. regardless of the consumption of water. This. 2,050 m3/ha, and 0.18 EUR/m3 from 950 m3/ha,. scheme is easier to be implemented, but is. and 0.24 EUR/m3 are applied. A third tariff, 0.24. supposed to negatively affect the technical. EUR/m3, is applied in the case of exceeding 3,000. efficiency. Eco-efficiency may increase, as there is a. m3/ha. In the case of non-CBC water, farmers are. loss of incentive among farmers to overuse water. assumed to carry only the private cost (0.09. from natural sources;. EUR/m3) of lifting, accumulating, and pressuring. 3b.Area+: similar to the above, but by. water. In this case a high technical efficiency is. applying a higher tariff. No further effects are. expected, but with a low eco-efficiency, since. expected on the efficiency, in respect to the above. farmers tend to overuse natural water sources;. pricing scheme;. 1b.Baseline+: it is assumed a moderate. 4a.Input: the water tariff is proportional to. increase of water tariffs on the pressure water. the specific costs for the inputs of irrigated crops.. distributed by the irrigation board, consequently. Since the input for intensive irrigated crops are. to the full cost recovery principle of the WFD.. also responsible for environmental pollution, this. According to the economic theory, the rise of the. pricing scheme is expected to raise the eco-. input price leads to an increase in the technical. efficiency;. efficiency on the pressure water, while the. 4b.Input+: similarly to the above scenario, a. pressure on natural water sources is unchanged.. further increase of the water tariff is supposed to. However, farmers try to substitute pressured. pursue a higher eco-efficiency;. water with groundwater; 2a.Tot_Vol: similarly to the baseline, the. 5a.Output: the water tariff is proportional to the value for agricultural sale of irrigated crops.. pressure water is charged with increasing block Ambientalia SPI(2010). 12.
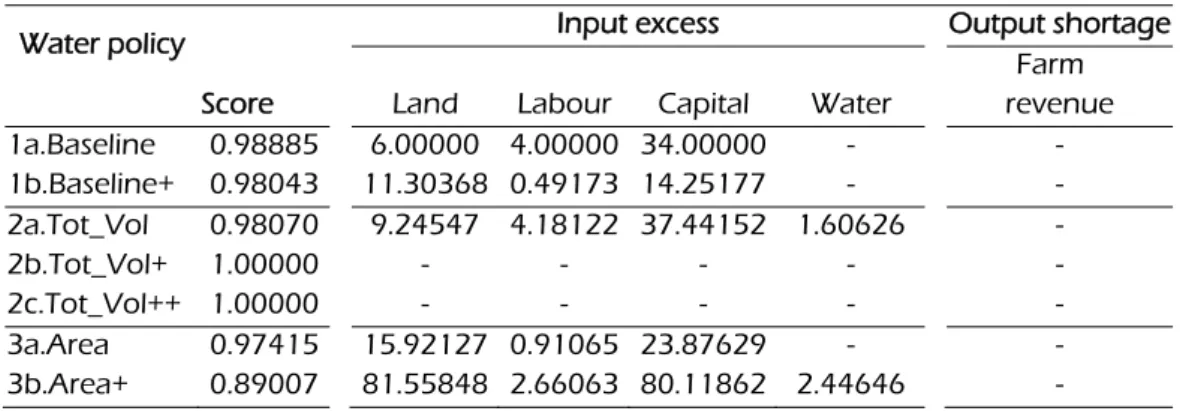
(13) Giannoccaro, Prosperi, Zanni. Although this method seems more equitable, it is. model (see the appendix). The outcome of each. supposed to lead to a lower technical efficiency;. water pricing policy is represented by the basic. 5b.Output+: similar to the above scenario,. production inputs (land, labour, capital, and water. an increase in the water tariff is supposed to lead. use), the most relevant economic indicators. to a higher efficiency. However, an excess of. (farmers’ revenue and value added), the desirable. water charges may produce the opposite effect;. environmental output (groundwater saving), and. 6a.Quota: the tool to control the water. the undesirable environmental output (pesticides. consumption is not relying on water price, but. risk, nitrates surplus).. relies on the enforcement of rigid constraints on. The analysis of the efficiency consists of the. the water availability to each farm. A relatively. ranking. lower water charge is applied and, farmers are still. performance of the regional agricultural system. expected to achieve a higher technical efficiency.. under different water pricing policy. In the case of. The rigid control also on natural sources is. efficient policy, the score is equal to 1, while on. expected to lead to a higher eco-efficiency;. the contrary, in presence of inefficiency, this score. of. the. relative. efficiency. of. the. 6b.Quota+: similar to the above, but with a. is lower than 1. In order to disclose the cause of. moderate reduction in terms of water availability. the inefficiency, the DEA provides the assessment. to each farm. The reduction of water availability is. of the residual slack, in terms of input excess or. expected to increase the technical efficiency;. output shortage. This concept is related to DEA,. 6c.Quota++: similar to the pricing scheme. and refers to the problem arising because of the. 5.a, but with a significant reduction of the water. section of the DEA frontier which runs parallel to. availability. The higher efficiency due to the lower. the axes.6 In other words, the values of each slack. availability may be offset by the lower profitability. are the explanation of the reason for policy. of farming.. inefficiency. First,. 5. RESULTS AND DISCUSSION. we. analyse. technical. efficiency. accounting for farmers and sector perspectives separately. In Tables 4 and 5, the results of the DEA are shown.. The starting point for the DEA is the pay-off matrix resulting from the optimal solutions of the simulations found by the linear programming. Table 4: Score of the technical efficiency and DEA slack (private perspective) Input excess. Water policy Score 1a.Baseline 0.98885 1b.Baseline+ 0.98043 2a.Tot_Vol 0.98070 2b.Tot_Vol+ 1.00000 2c.Tot_Vol++ 1.00000 3a.Area 0.97415 3b.Area+ 0.89007 Ambientalia SPI(2010). Land 6.00000 11.30368 9.24547 15.92127 81.55848. Labour 4.00000 0.49173 4.18122 0.91065 2.66063. Capital Water 34.00000 14.25177 37.44152 1.60626 23.87629 80.11862 2.44646. Output shortage Farm revenue -. 13.
(14) Giannoccaro, Prosperi, Zanni. 4a.Input 4b.Input+ 5a.Output 5b.Output+ 6a.Quota 6b.Quota+ 6c.Quota+. 1.00000 0.99671 0.99176 0.88979 0.98885 0.98949 1.00000. 58.69852 3.24547 75.29489 6.00000 4.43420 -. 0.05931 2.18122 2.20428 4.00000 4.01062 -. 6.28995 10.98023 14.44152 1.60626 76.44316 33.26524 34.00000 30.56915 -. -. The first step of the DEA (Frontier Economics) shows differences in the policy efficiency. This. In the case of output pricing, the efficiency loss. proves that changes in water pricing policies. occurs only in the case of a higher pricing level,. induce farmers to adopt different farm strategies. due to an overuse of capital and water. In this. and thus different farm performances.. case, the efficiency seems related with finding the. At farm level analysis, total of 4 options out of the 14 simulated are the relatively most. most suitable pricing level. This concept may be extended to the Quota schemes.. efficient. Average efficiency value is 0.97648, and. As a whole, technical efficiency under both. minimum value is 0.88979 for 5b.Output+ policy. approaches reaches a good score, showing on. option. This means that, in order to be efficient,. average 97.6% of efficiency.. policy. From a comparative analysis between the two. 5b.Output+,. should. induce. a. lower. consumption of all inputs by 11.026%.. different perspectives, emerges that only 4 options. A similar result is found taking into account. are the most efficient under both approaches (2b,. overall agricultural system (Table 5). In this case 8. 2c, 4a, 6c). The efficiency score for the overall. policy scenarios are efficient, showing that the. agricultural system marks more policy options as. current pricing policy is already efficient. The. best efficient. Anyway, similar average efficiency. 2a.Tot_vol scheme is efficient, but it shows a slack. value is reached, even if the lowest value is found. for the capital value amounts to EUR 2 million.. for the sector perspective analysis.. Lowest efficiency score is found for the area. Spearman rank correlation coefficient (R), which is. pricing (3b), while sample reaches 0.97641,. adopted to determine the measure of association. average efficiency.. between. Through analysis of the slacks, results show. ranks. obtained. by. two. different. approaches, is used in the present study (Gibbons,. also that in all cases, the area pricing is less. 1971). When the Spearman R. efficient, as it induces an excess use of all inputs.. values, respectively, of1, 0 and -1,. values assumes. Table 5: Score of the technical efficiency and DEA slack (public perspective). Ambientalia SPI(2010). 14.
(15) Giannoccaro, Prosperi, Zanni. Input excess. Water policy. 1a.Baseline 1b.Baseline+ 2a.Tot_Vol 2b.Tot_Vol+ 2c.Tot_Vol++ 3a.Area 3b.Area+ 4a.Input 4b.Input+ 5a.Output 5b.Output+ 6a.Quota 6b.Quota+ 6c.Quota++. Score Land Labour Capital Water 1.00000 0.99907 0.67157 8.29872 2.00000 1.00000* 1.00000 1.00000 14.89516 8.33871 0.97670 13.53024 0.84152 92.48726 1.85350 69.63694 27.78344 1.00000 1.00000 1.00000 0.85261 87.26115 1.50318 66.94268 58.43949 1.00000 0.99981 0.29679 0.19898 1.00000 *Weak efficiency, according to the slack value. Output shortage Value Added -. it means perfect association, no association and perfect disagreement respectively between the approaches. The result of non parametric test was. only. 0.786, indicating high association value, but not at. 2c.Vol_tot++, 4a.Input). Average efficiency value is. all in all cases.. 0.93736, and minimum value is 0.84890 for. for. 3. policy. options. (2b.Vol_tot+,. According to the results of this analysis, it is. Output+ policy option. Current pricing policy. not proved that the implementation of the. (1a.Baseline) is not best efficient, meaning that. volumetric pricing will necessarily lead to a higher. there is opportunity to improve environmental. efficiency, in comparison to other methods. The. efficiency through a water pricing reform.. application of quota to a direct water allocation to. The findings for the agricultural system. farmers as well as indirect pricing method on the. stress that eco-efficiency reaches the best value for. irrigation inputs also represents a valid alternative. 4 out of the 14 options analysed. According to the. to direct water pricing.. Table. In addition, the enforcement of higher pricing. 2c.Vol_tot++), as well as indirect pricing options. does not increase the efficiency, but it rather. (4a.Input, 5a.Output), are relatively more efficient.. induces a substitution of the water source with. Lowest efficiency score is found for the area. other inputs (land, labour, and capital).. pricing (3b.Area+) that covers 0.795257 efficiency. The second step of DEA is reported in the Table 6 and 7. Following the previous analysis on. 7. direct. water. pricing. (2b.Vol_tot+,. value. The average value for all sample accounts for. 0.95257. efficiency. level.. the technical efficiency, the eco-efficiency from the farmer’s point of view, reaches the highest value Table 6: Score of the ecological efficiency and DEA slack (private perspective) Water policy. Ambientalia SPI(2010). Undesirable Output excess. Desirable Output shortage. 15.
(16) Giannoccaro, Prosperi, Zanni. 1a.Baseline 1b.Baseline+ 2a.Tot_Vol 2b.Tot_Vol+ 2c.Tot_Vol++ 3a.Area 3b.Area+ 4a.Input 4b.Input+ 5a.Output 5b.Output+ 6a.Quota 6b.Quota+ 6c.Quota++. Score 0.93103 0.87392 0.92337 1.00000 1.00000 0.93410 0.85338 1.00000 0.96559 0.99176 0.84890 0.93103 0.92797 0.94205. Nitrate surplus 1.57447 0.35783 -. Pesticide Risk 30.91193 26.50041 32.80082 104.15638 146.08511 80.94321 111.88889 83.92843 30.91193 28.66749 23.74486. Water Saving revenue 38.46831 71.42305 42.74609 36.75720 45.36170 13.11975 4.27778 68.12766 38.46831 40.17942 31.21193. Farm. -. Table 7: Score of the ecological efficiency and DEA slack (public perspective) Undesirable Output excess. Water policy Score 1a.Baseline 0.98875 1b.Baseline+ 0.92747 2a.Tot_Vol 0.98875 2b.Tot_Vol+ 1.00000 2c.Tot_Vol++ 1.00000 3a.Area 0.92893 3b.Area+ 0.79891 4a.Input 1.00000 4b.Input+ 0.93986 5a.Output 1.00000 5b.Output+ 0.81170 6a.Quota 0.98875 6b.Quota+ 0.98329 6c.Quota++ 0.97954. Nitrate surplus -. Comparative analysis between the two. Pesticide Risk 16.37509 16.79870 16.37509 103.68646 98.61538 81.04852 65.00000 16.37509 15.09269 15.05214. Desirable Output shortage Water Value Saving Added 9.92469 88.48443 9.92469 63.86604 65.84615 83.76923 43.63505 84.00000 59.00000 9.92469 16.88487 20.62274 -. level, even if the lowest value is found at. different perspectives, points out that only 3. agricultural. options are best efficient under both approaches. correlation coefficient (R), is 0.783, indicating. (2b, 2c, 4a). Average efficiency value is higher for. similar association to technical efficiency in the. the agriculture sector, reaching 95.2% efficiency. case of environmental efficiency.. Ambientalia SPI(2010). system. level.. Spearman. rank. 16.
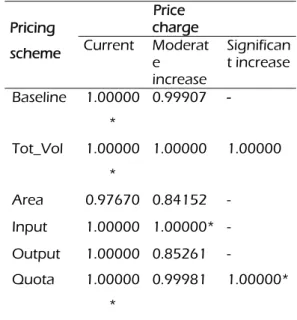
(17) Giannoccaro, Prosperi, Zanni. As a whole, it is confirmed that the volumetric pricing applied to the pressure water. 0 Output. and to the natural sources will lead to the highest eco-efficiency, though input and output pricing. 0.88979. -. 0.98949. 1.00000*. 6 Quota. may also lead to similar results. In addition, it is clear that a careful analysis on the effects of the. 0.9917 0.9888 5. *Weakly efficient according to the slack value. pricing levels is also required. Area pricing is the least efficient policy, regardless of the pricing level. The input pricing, at. Table 9: Rank of water pricing policy options: ecoefficiency score (public perspective). the current pricing level is among the most efficient, but contrarily to initial expectations,. Pricing. higher levels may have a lower efficiency due to. scheme. an excess of environmental externality (pesticide Baseline. risk). Lastly,. the. overall. efficiency. index. Significan t increase -. *. is Tot_Vol. reported on Table 8 and 9.. Price charge Current Moderat e increase 1.00000 0.99907 1.00000 1.00000. 1.00000. *. It is evident that the current situation is not efficient, but the magnitude of improvement in. Area. 0.97670 0.84152. efficiency is at least less than 2% (at farm level). It is. Input. 1.00000 1.00000* -. confirmed that the full volumetric pricing is the. Output. 1.00000 0.85261. -. most efficient, as well as the input pricing (to a. Quota. 1.00000 0.99981. 1.00000*. *. certain extent). However it is important to. *Weakly efficient according to the slack. evaluate the impact of the pricing level. In the case of the quota method, it emerges as an. -. value. interesting alternative, since its efficiency levels are rather high, relatively to other methods. Area 6. CONCLUDING REMARKS. scheme is always the less efficient. Table 8: Rank of water pricing policy options: ecoefficiency score (private perspective) Price charge Pricing scheme Baseline. Current Moderat e increase 0.9888 0.98043 0.9807 0.9741. -. makers require a clear overview of the different. 1.0000. Ambientalia SPI(2010). protection of natural sources depletion. Policy outcomes. 1.00000. 1.00000. deriving. from. alternative. water. management policies, and tools aimed at decision support are needed in order to select of the most. 0.89007. -. 5 Input. for the enhancement of water efficiency and the improvement of its quality status, as well as the. 0 Area. of the mandatory policy instruments in the WFD. Significant increase. 5 Tot_Vol. The reform of water pricing methods is one. suitable option. This research is committed to providing knowledge either, to public decision. 0.99671. -. maker and to farm representatives in order to. 17.
(18) Giannoccaro, Prosperi, Zanni. allowing or facilitating a participatory process. hardware. based on scientific evidence.. charging because of the need of keeping good. In the present paper we propose a methodology. have. accurate. volumetric flow. rate. developed to assess the relative technical and. indirect methods are claimed to be easily. ecological efficiency of an agricultural system. implemented (Tsur and Dinar, 1995), they might. subject to alternative water pricing policies. These. be preferable, without significant losses in terms of. measures of the efficiency may be convenient for. efficiency.. options. in. DEA,. to. with. measurement devices. As a consequence, since. policy. on. and. associated. specifically. ranking. based. records. costs. case. of. scarce. information on social preferences towards some. ACKNOWLEDGEMENTS. outcomes, as well as in presence of some externalities. According to our findings, some differences emerge among alternative pricing schemes, in terms of technical and ecological efficiency. It is. The authors would like to thank two anonymous referees for their insightful comments on draft version of this article.. confirmed that the full volumetric pricing is efficient, but also some indirect pricing (e.g. input pricing) show very close levels of efficiency. In addition, the efficiency seems affected also by the pricing level. Therefore, in order to enhance water efficiency, it is important to focus either, on the pricing scheme and also on the pricing level. The enforcement of tariffs does not result in technical. or. environmental. REFERENCIAS BIBLIOGRÁFICAS Berbel J., Calatrava J., Garrido A. (2007), Water pricing and irrigation: A review of the European experience. In Irrigation water pricing. The gap between theory and practice. Molle F. and Berkoff J. (Eds). CABI, Union King.. efficiency. Berbel, J. and Gutierrez, C. (2005), Sustainability of. improvements. As a consequence, this policy. European Agriculture under Water Framework. implication may be important given that water. Directive. policy reforms are addressed to increase water. Commission, Brussels.. and. Agenda. 2000.. European. price according to the WFD ‘cost recovery’ concept. However, it is worth mentioning that the. Bono, F. and Matranga, D. (2005). Measures of. study is based on a short-term horizon, with a. efficiency in the environmental context. In S.I.S.. fixed coefficient linear programming model.. 2005 - Statistica e Ambiente. Messina, Italy 21-23. Therefore, further research is still needed aimed at. September 2005.. exploring technological change that farmers may decide to introduce, in the long run. Finally, it should be kept in mind that volumetric allocation and charging do imply an inherent. additional. cost,. given. by. higher. investment for water measurement technology and its management (public and private). There are also some additional administrative and. Ambientalia SPI(2010). Burt C.M. (2007). Volumetric irrigation water. pricing. considerations.. Irrigation. Drainage. Commercio. Industria. System, 21:133–144. CCIAA. (Camera. Artigianato. di. Agricoltura). (2007),. Rapporto. economico 2006-2007. Osservatorio Economico Provinciale. Foggia.. 18.
(19) Giannoccaro, Prosperi, Zanni. CEC (Commission of the European Communities). Dworak T., Berglund M., Laaser C., Strosser P.,. (2007), Towards Sustainable Water Management. Roussard. in the European Union. First stage in the. Kyriazopoulou I., Berbel J., Kolberg S., Rodriguez-. implementation of the Water Framework Directive. Diaz J.A., Montesinos P., (2007), EU Water Saving. 2000/60/EC. [COM(2007) 128 final], Brussels,. Potential, Report ENV.D.2/ETU/2007/0001r, EU. 22.3.2007. Commission, Brussels.. Charnes A., Cooper W., Rhodes E. (1978).. Färe, R., Grosskopf, S., Lovell, C.A.K. and Pasurka,. Measuring the efficiency of decision-making units,. C. (1989). Multilateral productivity comparisons. European Journal of Operational Research vol. 2,. when. pp. 429–444. nonparametric approach. Review of Economics. J.,. some. Grandmougin. outputs. are. B.,. Kossida. undesirable:. M.,. a. and Statistics, 71:90-98. Coelli, T. (1996). A Guide to DEAP Version 2.1: A. Data Envelopment Analysis (Computer) Program.. Giannoccaro, G., Prosperi, M., and Zanni G.. CEPA (Center for Efficiency and Productivity. (2008). DEA Application to Evaluate the Technical. Analysis), New England, Australia. Working Paper. and Ecological Efficiency of Water Pricing Policies.. 96/08. In Modelling agricultural and rural development policies, Bartova, L., M’Barek,. R., Ratinger, T. (eds.),. Coelli T., Prasada Rao, D.S., Batteste, G.E. (1998),. An introduction to efficiency and productivity analysis. Kluwer Academic Publishers, Boston.. G., Rasaratnam Syamarlah, Stringer Karl S. (2006).. Implications of variant efficiency measures for policy evaluations in UK higher education, SocioEconomic Planning Sciences, 40(2):119-142. Kluwer. Academic. Publishers, Boston/Dordrecht/London Dinar, A., and Subramanian, A. (1997). Water. pricing experience, World Bank Technical Paper #386. World Bank, Washington. economic approaches to improving management, working paper WP-002, Centre for International and. Agricultural. Minnesota, US. Ambientalia SPI(2010). Policy,. Giannoccaro G., Prosperi M., Valente N., Zanni G. (2009), Valutazione degli impatti della politica di. tariffazione delle acque irrigue sull'agricoltura Italia. Valutazioni di scenari e strumenti di supporto alle decisioni, Gallerani V, La Via G., Zanni G. (eds.) (Franco Angeli, Milano, Italy) Gibbons, J. D., (1971); Nonparametric Statistical. Inference. McGraw-Hill, New York. Gómez-Limón, J.A. (2006), El regadío: sistema. Dosi C., Easter K.W. (1994). Water scarcity:. Food. Communities (ISBN 978-92-79-08068-5).. della Capitanata (Puglia). In Acqua e Agricoltura in. Cooper W.W., Seiford M.L., Tone K. (2000), Data. Analysis,. European Association of Agricultural Economists, Sevilla, January 29 - February 1, 2008. European. Colin Glass J., McCallion Gillian, McKillop Donal. Envelopment. Proceedings of the 107th Seminar of the. University. of. agrario multifuncional. In Agricultura familiar en España 2006, Fundación de Estudios Rurales (ed.), Fundación de Estudios Rurales, Madrid. Hajkowicz SA, Collins K. (2007). A Review of. Multiple Criteria Analysis for Water Resource. 19.
(20) Giannoccaro, Prosperi, Zanni. Planning and Management. Water Resources. Framework Directive. Environment and Planning. Management 21(9):1553-1566.. C: Government and Policy 24(2):159–167.. Johansson R. C., Tsur Y., Roe T. L., Doukkali R.,. MIMAM (Ministry of Environment and Agriculture). Dinar A. (2002). Pricing irrigation water: a review. (2008),. of theory and practice. Water Policy 4(2):173–199.. MARM/2656/2008, BOE n. 229, 22sd, September. Guidance of hydrologic planning. Law. 2008. Korhonen P.J., Luptacik M. (2004). Eco-efficiency. analysis of power plants: An extension of data. Molle F. and Berkoff J. (2007a), Irrigation water. envelopment. pricing. The gap between theory and practice.. analysis.. European. Journal. of. Operational Research, 154:437-446.. IWMI/CABI, Wallingford, UK. 347 pp. Hajkowicz, S. and Collins, K. (2007). A Review of. Molle F. and Berkoff J. (2007b), Water pricing in. Multiple Criteria Analysis for Water Resource. irrigation: mapping the debate in the light of. Planning and Management. Water Resource. experience. In Irrigation Water Pricing: The Gap. Management, 21:1553–1566.. between Theory and Practice, Comprehensive. Hajkowicz,. S.. and. Higgins,. A.. (2008).. A. comparison of multiple criteria analysis techniques. Assessment of Water Management in Agriculture (Molle,. F.,. Berkoff,. J.,. eds.).. IWMI/CABI,. Wallingford, UK. 347 pp.. for water resource management. European Journal of Operational Research 184:255–265. Musolino G., Rindone C. (2009). An integrated. LUTI and DEA procedure for strategic urban INEA. (Istituto. Nazionale. Economia. Agraria). (2005), La riforma Fischler e l’agricoltura italiana. Osservatorio sulle politiche agricole dell’UE. INEA, Roma.. transport planning, Association Of European Transport, 5-7 October 2009, Proceedings of the European. Transport. Conference,. Noordwijkerhout (NLD), 2009.. Interwies, E., Kraemer, A., Kranz, N., Görlach, B. and Dworak, T. (2004),. Basic Principles for. Selecting the Most Cost-Effective Combinations of. OECD. (2001),. Environmental. indicators. for. agriculture. Volume 3 - Methods and Results. OECD, Paris. Measures for Inclusion in the Programme of Water. Measures as Described in Article 11 of the Water. OECD. Framework. Sustainability, Markets and. Directive.. HANDBOOK.. German. (2006),. and. Agriculture: Policies, OECD,. Federal Environmental Agency, Berlin.. Paris. ISTAT (Istituto Nazionale di Statistica) (2001), 5°. Sengupta J.K. (1999). A dynamic efficiency model. Censimento nazionale dell’agricoltura. Roma, Italy.. using data envelopment analysis, International Journal of Production Economics, 62:3, pp. 209-. Messner, F.. (2006).. Applying. participatory. 218. multicriteria methods to river basin management: improving the implementation of the Water. Ambientalia SPI(2010). 20.
(21) Giannoccaro, Prosperi, Zanni. Tisdell, J. G. (2001). The environmental impact of. WATECO. water markets: an Australian case-study. Journal. Environment: The implementation Challenge of. of Environmental Management 62:113-120.. the Water Framework Directive. A Guidance. (2003),. Economics. and. the. Document. Common implementation strategy for Tyteca D. (1996). On the Measurement of the. the Water Framework Directive (2000/60/EC).. Environmental Performance of Firms- A Literature. European Commission, Brussels.. Review and a Productive Efficiency Perspective. Journal of Environmental Management 46:281308 Tsur, Y., Dinar, A. (1995). Efficiency and Equity. Considerations in Pricing and Allocating Irrigation Water. Policy Research Paper 1460, World Bank, Washington Tsur, Y., Dinar, A. (1997). The Relative Efficiency. and Implementation Costs of Alternative Methods for Pricing Irrigation Water. The World Bank Economic Review, 11(2):243-262. Valera-Ortega C., Sumpsi J.M., Garrido A., Blanco M., Iglesias E. (1998). Water pricing policies, public. decision. making. implication. for. and water. farmers’ policy.. response: Agricultural. economics, 19:193-202. Appendix Pay-off matrix Externalities Output Farm Value Water Pesticide Nitrate Labor Water Revenue Added Saving* Risk Surplus Capital 26 209 195 607 657 0 711 29 21 195 148 546 589 0 668 28 26 211 195 602 657 0 711 29 20 190 118 517 562 77 615 27 19 189 106 492 543 89 603 26 23 200 195 609 626 0 785 29 21 226 165 506 501 30 748 28 22 175 195 607 617 0 649 27 18 149 170 495 509 25 641 24 24 188 195 602 631 0 759 27 20 218 191 491 484 5 668 26 26 209 195 607 657 0 711 29 26 207 192 605 653 0 708 29 24 196 172 593 628 0 683 28 Input. Pricing. Land. 1a.Baseline 1b.Baseline+ 2a.Tot_Vol 2b.Tot_Vol+ 2c.Tot_Vol++ 3a.Area 3b.Area+ 4a.Input 4b.Input+ 5a.Output 5b.Output+ 6a.Quota 6b.Quota+ 6c.Quota++. 400 399 400 394 394 412 410 394 380 394 394 400 400 398. Ambientalia SPI(2010). 21.
(22) Giannoccaro, Prosperi, Zanni. *Water saving refers only to the groundwater source. 1. Coelli proposes a multi-stage DEA version, where a sequence of radial PL’s to identify the efficient point are conducted. By contrast earlier versions (i.e. one-stage and two-stage) are not invariant to units of measurement. 2. This document gives a snapshot of the situation of implementation in the Member States, based on reports due to be submitted in 2004 (for transposition and article 3) or 2005 (for article 5). According to the Directive’s timetable, implementation of water pricing policy is due to by 2010 (Art. 9). It is not envisaged to update this report before 2012 when the first comprehensive implementation report is required in accordance with Article 18 (1). 3. Following the directive framework, we preferred to take into account only the relating fertilizers and pesticides pollution, as well depletion of water resources. The general model it could hold more variables. 4. The value of this parameter is empirically found, through a “trial and error” process, when the overall water consumption calculated by the simulation model is equal to the current water consumption. 5. Reform has been introduced by the Regional Law No 9 of May 2008 (PUGLIA, L.R. n. 9/2008). 6. See Coelli (1996) for more details.. Ambientalia SPI(2010). 22.
(23)
Figure


+4


Documento similar
For this reason different methodologies have been evaluated in this thesis to increase water use efficiency in Andalusian agriculture by means of the improvement in the
To monitor the water quality, we compared the changes in water transparency for every wavelength for pure water and water with differ- ent Gd sulfate concentrations, as well as
Water is used for energy generation and energy is consumed in water extraction, distribution, treatment and desalination.. The water sector is becoming increasingly a
• How does the global consumption of rice relate to the use of different kinds of water at production regions?. • What is the role of the blue (surface and ground) and green water
• Inadvertently, virtual water will play a greater role in food trade – simply as a function of increasing water scarcity and the disparity of water availability between countries
a symptom of disconnected agricultural and sanitation policies ...74 Policy cocktails for protecting coastal waters from land-based activities 84 Pathways to improved water
The impact on energy consumption in pumping and treatment illustrates the water-energy nexus in Spain’s agriculture and the change in the water policy paradigm from
Our findings suggest that an increase in irrigation efficiency (due to WCST implementation, e.g., a change from furrow irrigation to drip irrigation) would generate
