(will be inserted by the editor)
Web-GIS tool for the management of rural land markets.
Application to the Land Bank of Galicia (NW Spain)
Juan Porta · Jorge Parapar · Paula Garc´ıa · Gracia Fern´andez · Juan Touri˜no · Ram´on Doallo · Francisco ´Onega · In´es Sant´e · Pablo D´ıaz · David Miranda · Rafael Crecente
Received: date / Accepted: date
Abstract Land abandonment and stagnation of rural markets in the last few years have become one of the main concerns of rural administrations. The use of Web and GIS (Geographic Information System) technologies can help to mitigate the effects of these problems. This paper proposes a novel Web-GIS tool with spatial capabilities for the dynamization of rural land markets by encouraging the transfer of land from owners to farmers through the leasing of plots. The system, based on open source software, offers information about the properties, their environment and their owners. It uses standards for handling the geographic information and for communicating with external data sources. This system was used as the basis for the development of SITEGAL, the tool for the management of the Land Bank of Galicia (www.bantegal.com/sitegal). SITEGAL has been operational since 2007 obtaining benefits for both administration and users (farmers and land owners), and promoting the e-Government.
Keywords Land Bank, GIS, Open source, WMS, WFS, Java web application
1 Introduction
Land abandonment and land markets failure is becoming an issue in many regions across Europe. Although in general terms Central and Eastern countries are the most representative facing those processes [1, 2], the fact is that it also appears in other European zones, as for instance Portugal or Spain [3]. But these both pro-cesses are linked in the sense that land markets are expected to allow adjustment of rural structures changing economic conditions. Through land transactions, more
Juan Porta1
·Jorge Parapar·Paula Garc´ıa·Gracia Fern´andez·Juan Touri˜no·Ram´on Doallo Computer Architecture Group, University of A Coru˜na, Spain
{juan.porta,jpararparl,pgarciab,gfernandez,juan,doallo}@udc.es 1
Corresponding author
Francisco ´Onega·In´es Sant´e·Pablo D´ıaz·David Miranda·Rafael Crecente Land Laboratory, University of Santiago de Compostela, Spain
dynamic and efficient farms would take advantage of using more land, incorporat-ing it from farms less efficient or farms retrievincorporat-ing from production. But if farmland markets are not working properly it may happen that agricultural land, that is released of production due to the inability of its current user to get profit from it (or due to other reasons), is not taken by other potential, active user, even if potential net income of using that farmland is positive.
As an example, in the case of Galicia, an autonomous region located in the north-west of Spain affected by the cited processes, [4] states that the main paradox of Galician agriculture is that there being availability of land and the possibility of improve the labour productivity in operating farms, there is at the same time a significant proportion of rural land underused or abandoned. He summarizes this as “the basic element that hinders the improvement of labour and capital productivity in agriculture is lack of land mobility”. Thus, during the last 20 years 145,000 hectares have been abandoned in Galicia [5], while one of the main claims of the agricultural sector is the need of enlarging average size of operating farms.
1.1 The transaction costs
A fundamental impediment to land mobility are the high transaction costs [6, 7]. As originally introduced by the seminal Coase’s paper, transaction costs composed of negotiation, guarantee and information costs1
, hamper the functioning of land markets [8]. [9] proposes that in essence all those transaction costs are indeed in-formation costs, for they all have in common that they represent resource losses in transactions due to lack of information. So information costs increase the difficul-ties that farmers have for finding land with the required characteristics, and also for the owners in order to find interested tenants or buyers for their land. Players need to invest time and/or money for gathering information about availability of parcels, their characteristics, their price, etc. If there is high land fragmentation (high number of parcels and owners per square kilometer) costs increase accord-ingly. The same occurs when geographic separation between parcels, potential suppliers and potential users is significant, something quite usual in rural areas suffering from migration processes [10].
1.2 The role of the Land Administration
Thus, reduction of transaction costs is seen as crucial for enhancing the perfor-mance of rural land markets, specially in those areas with high property frag-mentation [11, 12]. Being the improvement of the flow of information one of the crucial aspects for such a goal, Land Administration becomes a central issue when addressing information on land. Indeed, Land Administration is the gathering, processing and delivering of information related to the use, the ownership and the value of the land [13] and it has direct impact both at microeconomic and macroe-conomic levels [14, 15] and properly developed it specially improves conditions for land market performance and land policy implementation [16, 17].
1
Core Land Administration instruments are Cadastre and land registry, that typically gather information regarding use, value and ownership of land. Besides, other public agencies that may have important Land Administration tasks are the Land Banks, with a significant role in land transactions. According to [18], the Land Bank can be seen as “a new type of player in the land market; an owner (holder of property rights) that is not interested in growing but in distributing its land to established farms”. In doing so, the deadlock caused by non-economic factors and transaction costs would be avoided in order to make the land market as dynamic as differences in efficiency would suggest or require. In essence, a Land Bank can act as an intermediating agency that matches supply and demand of land (with a more or less active role during the transaction), fostering the transaction between owners and farmers, providing information regarding the use and the value of the land and supporting the transaction from a legal and administrative perspective. Land Banks have been operating in several Western European regions and are currently under discussion in Central and Eastern Europe [18].
For them working properly, both the Land Bank and the rest of Land Admin-istration systems, ICT (Information and Communication Technologies) and GIS (Geographic Information Systems) technologies are crucial. Many of the capaci-ties of modern land administration systems rely on the core cadastral component, that is, on detailed information at the land parcel level [19, 20]. There are several particularities that make land parcels different from any other resource or asset, so regarding land mobility performance the importance of GIS technologies becomes more crucial than for any other field. The first aspect is that the parcel itself is defined by its boundaries, this means in essence by geographic elements. There is not object/parcel if the geographic dimension is not clear. Besides, there are not two equal parcels on Earth given that at least their positions are different, and due to it not identical attributes can be claimed. Thus, accuracy and reliability of spatial information in land define the identification of the object to be transacted itself and most of the characteristics that determine its value, and GIS provide a visual representation of information that is of great importance for analysing and reasoning when dealing with spatial heterogeneity [21]. As [20] summarizes “the parcel layer is much more significant than a map [...]. In short, it connects the identified spaces with the ways we talk about them, as properties, addresses and places of interest”. GIS technologies allow to manage and process big amounts of spatially enabled information and to create spatial data infrastructures. According to [22], it will be because of this kind of support systems that the mobility of land property rights, which are becoming more and more varied and complex, will be facilitated, as only the deployment of those systems facilitate the integration of so diverse layers of information that really define the parcel attributes.
understandable for the whole society will lead to improved decision-making on land issues [24, 25].
1.3 The lack of Web-GIS tools
Integration for purposes of e-Democracy and e-Government remains the major potential deliverable of Land Administration systems, so one of the emphasis for future systems is the focus on Web enablement [26]. Most of the web applications that have the publication of advertisements about rural properties as their objec-tive do not have a GIS environment as a basis, or it is a basic environment with poor information. The same occurs with webs of real-estate agencies and, in gen-eral, with all the webs that publish advertisements. For instance, there are private sites devoted to buying and renting business of plots, constructions and other stuff: www.turofincas.com,www.buscafincas.comorwww.fincasysolares.com; and others specialized in rural properties:www.fazonline.com.br orwww.landandranchsales. com. There are sites that delegate the GIS functionalities in third-party web-based GIS services like Google Maps. These services are quite useful for localization pur-poses but they do not offer many functions to operate with objects such as selec-tions, highlighting or click-on queries. Examples of that arewww.housingmaps.com and www.farmseller.com. Some possible reasons for not using GIS tools are the high cost of the information layers and the complexity of the integration in the buy and sell or rental proceedings.
Regarding Land Banks, there are several regions where they work, however no public Web-GIS application for their management was found. In Spain we can find the Land Bank of Asturies where a Web-GIS tool is used but only for internal management. Moreover, the region of Biscay, in the Basque Country, has started to create an Agricultural Ground Fund but it has not yet a public tool. In Europe, many Land Banks have been operating in several regions/countries specially since the sixties [27, 28]. One of the most significant examples is the SAFER (Soci´et´es d’am´enagement foncier et d’´etablissement rural) in France, that only in 2010 was actively involved in the transaction of 76,000 ha of agricultural land [29]. Based on buy and sell, clients can consult the offers via web (www.proprietes-rurales.com) but without GIS capabilities.
So, in this paper we analyse how the new technologies can improve land mo-bility processes and present an architecture based on independent Web and GIS modules communicated through standards. This architecture serves as a basis for the implementation of Web-GIS systems which can be applied to processes of Land Administration. In this context, a real case study is explained: the Land Information System of Galicia (SITEGAL). It represents an evolution beyond the information systems of the described European Land Banks, as it is a Web-GIS platform that supports the operations of the Land Bank of Galicia and leads Gali-cian land administration to the direction of e-Government.
2 Global architecture of a Web-GIS system for promoting mobility in rural land markets
The proposed system has been developed using only open source tools, which has been possible because of the advanced stage of development of free GIS tools [30]. Although the use of open source software can cause an initial expense in the training of the users, this cost is returned rapidly with the savings made by not purchasing the licenses of proprietary tools. Another advantage of open source software is that it allows the access to source code and its modification.
The system also uses OGC (Open Geospatial Consortium) standards [31] to facilitate the interconnection with external services with all kind of information, so with a simple modification of the servers’ addresses, the system automatically changes its external data sources. The most popular OGC services are the Web Map Service (WMS) [32], used to obtain maps with several information layers (usually in raster format), and the Web Feature Service (WFS) [33], used to get the information about the alphanumerical attributes of the objects in vector format (usually in GML, Geography Markup Language [34]).
2.1 System architecture
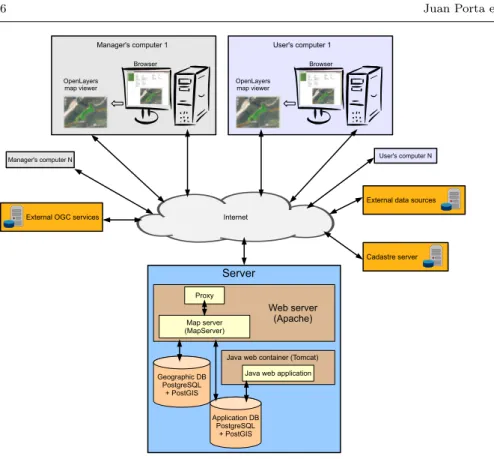
Fig. 1 shows the system architecture, whose core is a Java web application that implements all the functionalities related to cessions and rentals of plots, stores the information in the database and generates the user interface with dynamic web pages. The Java application accesses the geographic information through a map server, which is an independent process that acts like a proxy between the geographic information and the users. The map server is also in charge of the map generation and also obtains information about the attributes of geographic objects (like rivers, roads, etc.). Using this architecture, the web application and the data sources are completely independent.
Fig. 1: System architecture.
2.2 System components
The system consists of four main components: the Java web application, the map server, the map viewer, and the database with spatial capabilities. As it was already said, the decision taken was to use open software in the whole development of the system. In the next paragraphs, the details of the system components, and also the tools and the libraries used to implement them, are described. Moreover, a summary of existing alternatives for GIS tools and the reasons of choice are discussed. In this selection process the first step was to make a review of strengths and weaknesses of the main tools for each component based on a set of decision criteria established in order to adjust them to the proposed architecture and to comply with the requirements. Note that these choices were made some years ago, so we are in a good position to establish if they were good or bad decisions.
2.2.1 Java web application
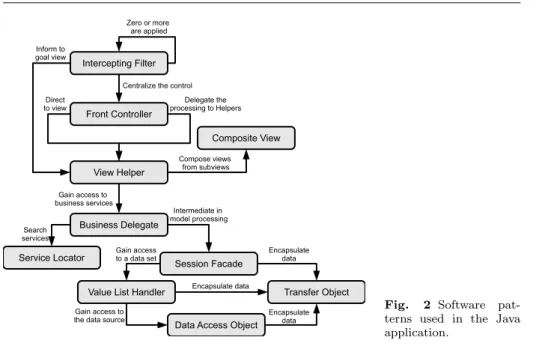
Fig. 2 Software pat-terns used in the Java application.
2.2.2 Map server
Making a good choice of the map server is crucial because it is the core of all the GIS part and its performance affects the whole system. The criteria studied were: reliability, supported data sources, performance, supported standards and project community; and the options considered were: MapServer [36], GeoServer [37], and deegree [38]. Six years ago, MapServer was (and currently is) one of the most popular GIS applications and with more supporters. It is developed in C and works as a CGI into a web server, although it also offers APIs for several languages. It has a good performance, allows the access to many data sources, and implements many standards. In particular, it allows the access in cascade to other WMS and WFS servers. The main drawbacks of MapServer are its difficulty to configure and install (in some cases it is necessary to compile the source code), and the fact that it is not as standard-compliant as GeoServer or deegree are: although it only supports basic standards they are enough for the needs of our system. In summary, the main reasons of selection of MapServer were its very good performance and reliability, the high support of the community, and its good integration with several data sources.
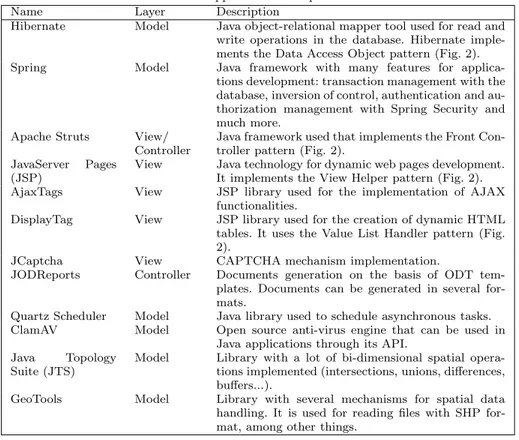
Table 1: Tools used for the Java web application development
Name Layer Description
Hibernate Model Java object-relational mapper tool used for read and write operations in the database. Hibernate imple-ments the Data Access Object pattern (Fig. 2). Spring Model Java framework with many features for
applica-tions development: transaction management with the database, inversion of control, authentication and au-thorization management with Spring Security and much more.
Apache Struts View/ Controller
Java framework used that implements the Front Con-troller pattern (Fig. 2).
JavaServer Pages (JSP)
View Java technology for dynamic web pages development. It implements the View Helper pattern (Fig. 2). AjaxTags View JSP library used for the implementation of AJAX
functionalities.
DisplayTag View JSP library used for the creation of dynamic HTML tables. It uses the Value List Handler pattern (Fig. 2).
JCaptcha View CAPTCHA mechanism implementation.
JODReports Controller Documents generation on the basis of ODT tem-plates. Documents can be generated in several for-mats.
Quartz Scheduler Model Java library used to schedule asynchronous tasks. ClamAV Model Open source anti-virus engine that can be used in
Java applications through its API. Java Topology
Suite (JTS)
Model Library with a lot of bi-dimensional spatial opera-tions implemented (intersecopera-tions, unions, differences, buffers...).
GeoTools Model Library with several mechanisms for spatial data handling. It is used for reading files with SHP for-mat, among other things.
2.2.3 Map viewer
The following criteria were studied for the selection of the map viewer: bandwidth requirements, browser support without plug-ins, and standards compliance. The use of Java applets or Flash was discarded to avoid the complication for the user of installing plug-ins and for performance issues too. Using a map viewer based on AJAX, the browser only queries the information from the server that is going to be updated, instead of downloading the whole page, thus reducing the bandwidth required.
stan-dards. The chosen one was OpenLayers because is currently the most popular open map viewer, it has a very active community behind for support, and we had a pre-vious knowledge of the core of the library. The functionalities that OpenLayers offers are in tune with the system requirements: access to many different types of data services, whether standard (WMS, WFS, WMTS, KML, GML...) or non-standard (Google Maps, Yahoo Maps, OpenStreetMaps, Bing Maps...); navigation over the map, zooms included; area and length measuring; query of information about the visible objects; selection and centering of objects; permalinks (links to recover the state of the viewer); or digitalization and modification of geometries. One of the most important benefits of this choice was the standard compliance, so we could reuse the viewer in other projects that use other map servers, such as GeoServer, with minor changes in the viewer code. An example of the map viewer based on OpenLayers is shown in Fig. 8.
2.2.4 Database with spatial capabilities
In the development of GIS-based systems it is common to use standard database management systems (DBMS) with spatial extensions. Regarding free software, there are two well-known DBMSs: PostgreSQL and MySQL. At the beginning of the project the spatial extension of PostgreSQL, PostGIS, had better support for the OGC standards than the MySQL spatial extension, which had a low level of maturity. So the decision was to use PostgreSQL plus PostGIS. Nowadays, the MySQL spatial extension has largely improved and is also supported by all the main map servers. If we had to start a new project, we would choose PostgreSQL because of the acquired experience and its good performance in our projects, but MySQL could be a good alternative.
2.2.5 Components integration
The connection between the Java application and the database is done through Hibernate and Hibernate Spatial, which support PostgreSQL and PostGIS. Any other data source supported by these tools can be used only changing the appli-cation configuration. The geographic database can be changed too, as MapServer is in charge of the connection between itself and the geographic database and it supports several spatial databases.
The communication of the map server with the map viewer and the Java ap-plication is the part which has needed more work. Although the visualization of layers in the viewer is quite easy, there are some use cases that require a complex communication involving several steps. For example, for the insertion of a plot in the system funds, the user has to carry out the following steps:
– Locate on the map the zone where the plot is (WMS GetMap query to show the map).
– Click over a plot. It will be highlighted with its borders in other colour (WMS GetFeatureInfo query to identify the plot and WMS GetMap query to obtain the map with the plot highlighted).
With this structuring of the independent components, changes in any of them do not affect others. For example, the map server can be replaced with another standard map server and that change will be transparent to the rest of the system.
2.3 Geographic data sources
There are three basic information layers for the right performance of the system: terrain orthophotographies, land uses, and cadastral maps. This information is stored in the filesystem of the server or in the local DBMS. The cost of obtaining and keeping updated all the geographic information is too high and the infrastruc-ture needed to provide it is difficult to maintain for most of Land Administrations, even more for the ones in rural areas. Due to these reasons, the system is able to connect to third-party services and get the needed information. Although it was observed that the use of external data sources has a negative effect on the perfor-mance of the system and sometimes the third-party servers are not available, as economy is a significant factor in this kind of projects, we consider that maintain-ing the essential data in local storage and obtainmaintain-ing the other information layers from external data sources is the best option.
At this point it is important to remark the INSPIRE initiative [42], a legal proposition at European level that aims to implement the infrastructure to enable the sharing of environmental spatial information among public sector organizations and better facilitate public access to spatial information across Europe. Closely related to this are the SDI, Spatial Data Infrastructures [43], that will support e-Government strategies and the provision of location to all human activities, gov-ernment actions, decisions, and policies [44]. Hence, some of the recommendations given by EU states are that new applications and services should be delivered and the interoperability between services and devices must be ensured, preferably through open standards. The developed system follows these recommendations and all the services used and provided comply with the OGC standards. The in-tention is to make a transition to the INSPIRE directives when they reach a higher level of maturity as well as when the tools used are adapted the those directives, as for instance MapServer is doing with the INSPIRE View Service.
2.4 System functionalities
A role-based access control has been developed to manage the information that can be shown to users. This way, users utilize the same tool but the actions they can take and the data they can consult are different. In order to facilitate the access to information and promote e-Government, it is not necessary the registration on the system to perform some actions. The roles used are described in the following subsections.
2.4.1 Not registered users
In the list view and for every plot, the rent (the price of the renting) and its real land uses (orchard, pasture, forest...) are shown. The user can also search plots through a form specifying some criteria (surface, price, location, etc.). If users do not find the plot they search, they can introduce in the system its characteristics (maximum and minimum surface, land uses, location...) and, when a plot with those characteristics is added to the system funds, the information system can automatically notify it to the corresponding user via email or SMS.
2.4.2 Registered users
If a user wants to ask for the rent of a plot, or if an owner wants to add his/her plot to the system funds, then they have to register. The information requested for user registration was minimized in order to encourage users to register, so only the following data are required: login and password to access his/her account, full name, address, national identification number (for checking the authenticity of data), birthdate (for checking the age of majority of the user), and a contact email or phone.
In order to request an incorporation of a plot into the system funds, the user can localize his/her plot by two different ways: through the map viewer, or filling in a form with the cadastral code and the system will search it automatically. If the boundaries of the plot shown in the map are not right, the user can draw them by himself/herself with the map viewer and those changes will keep save in the system. This allows the possibility of fixing errors in the cadastral data (explained in Section 3.3). The owners’ data have to be inserted, too. The rent of the plot is automatically calculated by the system depending on its location and land uses. Once this has been done, the system will generate the corresponding document (in PDF, DOC or ODT format).
Regarding the rental applications, when the users find an interesting plot they can insert their requests into the system through the web application, too. Data of cession and rental processes can be consulted by the user at any time, as well as its status (received, under consideration, accepted, denied...).
2.4.3 Managers
Managers are in charge of studying the cession and rental applications, accept or deny them. Some functionalities allowed for them are:
– Insertion of events related to plots (visits to check the plot state, received requests for land use changes...).
– Statistical generation over plots and applications.
– Modification of the geometry of the plots through several methods (see Section 3.3).
– Connection with the web services of the Cadastre to obtain updated plot ge-ometries and cadastral references.
In the case that the file was an image, a thumbnail will be created in order to be able to show a preview of it when needed.
Another useful functionality is the automatic assignment of the scanned docu-ments to the plots or applications. For example, when a contract is scanned, it is stored in a certain folder of the server and with a file name that indicates the plot or application to which it will be linked, so the system is able to detect new doc-uments and incorporate them to the database. Managers can also communicate with each other news, advices, and alerts (messages automatically generated in order to notify several issues: end of contracts, modifications in the characteristics of a plot, etc).
The system implements the automation of several tasks too, such as:
– Calculation of the score assigned to the specific plot applications according to the preferential criteria defined by the relevant body.
– Calculation of the plot land uses using spatial operations (intersection of the plot geometry and the land uses layer).
– Calculation of the plots price according to their land uses and location.
– Update of the prices of every plot according to the variation of the Retail Price Index.
3 GIS implementation details
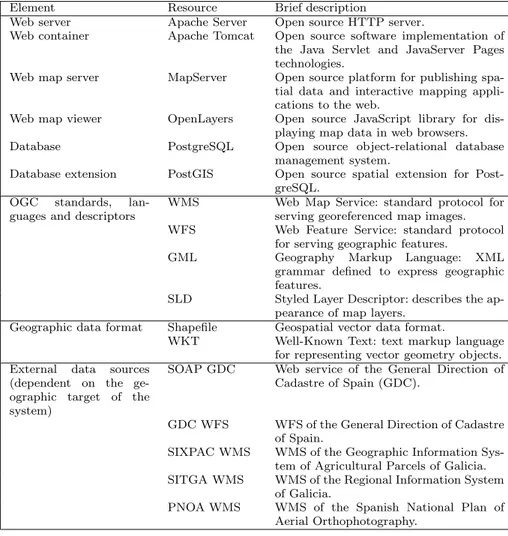
In this section the most outstanding characteristics of the system related to GIS technologies are explained emphasizing the solutions adopted to deal with the problems arisen. Table 2 summarizes the main technologies, resources, standards and protocols used for the development of the system (those already explained in Table 1 are omitted).
3.1 Access control to geographic information
Table 2: Summary of technologies used by the system
Element Resource Brief description
Web server Apache Server Open source HTTP server.
Web container Apache Tomcat Open source software implementation of the Java Servlet and JavaServer Pages technologies.
Web map server MapServer Open source platform for publishing spa-tial data and interactive mapping appli-cations to the web.
Web map viewer OpenLayers Open source JavaScript library for dis-playing map data in web browsers. Database PostgreSQL Open source object-relational database
management system.
Database extension PostGIS Open source spatial extension for Post-greSQL.
OGC standards, lan-guages and descriptors
WMS Web Map Service: standard protocol for serving georeferenced map images. WFS Web Feature Service: standard protocol
for serving geographic features.
GML Geography Markup Language: XML grammar defined to express geographic features.
SLD Styled Layer Descriptor: describes the ap-pearance of map layers.
Geographic data format Shapefile Geospatial vector data format.
WKT Well-Known Text: text markup language for representing vector geometry objects. External data sources
(dependent on the ge-ographic target of the system)
SOAP GDC Web service of the General Direction of Cadastre of Spain (GDC).
GDC WFS WFS of the General Direction of Cadastre of Spain.
SIXPAC WMS WMS of the Geographic Information Sys-tem of Agricultural Parcels of Galicia. SITGA WMS WMS of the Regional Information System
of Galicia.
PNOA WMS WMS of the Spanish National Plan of Aerial Orthophotography.
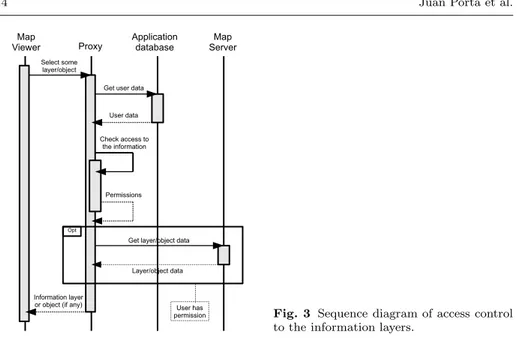
3.2 Getting land uses and locating plots through standard protocols
Fig. 3 Sequence diagram of access control to the information layers.
In a similar way, to locate a plot into the map viewer and get all information about it, its bounding box is also used in a WFS GetFeature query. This query returns a list of features with information about the plots inside the bounding box, and the system will choose the feature with more intersection area between the plot selected by the user and the features returned by the query.
3.3 Modification of geometries
As the plot map used can have errors, the system allows to modify the geometry of the plots in three different ways: through Cadastre WFS, through spatial files, or directly drawing the new geometry over the map viewer. This is a very interesting functionality because the system can keep a feedback with the map plot data sources and correct the errors on their data. Note that if the modification is done by a registered user, a manager must revise it to ensure the reliability of the data.
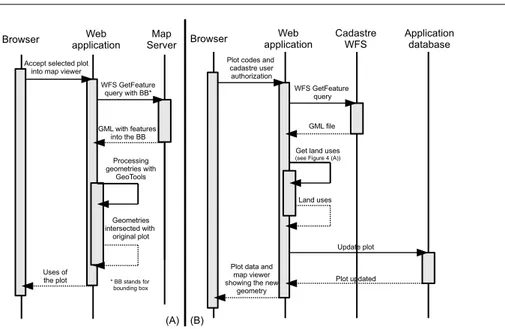
3.3.1 Integration with cadastral WFS services
Fig. 4: Sequence diagram of the WFS communication with the local server to get land uses (A), and with the Cadastre server (B).
3.3.2 Spatial files
Users can specify the new geometry of the plot uploading spatial files (in Shape [46] or GML formats) to the server, which reads them using GeoTools and, in case that the geometry is valid, it will be assigned as the new geometry of the plot. Users can also use the WKT (Well-Known Text) format [47], a markup language regulated by the OGC for representing vector geometry objects. In this case, the WKT is read using the corresponding JTS functionality.
3.3.3 Drawing the geometry
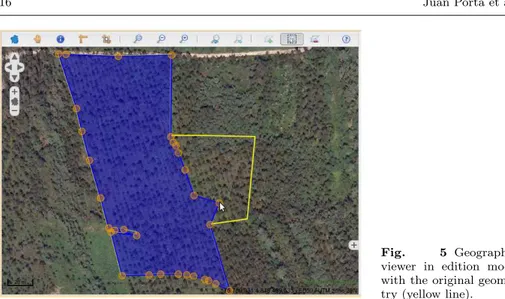
OpenLayers allows to draw geometries over the viewer. This functionality is ex-ploited to update the geometry of a plot. To do that, the drawing controls are enabled and an edition layer is added to the viewer (see Fig. 5). The system re-trieves the geometry of the plot and translates it to WKT format. The geometry is shown into the viewer in an edition mode allowing the user to move the vertexes of the polygon in order to create a new geometry for the plot. When the user finishes the edition, the web application transforms the new geometry from WKT format into a Geometry object using the JTS library. Then, this geometry is assigned to the corresponding plot.
3.4 Centering and highlighting of plots
Fig. 5 Geographic viewer in edition mode with the original geome-try (yellow line).
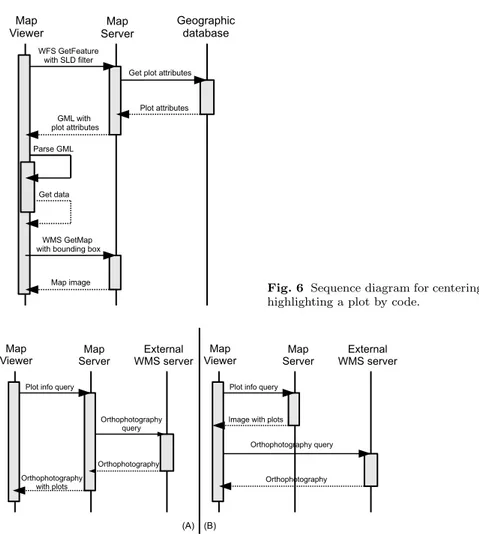
the map to the plot envelope. Fig. 6 shows the map viewer ability to centre and highlight a plot when a user provides its cadastral code. First, the viewer launches a WFS GetFeature query with a filter specifying the code of the plot. The map server consults the geographic database about the plot with that code and then builds the GML with the plot attributes. Then, the viewer will be able to extract all required data of the GML response and to build the WMS GetMap query with the corresponding bounding box, in order to allow the map server to return an image with the plot centred and highlighted.
There is a different treatment when a user consults information about an ob-ject by clicking it in the map viewer: the first query will not be a WFS GetFeature since the map viewer does not know the code of the plot. As it can only know the coordinate of the point clicked on the image, it will send a WMS GetFeatureInfo query with the selected point. That query will return a GML with the plot at-tributes and, with it, the map viewer will be able to centre and highlight the plot as described above.
3.5 Layer clustering
The system allows to consult a high number of information layers obtained from different data sources. So, with the goal of reducing the number of queries sent to the server, and the number of images returned by it, the information layers are joined into logical groups that will be consulted with the same WMS query. Another way to get layer clustering is using cascading WMS, where a map server obtains information of other WMS servers. Using that, with one query the viewer can obtain images of multiple sources (see Fig. 7) reducing the data traffic.
4 Application to the Land Bank of Galicia
Fig. 6 Sequence diagram for centering and highlighting a plot by code.
Fig. 7: Comparative sequence diagrams between using cascading WMS (A) and not using it (B).
a deep evaluation of the system was carried out with the focus on its performance and its usage.
4.1 The Land Bank of Galicia and SITEGAL
Table 3: Scores (1-5) of the constraints that hamper land mobility (PC: Physical Constraints, TC: Transaction Costs, RSS: Retention from Supply Side)
.
Constraints Type Average score
Underused plots are not appropriate for farming because of ground, climate or slope.
PC 2.12
Underused plots are small or irregular. PC 4.19 Underused plots have unsuitable access. PC 3.19 Underused plots are far from requested places. PC 2.69
Unknown owners. TC 2.19
Hard to contact with owners. TC 2.56
Legal problems with plots: unresolved heritages, borders problems...
TC 2.53
Owners do not want to rent due to fear of losing the rights of the plots.
TC 4.06
Owners do not want to rent due to fear of payment or damage problems.
TC 3.12
Owners do not want to rent formally and this is an obstacle for the farmers.
TC 3.94
Owners do not want to sell plots because they hope to use them in the future.
RSS 3.60
Owners do not want to sell plots because they expect future revaluation.
RSS 3.19
Owners do not want to sell plots because they consider land as safe patrimony.
RSS 3.62
Owners do not want to sell plots because of emotional at-tachment and to keep the family patrimony.
RSS 3.94
Legal procedures and their costs are an obstacle. RSS 2.13 Farmers want land but they do not do an active search. TC 3.06 Farmers want land but they do not have good information
sources.
TC 2.56
it anymore waiting for revaluation due to urban development; (2) afforestation of land as an alternative source of income; and (3) holding of land as just an asset or an instrument for maintenance of patrimony. Moreover, another of the causes of the low mobility of land is located at the transaction level, with the high transaction costs2
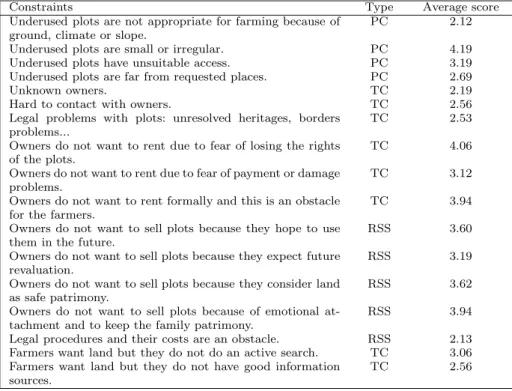
of land markets (both rental and sale markets) in Galicia, partly due to land fragmentation, that strongly hinders the information gathering and flow [11]. In a recent survey conducted by the Land Bank of Galicia among the technicians of the Regional Agrarian Offices3
, those causes were scored between 1 and 5 according to their importance when hampering land mobility (see Table 3). The average score for the causes related to high transaction costs was 2.90 and the average score for those ones linked to the retention of agricultural land from the supply side was 3.59. This confirms that, although retention of land (with different objectives) by owners that are not farming is perceived as more restrictive for farmland mobility, there are also informational obstacles to transaction which directly difficult it.
2
As introduced in Section 1.1, transaction costs include information, negotiation and guar-antee costs, although some authors consider that all of them can be seen as information costs.
3
Table 4: Main informational obstacles to lease plots. Regarding the other contracting party
Regarding the parcel
Farmer Who is the owner? Is there a parcel available in this area?
How can I get in contact with him/her?
Which are its boundaries?
Which is its size, current use, slope, orientation...?
How are the surroundings: access, road, network, distance from my farm?
Which is the price? Owner Is there a farmer interested in the
parcel?
Where is the parcel and which are its boundaries?
How can I get in contact with him/her?
Which could be a good price?
Transaction Which should be the condi-tions/clauses?
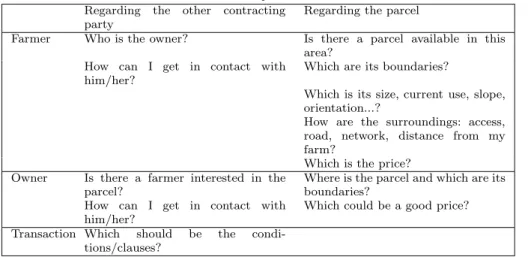
Table 4 summarizes the main informational obstacles to lease plots at two levels: contracting party and parcel.
In order to cope with this situation, in 2007 the Galician Government approved a law [48] which created an instrument for land administration, the Land Bank of Galicia, that aims to reduce land abandonment and encourage the transfer of land from owners to farmers by promoting its leasing, so only use right is involved and the rental mainly focuses on farmland. One of the core mechanisms of such operation pursues the reduction of the information costs associated to land mobility, facilitating the contact among owners who are not using their land and farmers that are willing to extend their farm. Three main goals are pursued: giving an alternative to buying and selling as land transfer mechanism, mitigating the owners’ mistrust on renting, and facilitating information flows.
Fig. 8: List of plots and map viewer of SITEGAL.
and partly on the price desired by the land owner. The Bank does not guarantee the rental of the plot, that will depend on the existence of interested farmers. If the plot is rented, the owners will receive the rent minus a 1% commission for the Bank management. In addition to these private plots, the Bank offers public ones too, usually coming from public reallocation processes of plots (land consolidation).
Any farmer can consult the list of available plots and ask for a rental. The procedure to rent a plot involves that the farmer presents a rental application. If there is more than one application over the same plot, the law establishes several criteria to determine which application must be the chosen one. Once the appli-cation is accepted, the contract must be signed by the farmer and the Bank. The default duration of the contract is five years, but it can be longer if both parties agree. The Bank guarantees that the owner of the plot will receive all the rent and, when the contract is over, the plot will be in the same conditions it was.
4.2 System evaluation
In this section the system is evaluated in terms of performance and usage. For the former the server in which the system runs and the response times of several requests are analysed, and for the latter the use of the system for both managers and clients of the Bank is discussed.
4.2.1 Performance evaluation
Since all the components are multi-platform (PostgreSQL, Java, MapServer...), the system is able to work in any operating system. In our case, the system was installed in two virtual machines with 4 GB of RAM, a two-core processor Intel X5450 at 3 GHz, and running SUSE Linux Enterprise Server 10 SP1 as operating system. The web server (Apache), the map server, and the geographic database were installed on one of these machines. The web application running on a Tomcat server and the application database server were installed on the other machine. Users access the Apache server that redirects the queries to the Tomcat server, which is only accessible from the local network. Although since the system launch in 2007 there were no problems of overload, as the system was designed in a modular manner, all components can be easily replicated in order to reduce their load, using load balancers for that purpose.
In the case of SITEGAL, the geographic database stores the plot maps and land uses obtained from the Geographic Information System of Agricultural Parcels of Galicia. Orthophotographies are obtained from the Spanish Plan of Aerial Or-thophotography that generates aerial images geometrically corrected of Spain ev-ery two years [49] that are available on a public WMS server. Other data are obtained from the WMS and WFS services of the Spanish Cadastre Office (see Section 3.3.1) and the Regional Information System of Galicia. The system uses MapServer 5.6 which supports WMS versions 1.0.0, 1.0.7, 1.1.0, 1.1.1 and 1.3.0; and WFS versions 1.0.0 and 1.1.0. It also supports GML2 and GML3, and SLD 1.0.0 and 1.1.0. The application database stores the plots incorporated into the Bank funds and all the information about users, and cession and rental processes. The spatial queries are expensive operations in this kind of systems. Table 5 shows average execution times for the most frequent queries to the map server. They were measured with different numbers of queries per second and, for every case, the test has been repeated five times to calculate the average. The represen-tative queries launched were:
– WMS GetMap query for the land use layer in a zone of 1000x1000 meters and a map size of 1024x1024 pixels.
– WMS GetFeatureInfo query for the plot map layer in a zone of 1000x1000 meters and a map size of 1024x1024 pixels.
– WFS GetFeature query for the land use layer using a bounding box filter (BBOX) in a zone of 1000x1000 meters.
Table 5: Query average time of an execution (in seconds) One query 5 queries
per second
10 queries per second
20 queries per second
50 queries per second
GetMap 1.10 2.21 3.76 6.38 13.81
GetFeatureInfo 0.64 1.46 2.53 4.31 10.14
GetFeature 1.18 2.12 3.31 5.85 11.81
with periodical updates, and the second one is implementing a mechanism that, when there are two or more sources with the same information layer, analyses the connections and sends the query to the faster server.
The whole system was designed and implemented being aware that these so-lutions could be added with minimal modifications in case that performance re-quirements increase.
4.2.2 Usage evaluation
To analyse the usage of the system the user profile must be taken into account: rural people, middle-aged or elderly, with no or reduced knowledge of new tech-nologies on computers, and an Internet access with poor quality of service. These characteristics have often been identified as important drawbacks for the develop-ment of this kind of initiatives in rural areas [50].
At date of May 2013, five and a half years after the launch of the Land Bank, SITEGAL counts with 2,858 clients: 2,636 of them are natural persons and 222 are legal persons. Moreover, 1,122 of these clients have a user account, allowing them to access into the system and carry out the procedures through the web application. Additionally, 265 Land Bank managers also have access to the sys-tem. Since November 2007, the Land Bank has processed 4,416 rental applications and 2,515 cession applications. Of them, registered users have introduced 1,426 (32.29%) and 656 (26.08%), respectively. The rest of applications have been de-livered on paper to the managers, who have then introduced the applications into the system through SITEGAL.
Table 6: Plots in the Bank funds and rentals made through SITEGAL
Plots Surface (Ha)
Total 7,337 3,366.79
Rented 1,500 (20.44%) 1,478.13 (43.90%)
Rental applications under study 1,216 1,356.31 Unique plots covered by rental
appli-cations under study
866 (11.80%) 748.33 (22.22%)
Cession applications accepted 941 (12.82%) 575.65 (17.10%) Cession applications under study 252 (3.43%) 140.48 (4.17%)
5 Conclusions and future work
Many regions around the world are suffering from land abandonment as the cause of the migration from rural to urban environments. This fact, together with the immobility of the land markets, is impoverishing the rural areas. This paper has described an information system whose main goal is to dynamize land markets by offering a tool with spatial capabilities accessible through the web. This tool facilitates the transfer of land between owners and farmers reducing the cost of these operations. Currently, owners of plots are able to publish their properties in the Land Bank, and farmers who want to expand their business can search the plots that satisfy their needs through the information system. This reduces paperwork and eases both publication and rental of plots, improving the connection between supply and demand of land, otherwise not attainable due to the high information costs involved. All the administrative procedures to carry out rentals and cessions of plots are done by public employees also using this tool, thus promoting e-Government and e-Administration.
Open source GIS tools, although in some aspects are not so mature as propri-etary software, in general have demonstrated that they are at a fairly good level, specially for web development. The future seems to be promising, demonstrated by the appearance of recent projects supported by important companies, institutions and organizations such as the Open Source Geospatial Foundation (OSGeo) or the Open Geospatial Consortium (OGC). Moreover, the use of standards makes it easy to add external data sources with geographic information. In the near future, we intend to adapt the communications between the modules of the architecture
(such as the map server or the map viewer)and the external data sources to the INSPIRE directives, when the GIS tools used by the system allow it.
Pilot Project in Albania (TCP/ALB/3301)4
. This project is set within the FAO ac-tivities of cooperation for the improvement of land management in East Europe. As a result of that, SITEGAL is currently being tested in a rural area of Albania. The system is continuously evolving and has constantly increased its function-alities since its launch. The modular architecture used allows to modify, update and replace parts of the system without changing the others. The technologies cho-sen when the project started really offered good performance. Nevertheless, some of them have become obsolete and have been replaced by other more up-to-date ones, as was the case of the map viewer and, in the near future, the View-Controller framework of the web application. The continuous contact between developers and users (in this case, with some managers of the Land Bank of Galicia) has served as guidance for further development and the navigation flow has been improved thanks to the users’ advice. The main criticism comes from the moderate use of the application by the owners of plots and the farmers. Currently one out of three farmers make the rental applications using SITEGAL and only one out of four owners make the cession applications through the web. These numbers are not bad taking into account the profile of the target users (people of rural areas with little experience in ICT), but more efforts should be made on spreading the bene-fits of using SITEGAL and on making easier the processes of renting and cession of plots.
Taking into account the users’ feedback, the next goals for the system are, from the point of view of its use: (1) including a functionality to insert groups of plots, so owners that have several plots should be able to introduce all of them in a single step; (2) adding plots with unknown owners to the Bank funds; (3) extending the implemented tool to incorporate capabilities for the management of land consolidation processes; and (4) allowing to add addresses of external data sources to see the information in the map viewer. From the point of view of the software design, and based on the experience acquired in the last years from this and other projects, it is planned: (1) to use tiles with the OGC standard WMTS (Web Map Tile Service) [51], thus the load of the images would be more friendly; (2) to check the availability of third-party servers and if one is down, choose another one that provides similar information; and (3) to change the framework used for the View and Controller layers of the web application: Struts is getting old, and as it would be extremely costly to port all the already implemented use cases to the new framework, only the new ones will be implemented with Apache Wicket. In fact, the integration of both frameworks is a nice challenge currently in process.
Acknowledgements This work has been funded by the Regional Ministry of Rural Affairs of the Galician Regional Government and by the Public Limited Company Bantegal, to whom we appreciate their collaboration in this paper. The work is also included in the project named Ge-ographic Information Systems for Urban Planning and Land Management using Optimization Techniques on Multicore Processors(Galician Government ref. 08SIN011291PR).
4
References
1. D. MacDonald, J. Crabtree, G. Wiesinger, T. Dax, N. Stamou, P. Fleury, J.G. Lazpita, A. Gibon, Journal of Environmental Management59(1), 47 (2000). DOI 10.1006/jema. 1999.0335
2. C. Alcantara, T. Kuemmerle, A.V. Prishchepov, V.C. Radeloff, Remote Sensing of Envi-ronment124, 334 (2012). DOI 10.1016/j.rse.2012.05.019
3. A. Renwick, T. Jansson, P.H. Verburg, C. Revoredo-Giha, W. Britz, A. Gocht, D. Mc-Cracken, Land Use Policy30(1), 446 (2013). DOI 10.1016/j.landusepol.2012.04.005 4. E. L´opez-Iglesias, Economic Galician Journal (in Galician: Revista Galega de Econom´ıa)
9(1), 167 (2000)
5. E. Corbelle, R. Crecente, Economic Galician Journal (in Galician: Revista Galega de Econom´ıa) (2013). In press
6. J. Zevenbergen, in22nd Urban and Regional Data Management Symposium. Seminar: Land Markets and Land Consolidation in Central Europe(Delft, The Netherlands, 2000) 7. P. Bandeira, J. Sumpsi, in V Congress of Agricultural Economics, AEEA(Santiago de
Compostela, Spain, 2004)
8. R.H. Coase, Economica4, 386 (1937)
9. C. Dahlman, Journal of Law and Economics22(1), 141 (1979) 10. H. Feder, D. Feeny, The World Bank Economic Review5, 135 (1991)
11. F. ´Onega L´opez, J. Puppim de Oliveira, R. Crecente-Maseda, European Planning Studies
18(5), 755 (2010)
12. K. Deininger, S. Savastano, C. Carletto, World Development40(10), 2108 (2012). DOI 10.1016/j.worlddev.2012.05.010
13. United Nations Economic Commission for Europe, Land Administration Guidelines. Tech. rep., United Nations, New York and Geneve (1996)
14. P.v.d. Molen, 2nd FIG Regional Conference, FIG (2003)
15. P.v.d. Molen, 3rd FIG Regional Conference for Asia and the Pacific: Surveying the Future - Contributions to Economic, Environmental and Social Development, FIG (2004) 16. J. Wallace, I.P. Williamson, Computers, Environment and Urban Systems 30(5), 614
(2006)
17. R. Bennett, R. A., I.P. Williamson, J. Wallace, Land Use Policy29(1), 208 (2012) 18. T.v. Dijk, D. Kopeva, Land Use Policy23(3), 286 (2006). DOI 10.1016/j.landusepol.2004.
07.005
19. S. Enemark, inSixteenth United Nations Regional Cartographic Conference for Asia and the Pacific(Okinawa, Japan, 2003)
20. J. Wallace, I. Williamson, A. Rajabifard, R. Bennett, Spatial Sciences Institute Special Edition on Spatial Information and Spatial Data Infrastructures51(1), 79 (2006) 21. G. Andrienko, N. Andrienko, P. Jankowski, D. Keim, M.J. Kraak, A. MacEachren, S.
Wro-bel, International Journal of Geographical Information Science21(8), 839 (2007) 22. J. Wallace, I. Williamson, Land Use Policy23, 123 (2006)
23. I. Williamson, Land Use Policy18, 297 (2001)
24. P.v.d. Molen, T. ¨Osterberg, in UN-FIG International Conference on Land Tenure and Cadastral Infrastructure for Sustainable Development(Melbourne, Australia, 1999) 25. L. Ting, I. Williamson, Survey Review36, 154 (2001)
26. S. Enemark, I. Williamson, J. Wallace, Journal of Spatial Science50(2) (2005)
27. T. Dijk,Dealing with Central European Land Fragmentation. A Critical Assessment on the Use of Western European Instruments(Delft, The Netherlands, 2003)
28. R. Eberlin, F. van Holst, F. ´Onega L´opez, in3rd International LANDNET Workshop on Land Market Development and Land Consolidation(Budapest, Hungary, 2012)
29. D. Liorit, in3rd International LANDNET Workshop on Land Market Development and Land Consolidation(Budapest, Hungary, 2012)
30. L. Gon¸calves, M. Cordero, R. Crecente, D. Miranda, International Journal of Geoinfor-matics2(2), 48 (2006)
31. Open Geospatial Consortium, (2013). http://www.opengeospatial.org/standards [Ac-cessed: May 2013]
32. OGC WMS, OpenGIS Web Map Server (WMS) Implementation Specification. Tech. rep., Open Geospatial Consortium. (2006). http://www.opengeospatial.org/standards/wms
33. OGC WFS, OpenGIS Web Feature Service (WFS) Implementation Specification. Tech. rep., Open Geospatial Consortium. (2005).http://www.opengeospatial.org/standards/ wfs[Accessed: May 2013]
34. OGC GML, OpenGIS Geography Markup Language (GML) Encoding Standard. Tech. rep., Open Geospatial Consortium. (2012).http://www.opengeospatial.org/standards/ gml[Accessed: May 2013]
35. M. Johnson, I. Singh, B. Stearns, Designing Enterprise Applications with the J2EE Platform, 2nd Edition (Prentice Hall PTR, 2002). http://java.sun.com/blueprints/ guidelines/designing_enterprise_applications_2e/[Accessed: May 2013]
36. MapServer, (2013). http://mapserver.org/ [Accessed: May 2013] 37. GeoServer, (2013). http://geoserver.org/ [Accessed: May 2013] 38. deegree, (2013). http://deegree.org/[Accessed: May 2013]
39. MapServer dbox, (2013). http://maps.dnr.state.mn.us/tools/dbox/ [Accessed: May 2013]
40. OpenLayers, (2013). http://www.openlayers.org/[Accessed: May 2013] 41. MapBuilder, (2013). http://mapbuilder.net/[Accessed: May 2013]
42. European Union, Summaries of EU legislation. Environment. General provisions (2007). http://europa.eu/legislation_summaries/environment/general_provisions/ l28195_en.htm[Accessed: May 2013]
43. D.D. Nebert,The SDI Cookbook (Developing Spatial Data Infrastructures, 2004). http: //www.gsdi.org/docs2004/Cookbook/cookbookV2.0.pdf[Accessed: May 2013]
44. I. Masser, A. Rajabifard, I. Williamson, International Journal of Geographical Information Science22(1), 5 (2007)
45. OGC SLD, OpenGIS Styled Layer Descriptor Profile of the Web Map Service Im-plementation Specification. Tech. rep., Open Geospatial Consortium. (2007). http: //www.opengeospatial.org/standards/sld[Accessed: May 2013]
46. ESRI, ESRI Shapefile Technical Description. Tech. rep., ESRI. (1998).http://www.esri. com/library/whitepapers/pdfs/shapefile.pdf[Accessed: May 2013]
47. OGC WKT, OpenGIS Well-Known Text. Coordinate Transformation Service. Tech. rep., Open Geospatial Consortium. (2001). http://www.opengeospatial.org/standards/ct
[Accessed: May 2013]
48. Presidency of the Galician Government, Official Journal of Galicia XXVI(104), 9020 (2007). http://www.xunta.es/dog/Publicados/2007/20070531/Anuncio199A6_gl.html
[Accessed: May 2013]
49. A. Arozarena, L. Garc´ıa, G. Villa, in24th International Cartographic Conference (Santi-ago, Chile, 2009).http://icaci.org/documents/ICC_proceedings/ICC2009/html/refer/ 2_1.pdf[Accessed: May 2013]
50. N.G. Bayfield, J. Conroy, R.V. Birnie, A. Geddes, J.L. Midgley, M.D. Shucksmith, D. El-ston, Land Use Policy22(2), 153 (2005)