Unemployment and private returns to higher education in Argentina (1974 2002)
Texto completo
Figure


Documento similar
For the states in the upper set, above the (2.7) curve, the wage of the low-skilled workers is suffciently high to induce the high-skilled parents to invest little in their
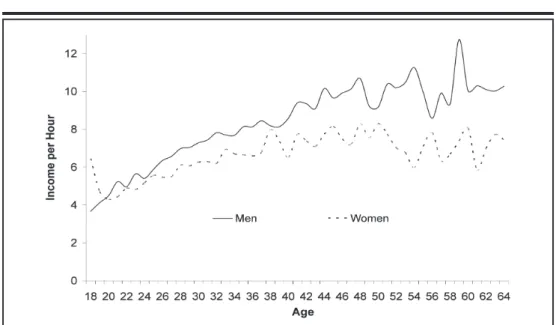
By levels of educational attainment, differences in returns also account for most of the gender wage gap in the sub-sample of individuals who achieve a level up to secondary
Regarding education mis- matches, the years of overeducation appear to have a negative rate of return, and the years of undereducation show no significant effect, suggesting
7 Weight assigned to best forecaster (cont.). e) Using density forecasts of unemployment one year ahead.. 8 Weighted averages of individual measures of uncertainty using the
From the ILO EPlex indicators we have obtained, we cannot clearly see an inverse relationship between the employment protection and the
But, once a variable closely related with the economic crisis (monthly unemployment rate) is introduced, the model is able to explain 55% of the rise of preferences
However, we notice a decreasing trend in migration willingness over time; given a similar unemployment rate migration willingness was higher the further back in the past.. For
No obstante, como esta enfermedad afecta a cada persona de manera diferente, no todas las opciones de cuidado y tratamiento pueden ser apropiadas para cada individuo.. La forma


