A note on China's development strategy and Latin American economies
50
0
0
Texto completo
(2) The South American Network on Applied Economics (Red Sudamericana de Economía Aplicada, Red Sur), is a policy-oriented research network integrated by public and private universities and centers of knowledge production in the region. It conducts research in the areas of economic development, natural resources, inclusive growth, employment, integration, trade and value chains, productivity and innovation. Red Sur is interested in promoting regional socio-economic analysis for policy discussion to respond to the challenges of development. It promotes, coordinates and develops joint studies from an independent and rigorous perspective on the basis of common methodologies with a regional vision. Red Sur has had the support of the International Development Research Centre (IDRC, Canada) since its inception.. http://redsudamericana.org/ Edificio Mercosur Luis Piera 1992, 3er piso Tel: (+598) 2410 1494 [email protected] 11200, Montevideo – Uruguay. This document was prepared to provide input to the debate on China’s economic development strategy and its impact on Latin America, Africa and China. Also, it integrates the contributions of the seminar organized in collaboration with the Inter-American Development Bank (IDB) and Red Sur in Buenos Aires, the 25th and 26th of March 2014 with experts from Latin America, Africa and China. This document aims to enhance our understanding of the impact of China’s economic activity and its policies and implications for the economies of Africa and Latin America, and particularly for international insertion strategies in these regions. The completion of this work was possible thanks to the support of the International Development Research Center (IDRC, Canada)..
(3) Working Paper N° 2/ 2015. A NOTE ON CHINA’S DEVELOPMENT STRATEGY AND LATIN AMERICAN ECONOMIES Ramiro Albrieu and Guillermo Rozenwurcel. RED SUR. Red Sudamericana de Economía Aplicada.
(4) 4. RED SUR MEMBER INSTITUTIONS > ARGENTINA Centro de Estudios de Estado y Sociedad (CEDES) Centro de Investigaciones para la Transformación (CENIT) Instituto Torcuato Di Tella (ITDT) Universidad de San Andrés (UDESA). BRAZIL Instituto de Economia, Universidade Estadual de Campinas (IE-UNICAMP) Instituto de Economia, Universidade Federal de Río de Janeiro (IE-UFRJ) Instituto de Pesquisa Econômica Aplicada (IPEA) Fundação Centro de Estudos do Comércio Exterior (FUNCEX). PARAGUAY Centro de Análisis y Difusión de Economía Paraguaya (CADEP) Desarrollo, Participación y Ciudadanía (Instituto Desarrollo). URUGUAY Centro de Investigaciones Económicas (CINVE) Departamento de Economía, Facultad de Ciencias Sociales, Universidad de la República (DECON–FCS, UdelaR) Instituto de Economía, Facultad de Ciencias Económicas y de Administración (IECON–CCEE, UdelaR).
(5) A note on China’s development strategy and Latin American economies. 5. RED SUR TITLES > • El Boom de Inversión Extranjera Directa en el Mercosur • Coordinación de Políticas Macroeconómicas en el Mercosur • Sobre el Beneficio de la Integración Plena en el Mercosur • El desafío de integrarse para crecer: Balance y perspectivas del Mercosur en su primera década • Hacia una política comercial común del Mercosur • Fundamentos para la cooperación macroeconómica en el Mercosur • El desarrollo industrial del Mercosur • 15 años de Mercosur • Mercosur: Integración y profundización de los mercados financieros • La industria automotriz en el Mercosur • Crecimiento económico, instituciones, política comercial y defensa de la competencia en el Mercosur • Asimetrías en el Mercosur: ¿Impedimento para el crecimiento? • Diagnóstico de Crecimiento para el Mercosur: La Dimensión Regional y la Competitividad • Ganancias Potenciales en el Comercio de Servicios en el Mercosur: Telecomunicaciones y Bancos • La Industria de Biocombustibles en el Mercosur • Espacio Fiscal para el Crecimiento en el Mercosur • La exportación de servicios en América Latina: Los casos de Argentina, Brasil y México • Los impactos de la crisis internacional en América Latina: ¿Hay margen para el diseño de políticas regionales? • La inserción de América Latina en las cadenas globales de valor • El impacto de China en América Latina: Comercio e Inversiones • Los desafíos de la integración y los bienes públicos regionales: Cooperación macroeconómica y productiva en el Mercosur • Enrique V. Iglesias. Intuición y ética en la construcción de futuro • Los recursos naturales como palanca del desarrollo en América del Sur: ¿ficción o realidad? • Los recursos naturales en la era de China: ¿una oportunidad para América Latina? • ¿Emprendimientos en América del Sur?: La clave es el (eco) sistema • Uruguay + 25. Documentos de Investigación • Reporte Anual y Resumen Ejecutivo “Recursos Naturales y Desarrollo” > Edición 2014.
(6) 6. I. Introduction Historically, the relationship between the Latin American macroeconomic performance, its strategy for integrating into international markets, and the swings in the world economy has been closely related (Bulmer-Thomas, 2003). Too often, Latin American macroeconomists find themselves explaining growth accelerations and collapses as phenomena being driven by the interactions between a natural-resource rich, sometimes semi-industrialized, economic structure, and the external conditions in terms of access to goods and assets international markets. Regarding these interactions, four main periods of globalization for Latin America can be identified. In the first one, called the “first globalization”, Latin American economies played an important role as providers of a variety of natural resources and other inputs to Western Europe, the world’s leading region (Bertola and Williamson, 2003). Terms of trade peaked, but the linkages went well beyond trade, involving foreign direct investment and London-based debt financing. This sort of integration gave many of LA economies a high dynamism, it did not necessarily provided to all of them what was required for sustainable growth. While countries like Argentina, Chile and Uruguay had an outstanding macroeconomic performance in the late nineteenth century and were among the countries with higher living standards, other countries such as Brazil experienced negligible growth during the same period (Maddison, 2007). The Great Depression and subsequent beggar-thy-neighbor policies changed the payoff matrix of the natural-resource intensive strategy of development. In this regard it is quite suggestive that terms of trade “pessimism” moved from Great Britain in the twenties (Keynes, 1923) to Latin America in the early fifties (Prebisch, 1951). As a matter of fact, the so-far successful natural resource-intensive strategy of development had to be revised. In the period between the wars, growth divergence within Latin American economies was dependent on the ability to accommodate to this new external context (see Díaz Alejandro, 1984). The new set of rules of the global game after the Second World War, usually referred-to as the Bretton Woods system, was consistent with a novel view of the way the economic system works: growth and development were now considered a matter of government policies. On the national front, state interventionism was needed to get full employment, while in the global economy, supranational public institutions, such as the International Monetary Fund and the World Bank, were needed for achieving a coordinated expansion of trade without the inconveniences of capital account convertibility. Latin American economies faced themselves with the challenge of discovering new sources of growth in an international context characterized by a downward trend for its traditional export basket prices and close-.
(7) A note on China’s development strategy and Latin American economies. 7. to-zero foreign private financing. Thus, it came as no surprise that, while in the United States or Europe public policies were oriented to stimulate domestic demand, in Latin America they tried to industrialize the economy as a way of promoting full employment and reducing the balance-of-payment constraints mentioned above -Keynesianism in advanced economies, structuralism in Latin America, according to Ocampo (2010). Again, the development outcome of the state-led industrialization strategy was heterogeneous, as Cardenas et al. (2003) show, with some countries (such us Brazil and Mexico) relatively outperforming others (such as Argentina and Chile). During the seventies, when even in the successful cases the costs (progressively lower growth and higher inflation) were already offsetting the benefits of industrialization, the global economy took a new turn. In this case, the cause was the collapse of the Bretton Woods system which paved the way to the reemergence of global finance. In this new era of globalization, with capital markets integration accompanied by floating exchange rates, Latin American economies started a new phase of structural change, this time including the removal of trade policies imposing tariff and non-tariff barriers over international trade (in many cases strongly affecting export performance) and the end of financial repression. New sources of external shocks and inadequate or virtually inexistent resilience provisions both at the national and at the supranational level led to a period of extreme volatility, with a sequence of growth accelerations and external debt crises resulting in a process of economic divergence with respect to the high income countries in practically all countries of the region (Bertola and Ocampo, 2012). But then again, at the beginning of this century a new configuration of the global economy was born, its key feature being, of course, the surge of Developing Asia, and particularly China, as the engine of global growth (Jacques, 2010). Indeed, the International Comparison Program recently estimated that in 2011 Chinese GDP was about 87% of that of the United States, and that China’s aggregate product may overtake that of US in 2014, which would mean the first “change of guard” of this kind since 1872 (see World Bank, 2014). And, as happened during the first globalization, the acceleration of global growth led to a boom in international trade, a change in global relative prices in favor of natural resources, and a structural transformation in global finance, with China emerging as one of the main capital exporters of the world (Williamson, 2011). As a result of these dynamics in global markets, economic growth, elusive in past decades, returned to Latin America. Is the Chinese emergence a development opportunity for Latin America? Is it possible to profit from the “new normal” of the global growth engines having moved to Asia? In what sense the natural resource strategy of development has returned to Latin America? Which are the pros and cons of it? In this paper we advance some.
(8) 8. evidence and offer some plausible but provisional answers to this questions. The paper reviews the rise of China as a key driver of global growth and the ongoing structural economic changes taking place in its development process (section 2); the impact of this “new world” driven by Asia on Latin American economies (section 3), as well as three major risks posed to their economic performance by this “new world”: dependency on natural resources, Dutch Disease, and the Natural Resource Curse (sections 4 and 5). Some preliminary thoughts about future challenges for Latin American economies are reviewed at the end of the paper..
(9) A note on China’s development strategy and Latin American economies. II. China. 9. as a driver of global growth. Since the death of Mao Zedong and the abrupt abortion of the Cultural Revolution, China has been subject to a continuous structural change. To make this continuum a discrete measure, we can rely on Cai et al. (2012)’s characterization of China’s modernization as a three sub-period process. The first one, the beginning of the “socialist modernization”, lasted from 1978 to 1988-90, and comprised the removal of several constraints in the rural sector. Basically, more favorable market prices for agricultural goods and the replacement of the People’s communes for the Household Responsibility System led to a boost in agricultural productivity, which in turn allowed the reallocation of huge quantities of labor from rural areas to smalls cities (and from farms to village enterprises and other types of collective enterprises) without increasing the risk of famine. The second period initiated with the now-mythical tour of Deng Xiaoping to the south to “spread the word” of reform in early nineties, involved an increasing trend towards domestic savings, a jump in foreign direct investment and a re-reallocation of labor, this time from small villages and rural areas to bigger, eastern cities, and from the collective enterprises to “foreign-invested” or state-owned enterprises. This period of “uninhibited investment” in terms of Cai et al. (2012), found its own limits both at the domestic level, with excess demand and rapid increases of real wages in several sectors of the labor market, and at the international level, with the global saving glut and the compression in world demand originated by the subprime crisis (Bernanke, 2005). Finally, the year 2011 saw a new government reorientation of the Chinese economy, marked by the guidelines of the 12th Five-year Plan of 2011, where the emphasis was put on moving China from a middle-income status to a high-income status, a code for (a) rebalancing domestic absorption from investment to consumption; (b) rebalancing GDP structure, from light manufacturing to high-tech goods and services; and (c) moving to greener production technologies. These three drivers of structural change, according to the 2011 Plan, will result in a more sustainable, inclusive, green, but also lower economic growth in the next two decades. Given that the first stage of structural change was basically inward oriented, it did not represent a big disruption for the global economy (which was certainly true for Latin American economies). In contrast, the second stage of reform produced dramatic changes in the international economy, fueling deep structural transformations in good markets, and more recently, mutations in capital markets as well..
(10) 10. The changes were impressive. In international trade, in a context in which the degree of integration records historical highs, China has overtaken Germany, Japan and the United States and is now the country with the largest global interconnections (IMF, 2011). In international finance, China has become one of the leading exporters of capital in the world in the period 2003-2012, surpassing Germany and the United States (IMF 2013). And, as Subramanian (2011) summarizes in his historical review of global dominance, “the economic dominance of China relative to the United States is more imminent (it may already have begun), will be more broad-based (covering wealth, trade, external finance and currency), and could be as large in magnitude in the next 20 years as that of the United Kingdom in the halcyon days of empire or the United States in the aftermath of World War II”. In fact, according to Subramanian (2010) and the World Bank’s International Comparison Program (2014), “official” PPP data for China underestimate its GDP level, and a more accurate estimate will yield a much bigger size of the Chinese economy that it may have overtaken that of the United States in 2014.. Figure 1. GDP levels (logs, 1990 Geary-Khamis million dollars). Source: Maddison (2007) and The Conference Board.. Controversies aside about the dating of the change of guard, Chinese growth record during the last decades stands out. Figure 1 plots the long run evolution of PPP GDPs in the three successive leading economies, the United Kingdom, the United States, and China. The first thing to note is that, according to Maddison’s.
(11) A NOTE ON ChINA’S DEVELOPMENT STRATEGY AND LATIN AMERICAN ECONOMIES. 11. data, China was the leading economy at the beginning of the 19th century, which provides empirical content to Henry Kissinger’s 2012 famous phrase, “China does not see itself as a rising, but a returning power”. From the early 1800s to the mid-1900s, China’s GDP somewhat remained at the same level, while population grew at 0.3% per year. This downward trend in per capita GDP in a context of an acceleration of growth in the Western world led to the end of China’s supremacy, in a process that Pomeranz (2000) coined “the great divergence”. After the “century of humiliation”, economic growth returned to China in mid-fifties, and this process accelerated markedly with the beginning of modernization.. Figure 2. Changes in global growth and the role of China (share of world GDP, PPP). Source: Own calculations based on IMF data.. For our purposes, it is better to concentrate the analysis on the modernization period –and in particular on the second and third stage of it. Figure 2 exhibits the evolution of the share of China, the United States, Japan, and Europe in total GDP (in PPP terms) during this period. One can see in this Figure that over the last two decades the world experienced fundamental changes in the configuration of its growth dynamics. In essence, the novelty was the displacement of the engine of global growth from the advanced world to the emerging world (mainly China and India). Indeed, between 2002 and 2013 developing and emerging economies expanded on average by 6.3% annually, while developed economies average yearly expansion was only 1.6%. Thus, the participation of emerging economies in global.
(12) 12. output increased from 38 % to 50%. And this is not considered to be a transient phenomenon as noted in OECD (2010), it is a structural change “in which the world’s economic centre of gravity has moved towards the East and South, from OECD members to emerging economies”. The contrast with the global dynamics of past decades is marked. In the period 1980-1999 the convergence of GDP in PPP terms was rather moderate, so that emerging contributed between 30 % and 38 % to the overall product. And it is quite clear that China was the main driver of this change. In fact, one-fifth of world output is generated in China today, while a decade ago it only contributed some 5 per cent. The changes in world GDP dynamics represent the main (but not the sole) indicator of the increasing importance of China in the global economy. International trade indicators will show an even deeper structural change. As it is exhibited in Figure 3a, Chinese’s exports increased dramatically since the WTO membership, and the trend may even accelerate when it achieves the market-economy status in 2016. In fact, China is now the largest exporter of the world. Even without being also the first, but “only” the second world’s largest importer, its centrality in global trade is indisputable, displacing the United States and Germany. Its trade connections with the rest of the world increased significantly in the first decade of the twentyfirst century: according to IMF’s China Spillover Report (2011), in 2010 China represented the first or second largest trading partner for 78 countries (totaling 55% of global GDP) when in 2000 barely reached 13 countries (15% of global GDP).. Figure 3 International trade and finance (a) Exports of goods (USD billion). Source: IMF and Milesi-Ferretti (2007).. (b) International investment position (USD billion).
(13) 13. A note on China’s development strategy and Latin American economies. Figure 3b shows that structural changes in the global economy went far beyond trade. It exhibits the evolution of net international investment position (external assets less external liabilities) in current dollars of the top world creditors, according to Lane and Milesi-Ferretti (2007) updated database. In 2011, the top-four happened to be China, Germany, Japan and Saudi Arabia. The increasing role of China as a “global financier” along the last ten years or so make the Asian country a key player in international finance. Even with the recent renminbi appreciation trend, Chinese net foreign assets totalized 1,700 billion dollars, surpassing Germany and oil-rich countries such as Saudi Arabia. If we add up Japan and China, it is clear that one of the features of the post-crisis world economy will be a new pax asiatica, marked by the emergence of Asia as the main source of funds for the rest of the world (including other developing countries).. Figure 4. Structure of foreign trade in China (a) Exports 100% 80%. 5% 21%. 100% 22%. 23%. 40% 40% 20%. 34%. 13% 80%. 20%. 60%. 32%. 11% 20%. 10% 6%. 1990. 2000. 60%. 46%. 40%. 41%. 0%. (b) Imports. 9% 2% 2013. 17% 20% 0%. 12%. 28%. 29%. 30%. 20%. 12%. 4% 13%. 15%. 11%. 14%. 1990. 2000. Others. High-tech manufactures. Medium-tech manufactures. Low-tech manufactures. NR-based manufactures. Commodities. 27% 2013. Source: Own elaboration based on ECLAC and IMF.. How did these new developments change the conditions in different goods and asset markets? First, note that the breakdown of China’s exports and imports patterns shows why the emergence of China involves deep changes in global markets: it is a country that exports industrial manufactures (about 70% of total exports) and increasingly imports commodities and natural resource-related manufactures (more than a third of total imports). Behind this change in the structure of imports are of course the features of the China’s development model: rapid urbanization and the.
(14) 14. investment boom, for example, accounted for much of the dramatic increase in its imports of minerals (Yu, 2011). Regarding agricultural products, China’s exports are concentrated in labor-intensive horticultural goods, such us fresh fruits, while China’s most dynamic imports were relatively tariff-free, labor-intensive goods, such as soybeans or processed animal feed. Along with the change in the structure of production and exports, China has been leading global value chains for industrial products that captured markets traditionally controlled by European and American producers (Banga, 2013). This change in China’s external trade composition had strong impacts on relative prices. The “China effect” generated demand pressures in commodity markets and supply pressures in industrial markets. Thus, the real prices of primary goods have followed an upward trend, reversing in part what happened throughout the second half of the twentieth century (Arezki et al., 2013; Albrieu, 2012). From a historical perspective, this is not a new phenomenon. In fact, the growth acceleration during the first globalization caused a boom in the real price of commodities (Williamson, 2011), and concerns about terms of trade were widespread in industrial countries (as Keynes quotation above shows).. Figure 5. The importance of Chinese demand in commodity markets (net imports / total world imports) 35. 70. 30. 60. 25. 50. 20. 40. 15. 30. 10. 20. 5. 10 0. 0 Food. Energy 1995. Raw Metals Materials 2000. Oil 2005. Soybeans. Iron Ore. 2010. Source: Own calculations based on IMF.. The growth of China as a global commodity buyer has been impressive. In the case of metals, for example, net imports from China accounted for just 4% in 1995 and in 2009 touched 30% (see figure 5a). In the case of food and energy, the share of China in total imports still does not exceed 10%, but this is precisely the markets where China will have a dramatically growing importance in the coming decades (Gallagher.
(15) A note on China’s development strategy and Latin American economies. 15. and Porzecanski, 2010). According to Streifel (2006), China is the world’s largest consumer of aluminum, copper, iron, nickel, silver, coal, cotton, rice and corn. As shown in figure 6b, in the case of soybeans and minerals such as copper and silver, the relevance of China has been exponential. In fact, the latest estimates point to a 50% share of the Chinese demand in these markets (see IMF, 2011). Regarding financial assets, the Chinese export-oriented growth strategy led to an increase in the global savings rate, causing a reduction in the worldwide cost of funding and a consequent increase in the risk appetite of global financial institutions (Bernanke, 2005). But, in contrast with other capital exporters, the excess of savings over investment in China and other emerging economies is mainly allocated in safe assets, i.e., those insensitive to information -”secrets free” assets in terms of Gorton (2012). Consider the composition of foreign assets of the four largest capital exporters in figure 3b for 2011, from Lane and Milesi-Ferretti’s updated database (2007). Both Germany and Japan allocate more than eight of every ten dollars in risky instruments, while in China and Saudi Arabia the bulk of the assets are built in foreign reserves. But China stands out; seven out of ten dollars are allocated to these liquid, secret-free assets. Of course, only developed countries can supply this class of assets. Since its issuance by the public sector is relatively inelastic, it was the (private) international financial system the one in charge of providing them through novel techniques of pooling, tranching and risk sharing that later proved to be too risky. The combination of these stress factors, together with further deregulation of financial markets, was at the heart of the global crisis that began with the collapse of the markets for subprime mortgages in the United States and other developed countries (Obstfeld and Rogoff, 2009). What about direct investment? Two main policies must be mentioned in this regard. The first one was the “open door” policy regarding foreign capital investment implemented since the early nineties. As Deng Xiaoping stated as early as 1989, “joint ventures involving foreign capital should be set up (…) If we absorb foreign capital, it will surely benefit foreign businessmen, but we too shall benefit eventually” (as quoted in Coase and Wang, 2013). This feature, the attraction of foreign capital as an integrating part of the development model, was a novel feature in Asia: nor Japan neither the Newly Industrialized Economies relied on foreign direct investment (FDI) inflows for catching up to advanced economies (Jacques, 2010). This FDI, which accounted for about one-fifth of total investment circa 1995, was mainly directed to labour-intensive activities, which served as a complement to the labor force that was being reallocated in the cities. The second policy, implemented more recently, has to do with outward foreign investment. As a result China has become one of the main sources of foreign.
(16) 16. investment worldwide. In an October 2013 article, The Economist asked whether it is the “Rockefeller moment” for China, given the increasing presence of the Asian economy in both emerging and developed countries. In developing regions, Chinese foreign direct investment driven by state-owned enterprises increased sharply during the last five years, mainly attempting to secure key inputs (manufactures in East Asia, energy and agricultural goods in Africa and Latin America). Some private and foreign invested enterprises of China also increased its outward FDI, this time as part of a strategy to diminishing transaction costs and competing in new markets.. Figure 6 China’s Foreign Direct Investment Stocks (% of GDP) 18 16. Inward FDI. 14. Outward FDI. 12 10 8 6 4 2 0 1980 Source: UNCTAD.. 1985. 1990. 1995. 2000. 2005. 2010.
(17) A note on China’s development strategy and Latin American economies. III. The Latin American. 17. connection. How Latin America fits into this new global configuration? On the one hand, global growth led by emerging economies produced a significant improvement in the terms of trade in the region, surpassing even the record-highs of the early seventies and the first decade of the twentieth century (see figure 7). In relation to the 19002013 average, the terms of trade for Latin America in the first decade of the century reached 140% in 2012 (Ros, 2013). Prebisch (1950)’s pessimism failed to realize during this period, and Keynes’ fears returned to advanced economies. Moreover, the effect was not only related to prices: the growth in export volumes yielded some 4.3% per year in 2004-2013. This combination of improvements in prices and quantities made the opening of the economies in the region to grow sharply, as long as China was gradually becoming the main destination of the region’s products: while in 2000 less than 1% of export proceeds came from China, in 2012 exceeded 7%. Even though largely absent in the global value chains in which China is involved, Latin American countries managed to become a crucial link in the process of global growth led by China, acting as the main extra-regional supplier of primary goods to China.. Figure 7. Latin American terms of trade, 1900-2014 160 140 120 100 80 60 40. Moxlad. 20. Eclac. Source: Own elaboration based on ECLAC data.. 2009. 1999. 1989. 1979. 1969. 1960. 1950. 1940. 1930. 1920. 1910. 1900. 0.
(18) 18. Did this have an effect on economic growth? Latin America experienced a natural resources boom period between 2003 and 2008, and it managed to grow above developing economies after the Subprime crisis. During the booming years, GDP per capita expanded systematically in all years and at an average annual rate of 4%, with an additional feature: the expansion was widespread. For one thing, all Latin American and the Caribbean countries registered a positive growth in the 2007-08 biennium. As it happened in the rest of the world, the international crisis ended this high-growth period and regional GDP per capita shrank by 2.9 % in 2009. Then in 2010-2013, growth somewhat returned, though still influenced by global instability mainly from Europe and the United States monetary policy. In sum, growth rates accelerated markedly in the region in response to this new global model, and the risk of a growth reversal became lower than in recent growth episodes. The performance of the region in this decade was also remarkable in historical terms: we must go back to the late sixties / early seventies to find a similar scenario of high, sustained, and widespread growth in Latin America. Interestingly, the growth episode of the last decade finally allowed Latin American countries to accommodate to the structural change that had been underway in the region at least since the mid-seventies, namely the dismantling of the state-led industrialization model (as it was called by Cardenas et al., 2003) prevailing over the fifties and sixties. In fact, since the mid-seventies development strategies in the region were based on structural reforms, in which the agenda of trade liberalisation and bias towards comparative advantages were important pillars (Fanelli, 2007). As detailed in Ocampo and Ros (2011) and Rozenwurcel (2011), leaving aside the cases of Chile and Dominican Republic, the macroeconomic outcome by the beginning of 21th century was not encouraging. Instead of economic growth, reforms came with macroeconomic volatility: two cycles of expansion and crisis led to a GDP per capita that barely expanded by 1% per year between 1975 and 2000. Beyond the common features of this new episode, when one analyzes countryspecific performances, what stands out is heterogeneity. While some countries expanded almost at “Chinese” rates, others grew more in line with the world average. Albrieu and Fanelli (2010) and IDB (2011) show that a relevant factor in explaining these differences is the geographical orientation of exports and the ability to participate in the new dynamics of global growth (see Table 1 for information). Of course, trade specialization was key: in South American countries, the share of exports associated with commodities is significantly higher than in the countries of Central America and Mexico (in 2012, more than 85% in the Andean community,.
(19) 19. A note on China’s development strategy and Latin American economies. 70% in MERCOSUR plus Bolivia, while only 35% in Mexico and the MCCA). That is why the boom in the terms of trade has concentrated in the sub-region of South America, not in all Latin America. Indeed in Central American countries over 20032008 terms of trade deteriorated sharply.. Table 1 Growth during the boom, specialization and exports to China (% of total exports in 2010, unless specified) Commodities Argentina Bolivia Brazil Chile Colombia Costa Rica Ecuador El Salvador Guatemala Haiti Honduras Mexico Nicaragua Panama Paraguay Peru Dominican Rep. Uruguay Venezuela. NR-related manufactures. 45,17 79,64 48,98 35,94 59,52 25,62 78,26 6,80 36,75 14,75 45,4 16,25 60,17 3,84 79,07 45,34 11,31 57,82 67,69. Latin America 43,07 South America 59,74 Mexico and Central America 24,54 Source: Own elaboration based on ECLAC and IMF.. Total NRrelated. Exports to China. GDP growth 2003-2010. 20,55 14,55 19,53 54,57 15,48 16,87 13,05 20,89 23,07 8,20 16,55 8,56 21,92 6,21 12,11 23,70 25,29 19,29 28,97. 65,72 94,19 68,51 90,52 75,00 42,49 91,32 27,70 59,82 22,95 61,95 24,81 82,09 10,05 91,18 69,04 36,61 77,11 96,66. 15,98 16,15 28,26 47,10 9,28 12,82 5,61 1,60 4,65 0,00 4,76 3,22 3,73 2,19 2,58 25,34 3,56 7,74 10,69. 7,62 4,29 4,06 3,99 4,61 4,87 4,48 1,88 3,40 0,36 4,31 2,21 3,21 7,64 4,87 6,48 5,74 6,49 5,01. 19,44 22,18. 62,51 81,92. 10,80 16,88. 4,50 5,19. 16,40. 40,94. 4,06. 3,74. A second differentiating factor is related to the role of remittances in the dynamics of the balance of payments. In Central American countries transfers from workers residing in the United States is one of the leading providers of foreign currency. In fact, in countries such as Honduras, Haiti and El Salvador the amount of remittances currently amounts to around 15% / 20% of GDP, about 80% coming from the United States (see Ratha and Shaw, 2007). In that sense, rather than the Asian dynamics, the prospective evolution of the U.S. economy in terms of aggregate demand and employment is critical to these economies..
(20) 20. At the same time, in the “commodity lottery”, as was called by Diaz Alejandro (1984), the exporters of metals and fuels were benefited the most, while countries specialized in agricultural commodities benefited but more moderately. The resulting diversity is evident in Figure 8, which shows that the terms of trade gains from Venezuela or Chile during the boom were much higher than those of Brazil and Argentina, while El Salvador, where 40% of imports is commodity-related, recorded a fall in the terms of trade. In addition, the combination of divergences not only in price dynamics but also in export quantities led to the purchasing power of exports followed a somewhat different dynamic to the terms of trade. However, differentiating between South America -as “winners” in the new global dynamic- and Mexico and Central America -injured as “losers”- is still valid.. Figure 8 Change in terms of trade and purchasing power of exports during the boom: 2008 vs 2003 Venezuela Uruguay -9 Dom. Rep. -9 Peru Paraguay Panama -10 Nicaragua -9 Mexico Honduras -11 Haití -17 Guatemala -6 El Salvador -5 Ecuador Cuba Costa Rica -10 Colombia Chile Brazil Bolivia Argentina -20. Venezuela Uruguay 152 Dom. Rep. -2 Peru Paraguay Panama Nicaragua Mexico Honduras Haití Guatemala El Salvador Ecuador Cuba Costa Rica Colombia Chile Brazil Bolivia Argentina. 32. 8 7. 35. 11. 45 49. 23. 45. 20 0. 20. 40. 60. 80. -20 100. 166. 76 101. 7 9 8. 36. 52. 141. 61. 20 93 37 73. 112 102 103 157. 77 30. 80. 130. 180. Source: Own elaboration based on ECLAC.. Besides trade, what happened regarding finance? While other emerging Asian countries constitute the main destination of China’s outward FDI, there is an increasing involvement in Latin American business. In contrast to FDI coming from Europe and the United States, Chinese investments are concentrated in natural resource sectors. ECLAC (2013) estimated that, while the share of natural resources sectors in total inward FDI to Latin America is some 25%, the share of Chinese FDI is some 90%, and the remaining (non-natural resource related) investment is basically concentrated in the biggest markets, Brazil and Mezxico (Perez Ludueña, 2012). Chinese FDI in natural resources, in turn, orientated mainly to oil and mining. Regarding the first, major investments were made in Brazil (by the stateowned enterprises Sinopec and Sinochen), Argentina (by Sinopec and CNOOC), and Venezuela (by CNPC). Regarding the second, Brazil and Peru combined accounted.
(21) 21. A note on China’s development strategy and Latin American economies. for one quarter of the top ten destinations for Chinese FDI in mining (See Kotschwar et al., 2012). Interestingly, beyond the common goal of securing natural resources and key inputs, Chinese approach to Latin American countries has been uneven. In its analysis of the evolution of Chinese investments in Peru’s mining, Fairlie (2013) detects two types of outcomes. In the first place, some enterprises have promoted the creation of production and knowledge networks around the mining exploitation, while mitigated its social and environmental costs. It is the case of Chinalco, who operates a mine in Toromocho since 2008. In contrast, other enterprises did not worry that much about international standards, national laws, local rules and social norms, and such a behavior had resulted in deep conflicts and a local population reluctant to welcome Chinese FDI. This is the case of the Zijing Mining Group.. Figure 9 Patterns of foreign direct investment to Latin America 100%. 10%. 80% 60%. 75% 90%. 40%. Manufacturing and services Natural resources. 20% 25% 0% Total FDI. Chinese FDI. Source: ECLAC (2013). Note: total FDI: average 2007-2011. Chinese FDI c.2010.. Although data opaqueness, it is also possible to detect an increasing trend of the Chinese share in Latin American debt markets. According to the China-Latin America Finance Database, since 2005 (state-owned) Chinese banks –mainly the China Development Bank- provided finance to Latin American economies for.
(22) 22. some 75 billion dollars, overtaking traditional International Financial Institutions (IFIs), such us the World Bank and the Inter-American Development Bank. While the bulk of the loans went to infrastructure and energy, it is clear that they are more guided by geopolitical reasons than purely economic reasons. For one thing, Venezuela, Argentina and Ecuador are three of the four main destinations of Chinese finance (the fourth is Brazil). They are countries that seem to be reluctant to accept conditionality provisions of IFIs. As Gallagher et al. (2013) states, “Chinese banks provides financing to significantly different set of countries than the IFIs and Western banks”, and that is why “Chinese lending is adding to, rather than replacing” IFIs lending to the region..
(23) A note on China’s development strategy and Latin American economies. IV. Issues. in debate and growth. I. Dependency,. 23. concentration. The role of natural resources is part of the Latin American development agenda for the last 150 years. The emergence of China put this issue at the center of the scene. In order to focus on this topic, hereinafter we will show the macroeconomic record of a subset of Latin American countries, i.g., those that are natural-resource rich. On the academic front, the debate is open. On the one hand, the neoprebischian vision is rather pessimistic: “the nature of the process of acquiring higher technological capabilities is such that a country trying to catch up with a more technologically advanced country needs to set up and protect industries in which it does not have comparative advantage” (Ha-Joon Chang, 2012). On the other hand, there is also a neo-Ricardian view, which thinks otherwise: “the economic development of a country should pragmatically exploit the opportunities inherent in the activities in which the country has comparative advantage” (Lin, 2012). On the empirical front, heterogeneity dominates. There is evidence of many resource-rich countries that, despite their wealth, performed poorly -even worse than other countries with few natural resources (see Humphreys et al., 2007)-. But countries such as Chile or Botswana managed to become developing their economies by exploiting comparative advantages. On the one hand, a set of works written during the past decades conducted several cross-country regressions and concluded that developing economies with abundant natural resources tend to be delayed in macroeconomic and distributional terms. Sachs and Warner (1995, 2001) provided the most influential empirical studies supporting this hypothesis. They found that there is an inverse relationship between the intensity of natural resources and economic growth and conclude that “except for the direct contribution of the primary sector (...) the resource-rich countries have consistently failed in their attempts to achieve export-led growth or any other kind of growth” (Sachs and Warner, 2001). On the other hand, however, new empirical studies aimed at testing the robustness of the findings of Sachs and Warner provided a different picture, where the curse of natural resources either is conditional on the occurrence of other factors (Dunning, 2005) or becomes a blessing (Lederman and Maloney, 2007)..
(24) 24. Table 2 shows a set of estimates that allow us to highlight these debates. The standard strategy to test the relationship between natural resource abundance and economic growth is based on the following equation. Where Yi is the real GDP of country i in period 1, NR is a variable that captures the intensity of natural resources and Xi is a set of “usual” variables to explain growth. More specifically, “lgdpea7090” is the logarithm of GDP per capita for the year 1970, “voltot” is the volatility of the terms of trade between 1970 and 2011, “sopen” is the fraction of the period 1970-1990 in which the authors consider that the economy is open to trade, “rl” is the indicator of Rule of Law and “linv7089” is the logarithm of the average ratio Investment/GDP from 1970 to 1989 in real terms. Finally, the variables “sxp”, “sxp2” and “sxp3” are alternative measures of natural resource abundance.. Table 2 Natural resources and economic growth. Some cross country results (a) ldgpea70 sxp spx2 spx3 voltot sopen linv7089 rl dtt7090 constante. -0,1 -0,5 9,47 *** -4,73 3,33 1,86. (b) -1,82 -8,89 -8,75 -5,59 -0,02 -1,34 1,19 3,12 0,64 2,09 0,41 4,09 0,13 2,69 14,57 8,51. * p<0.05, ** p<0.01, *** p<0.001 Source: Own elaboration.. *** ***. * ** * *** ** ***. (c). (d). 0,24 1,06 -0,01 -0,46 2,25 0,4. -1,71 -6,51 -0,01 0,39 -0,04 -3,88 1,58 3,3 0,37 0,99 0,42 3,35 0,2 3,39 14,02 6,2. ***. *** **. ** ** ***. (e). (f). 0,06 0,25 0 1,22 0,56 0,3. -1,73 -6,93 7E-05 1,19 -0,04 -4,16 1,61 3,5 0,41 1,11 0,38 3,02 0,18 3,1 13,75 6,65. ***. *** ***. ** ** ***.
(25) A note on China’s development strategy and Latin American economies. 25. Columns (a) and (b) show the original estimates of Sachs and Warner (1995), where the inverse relationship between natural resource intensity (measured by the natural resources exports to GDP) and economic growth is observed. The relationship between the two variables is negative and significant. However, different specifications with alternative measures of resource abundance, groups of countries and periods of analysis give different results (van der Ploeg, 2010). The columns (c) and (d) for example, estimated the regression taking as a measure of resource abundance natural wealth per capita. In these estimates the effect of resource abundance on growth is not significant. Estimates using primary exports per capita yield similar results -columns (e) and (f)-. In the search for omitted variables, columns (b), (c) and (f) re-estimated the equation adding the volatility of the terms of trade recorded in the period 19702010 as an explanatory variable. There is new evidence that supports a different hypothesis: it is the dependence on natural resources, instead of its abundance, that hurts growth. Indeed, Blattman et al. (2007) in his study of the period from 1870 to 1939 and van de Ploeg and Poelhekke (2009) for the 1970-2003 period arrive at the same result: the main channel connecting the abundance of natural resources to poor macroeconomic performance is aggregate volatility, which is particularly true during periods of greater openness to the world economy (Loayza and Raddatz, 2007). Is Latin America rich in natural resources? To answer this question we will use the recent estimates by the World Bank of the natural wealth (World Bank, 2010). Figure 10a shows the different components of the natural wealth of Latin America in per capita terms in relation to resource-rich countries that belong to the high-income group (Australia, Canada, New Zealand and Norway). There stands a stylized fact: Latin America has a lower level of natural resource endowments than that observed in natural resource rich countries. In fact, the total value of natural wealth per capita in Latin America in 2005 was 27% of the value estimated for the rich countries. Only in the items “land for cultivation” and “hydrocarbon reserves” Latin America’s endowment is near that of rich economies. Of course, as discussed in Sinnott et al. (2009), the stock of natural capital can be considered at some point endogenous, depending crucially on both tasks of exploration and discovery that differ across countries. Figure 10b provides relevant information on the second stylized fact: the region is more dependent on natural resources than countries with abundant natural resources belonging to high income group. The concentration of exports in commodities is significantly higher in Latin America. The share of commodity exports in total exports and GDP is also slightly larger, although the dependence manifests itself most clearly in the fiscal accounts: about a quarter of the tax revenue of the Latin American central governments derives from natural resources, while in rich countries it does not exceed 10%..
(26) 26. Figure 10 Natural resources in Latin America: Abundance and dependence (a). Natural wealth per capita. (b) Natural resources dependency Commodity exports share in total exports. Subsoil assets. Timber resources. 66,8. Pasture land. 25% 13%. Hydrocarbon 58% reserves. 27%. 27%. Natural capital. 63%. 61,5. Comm. Revenues / total revenues. 15.6. 23,8 9,4. Crop land Comm. Revenues / GDP 6.2. 4,7. Commodity exports / GDP 16.5. 0.08 0.15. Comm. Exports concentration. Source. Sinnot et al. (2009).. What about volatility? Are Latin American terms of trade more volatile than in other regions of the world? The following figure shows the volatility of the terms of trade in the period 1980-2010 in different regions of the world. Note here that Latin America is among the regions with the highest occurrence of external trade shocks, behind the Middle East and Africa. In sum, Latin America is a region with a highly dependence on natural resources, which in turn makes it vulnerable to changes in global trade.. Figure 11 Terms of trade volatility. Latin America in comparative perspective (standard deviation, 1980-2010) 35 30 25 20 15 10 5 0 Middle East & North Africa. Source: WDI.. Sub- South Asia North Europe & Latin East Asia Saharan America Central America & & Pacific Africa Asia Caribbean.
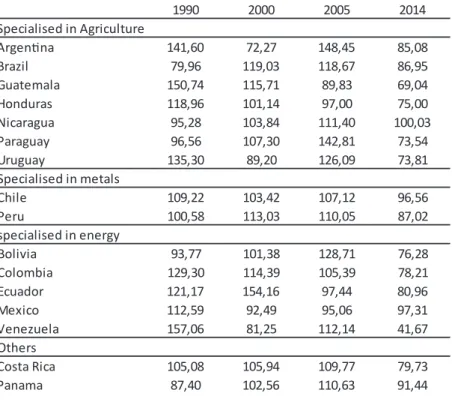
(27) 27. A note on China’s development strategy and Latin American economies. A second issue in debate is the risk of the so-called Dutch Disease (Corden and Neary, 1982). The strong inflow of foreign exchange caused by a natural resource boom tends to press down the real exchange rate, either via nominal appreciation or via inflation in the nontradable sector, resulting in a loss of exchange-rate competitiveness. This, the theory goes, can affect negatively the performance of tradable sectors which were not benefited from the boom -mainly industrial sectors-.. Table 3 Evolution of real exchange rates (bilateral with US, av. 1990-2004 = 100) Specialised in Agriculture Argentina Brazil Guatemala Honduras Nicaragua Paraguay Uruguay Specialised in metals Chile Peru specialised in energy Bolivia Colombia Ecuador Mexico Venezuela Others Costa Rica Panama. 1990. 2000. 2005. 2014. 141,60 79,96 150,74 118,96 95,28 96,56 135,30. 72,27 119,03 115,71 101,14 103,84 107,30 89,20. 148,45 118,67 89,83 97,00 111,40 142,81 126,09. 85,08 86,95 69,04 75,00 100,03 73,54 73,81. 109,22 100,58. 103,42 113,03. 107,12 110,05. 96,56 87,02. 93,77 129,30 121,17 112,59 157,06. 101,38 114,39 154,16 92,49 81,25. 128,71 105,39 97,44 95,06 112,14. 76,28 78,21 80,96 97,31 41,67. 105,08 87,40. 105,94 102,56. 109,77 110,63. 79,73 91,44. Source: Own elaboration based on ECLAC.. One of the likely symptoms of Dutch Disease is the appreciation of the exchange rate. As a matter of fact, according to Albrieu (2012) in an event study for the 19602010 period, natural resource shocks to Latin American economies were followed by an appreciation of the real exchange rate close to 10%, during the two years after the shock. What happened in the recent boom? Table 3 shows the evolution of the real effective exchange rate in recent decades. Compared to the levels recorded in the peak of the boom, nearly all of the natural resource rich countries have appreciated.
(28) 28. its exchange rate, in particular countries specialized in agriculture and energy. Furthermore, competitiveness decreased not only relative to the boom but also in historical terms. The most notorious cases of real appreciation were those of Argentina, Brazil, Uruguay and Venezuela, where the accumulated change between 2005 and 2014 was above 30%. In the cases of Brazil and Colombia it also operated a financial factor: the strong capital inflows in a context of high interest rate differentials.. Table 4. Evolution of exports in Latin America 2004 Natural resource related Specialised in Agriculture Argen na Brazil Guatemala Paraguay Specialised in Metals Chile Peru Specialised in Energy Bolivia Colombia Ecuador Mexico Venezuela Others Costa Rica Dom. Rep. El Salvador. Primary. Manufactures. 47% 31% 38% 73%. 26% 22% 24% 17%. 38% 37%. Industrial. c. 2013 Natural resource related. Industrial. Average growth rate Natural resource related memo: Industrial Popula on Primary Manufactures. Primary. Manufactures. 27% 47% 39% 10%. 47% 48% 36% 59%. 19% 19% 24% 10%. 34% 34% 40% 31%. 10.6% 15.1% 13.2% 17.7%. 7.0% 8.3% 13.9% 14.2%. 13.4% 6.5% 14.1% 32.2%. 0.9% 1.1% 2.4% 1.8%. 51% 30%. 10% 33%. 42% 47%. 48% 22%. 11% 31%. 10.3% 19.1%. 8.7% 12.0%. 9.5% 15.3%. 1.0% 1.1%. 68% 45% 80% 15% 83%. 19% 18% 14% 7% 7%. 13% 37% 6% 78% 10%. 77% 68% 80% 17% 67%. 11% 13% 13% 8% 30%. 12% 19% 7% 74% 2%. 22.3% 18.5% 13.3% 9.0% 12.1%. 13.7% 10.4% 12.2% 10.1% 31.4%. 19.4% 6.8% 14.6% 7.0% -3.5%. 1.7% 1.5% 1.7% 1.2% 1.7%. 26% 4% 6%. 14% 13% 13%. 60% 82% 81%. 25% 10% 6%. 18% 19% 22%. 58% 71% 72%. 6.5% 10.9% 6.7%. 9.4% 5.6% 11.4%. 6.7% 0.0% 4.3%. 1.6% 1.5% 0.5%. Source: ECLAC.. The second possible symptom of Dutch Disease is deindustrialization. The evidence about past events shows that as a general rule this feature has not been present: manufactured exports as a percentage of total exports did not change the trend after the shock in previous booms. Was also this the case in the recent boom? The picture that emerges is heterogeneous. In some agricultural-based countries, such as Argentina, industrial exports’ share in total exports did not decrease during the last decade but in others it certainly did. In Brazil, for example, industrial exports’ share in total exports diminished dramatically, from 49% in 2000 to 29% in 2012. As was already mentioned, in the Brazilian case financial factors were also key, as monetary policy failed to counteract natural-resource driven balance of payments pressures -they may indeed have amplified these pressures, as is suggested in Markwald and Ribeiro (2012) and Albrieu (2011)-. Nevertheless, pure “Corden-like” effects were absent, given that in all agricultural countries industrial exports increased in dollar terms and in per capita terms, albeit with significant differences -in Brazil they grew in current dollars at 6% per year, while in Argentina they did it at 13%. In order to analyze “de-tech” or primarization trends, Table 4 also exhibits the composition of natural-resource (NR) related exports in terms of its value-added content. In Brazil NR manufactures decreased its share during the last decade. Argentina’s evolution shows a different record given that the increase.
(29) A note on China’s development strategy and Latin American economies. 29. in the share of industrial exports matched a drop in NR manufactures (see Fanelli and Albrieu, 2013). In metal-intensive countries (i.e. Chile and Peru), deindustrialization forces somewhat deepened during the boom of 2004-2013, with natural-resource related exports increasing its share in total exports, but both natural resource-related and industrial exports grew at almost double-digit average annual rates. The Peruvian and Chilean cases are remarkable, provided that between 2004 and 2013 terms of trade increased by some 30% / 40% and government policies were able to mitigate deindustrialization forces. In the Chilean case, human capital accumulation around copper exports made possible to export professional services associated to copper extraction and manufacturing (Arellano, 2012). Anyway, as in agricultural-rich Argentina and Paraguay, in Chile and Peru NR manufactures grew less than both primary exports and industrial exports, reflecting that it may be more difficult to climb the technological ladder through natural resources (for an analysis of Latin American opportunities regarding this point, see Vaillant and Rovira, 2012). What happened in energy-based countries, where the terms of trade boom were the biggest in the region? Three different situations can be identified. In Bolivia and Ecuador natural resource related exports and industrial exports grew at a very similar pace, resulting in a largely invariant export structure; in Colombia and Mexico industrial exports somewhat diminished its importance growing at 6% / 7% per year, while in Venezuela they decreased in absolute terms. In terms of technological content, the picture is rather different. In all countries but Venezuela and Ecuador primary exports increased its share in total exports. The most remarkable case is Colombia, where primary exports grew three times faster than industrial exports, and the share of the former went from 45% in 2004 to 68% in 2013. Trade as well as fiscal policies tried to mitigate this trend, but they failed (Martinez, 2012). In contrast, in Venezuela industrial exports decreased, but NR manufactures increased its share in total exports. These trends can be linked directly to new role of Asia in deflating the global industrial markets that we discussed in section 2. In particular, the penetration of China in global industrial markets has been impressive in the last decade: if in 2000 China’s industrial exports accounted for 4% of total industrial exports, by 2010 the share rose to 14%. Following the line of Lall and Weiss (2005), Gallagher and Porzecanski (2010) estimate this new component of the “China effect” through changes in the share of this country and Latin America in the global markets of industrial manufactures. More specifically, the authors detected a “direct threat” from China on a manufactured sector in a Latin American country if the market share of the first is growing while the.
(30) 30. second is decreasing. There is an “indirect threat” when the market share of the two countries is growing, but China´s grows at a faster rate. The figure below shows the estimates of the threat of China on Latin America. About 60% of exports of industrial manufactures in Latin America is under direct threat from China, while indirect threat reaches another 32%. In other words, 9 out of every 10 dollars of income by industrial exports from Latin America are coming from global markets where China is increasing its market share. Disaggregating the data, Mexico is the country where the challenge is more important: 70% of Mexico’s exports go to markets where its share is declining while that of China is increasing.. Figure 11 Percent of exports of industrial manufactures under threat of China. Latin America. Mexico. Costa Rica. Direct. Colombia. Chile. Brazil. Indirect. Argentina. 100 90 80 70 60 50 40 30 20 10 0. Source: Gallagher and Porzecanski (2010).. The third symptom of Dutch disease is related to the external front: the eventual emergence of current account deficits. What happened in recent years? The picture can be seen in Table 5 below. Except in Bolivia, Paraguay and Venezuela, the other countries either show current accounts in balance or deficit in 2013/4. For commodity producers in the South, this contrasts sharply with what happened in 2005, when they registered current account surpluses. For the countries in the north, mainly being commodity importers, current account deficits were the norm throughout the period..
(31) 31. A note on China’s development strategy and Latin American economies. Table 5. Current Account balances in Latin America (% of GDP) Commodities Argentina Bolivia Brazil Chile Colombia Costa Rica Ecuador El Salvador Guatemala Haiti Honduras Mexico Nicaragua Panama Paraguay Peru Dominican Rep. Uruguay Venezuela Latin America South America Mexico and Central America. NR-related manufactures. Total NRrelated. Exports to China. GDP growth 2003-2010. 45,17 79,64 48,98 35,94 59,52 25,62 78,26 6,80 36,75 14,75 45,4 16,25 60,17 3,84 79,07 45,34 11,31 57,82 67,69. 20,55 14,55 19,53 54,57 15,48 16,87 13,05 20,89 23,07 8,20 16,55 8,56 21,92 6,21 12,11 23,70 25,29 19,29 28,97. 65,72 94,19 68,51 90,52 75,00 42,49 91,32 27,70 59,82 22,95 61,95 24,81 82,09 10,05 91,18 69,04 36,61 77,11 96,66. 15,98 16,15 28,26 47,10 9,28 12,82 5,61 1,60 4,65 0,00 4,76 3,22 3,73 2,19 2,58 25,34 3,56 7,74 10,69. 7,62 4,29 4,06 3,99 4,61 4,87 4,48 1,88 3,40 0,36 4,31 2,21 3,21 7,64 4,87 6,48 5,74 6,49 5,01. 43,07 59,74. 19,44 22,18. 62,51 81,92. 10,80 16,88. 4,50 5,19. 24,54. 16,40. 40,94. 4,06. 3,74. Source: Own elaboration based on ECLAC and IADB.. However, in relation to similar episodes in past decades, this time financial vulnerability appears to be lower, at least because of three reasons (Frenkel and Rapetti, 2011). Firstly, several years of external surpluses have reversed capital flows and, leaving aside FDI, many countries such as Argentina and Chile became financial creditors with respect to the rest of the world. Secondly, the accumulation of surpluses in the hands of central banks diminished the risk of currency crises. Finally, the predominance of financial inflows to equity markets and local currencydenominated instruments improved substantially the risk sharing with foreign creditors..
(32) 32. V. Issues. in debate II. Political economy challenges in natural-resource rich economies What prevent LA countries for following the development path of Australia, Canada or Norway? One key factor behind these diverging paths are the differences in their political and institutional frameworks. Indeed, the way in which key decisions regarding the generation, taxation, allocation and distribution of the rents stemming from natural resources are taken, cannot be understood without considering the political and institutional environment prevailing in each country. In other words, whether natural resources become a blessing or a curse will depend on the way in which each country is able to exploit them. The central issue is not of a technical but of a political-economy nature: how to deal with the inevitable social conflicts regarding the distribution of the natural resources’ rents. The complex political-economy questions the huge size and extreme volatility of those rents normally pose will certainly be compounded by the emergence of China as a new and powerful player, not only regarding the foreign trade of the countries in the region but also the flows of financial resources and FDI to these countries. In any case, given the existence of sizable rents arising from natural resources, the political-economy regime should provide answers to two fundamental questions: 1) the intertemporal foresight or myopia with which the rate of exploitation of natural resources and the allocation of the resulting rents will be decided and, 2) the way in which these rents will be distributed between the different social actors, considering the differences in economic and political power of these groups. In countries heavily dependent on natural resources, with fragile institutional frameworks and with little involvement of civil societies, the context is rather favorable for the domestic elites and foreign players concentrating most political and economic clout to take control of those resources, appropriate their rents and use them to block any attempt to strengthen the civil society or improve the quality of the institutions and the state capabilities (Katz and Rozenwurcel, 2014). The likely outcome will therefore be a society trapped in a vicious circle of resource dependence, institutional weaknesses and devalued citizenship. It is this outcome, stemming from political economy conditions spatially and historically determined, what can transform the abundance in natural resources into a curse. Considering the answer given to the above two questions, countries rich in natural resources can be classified according to the following typology (Barma et al., 2012, and Rozenwurcel and Katz, 2012): 1) the degree of long run economic, social and.
(33) A note on China’s development strategy and Latin American economies. 33. environmental sustainability of exploitation (intertemporal dimension) and 2) the degree of social integration and cohesion characterizing ex ante the policy design (the equity dimension). One should expect intertemporal sustainability to be greater the higher the credibility of the players involved (the government in the first place), the more frequent the compliance of the social agreements and more effective their enforcement, the stronger the institutional framework, the better the working of the public bureaucracy and, last but not least, the less extended the patronage system and the fragmentation of the political parties. In the same vein, it is likelier that social cohesion and inclusion will be higher in as much as the common interests prevail over the particular ones and the viewpoints of all social players are taken into account, that is when the concentration of power, the autonomy of the Executive and the discretion in decision-making are limited. In sum, considering both variables, four “ideal” types of socio-political regimes can be defined: 1) predatory (almost no social integration and cohesion together with intertemporal myopia), 2) hegemonic (intertemporal sustainability but no attention paid to social equity), 3) populist (attempts at social integration but disregard to sustainability) and finally, 4) inclusive (at the same time promoting social equity and sustainability). In what of the four categories each economy will be at any particular time will depend on a complex interaction of several factors. Nevertheless, no country is necessarily condemned to remain in the same box indefinitely. On the contrary, depending on the evolution of political, economical and social variables, it may move through time from one box to a different one. Even though it would be desirable that the countries move towards the inclusive regime, nothing prevents that they remain in the same box or even step backwards to less integrated or more myopic regimes. Why is this issue important for our discussion? There is little doubt that China’s fast growth and its emergence as a new economic and political superpower created a new global scenario. It is also quite likely that China’s development process will sustain a growing world demand of natural resources for a prolonged period. If this analysis proves right, the new international scenario will determine new opportunities and challenges for South American countries with significant endowments of natural capital. The way in which they manage to face the new environment, however, will strongly depend on the political economy regime prevailing in each country. In order to have some preliminary clues about this important question it might be useful to have a brief look at the evolution of some fiscal, monetary and social indicators in these countries along the last bonanza -i.e. throughout the period running from 2003 to 2013-..
(34) 34. We will focus on five issues related to natural resources’ management: 1) the overall fiscal stance 2) the compared evolution of primary expenditures and tax collection, 3) the evolution of monetary variables, 4) the relationship between fiscal rents on the one hand and public savings and investment on the other, and 5) the impact of the bonanza on social conditions as reflected in the evolution of the human development index (HDI). The first three issues have to do with intertemporal sustainablility, the last one with social cohesion and inclusion.. Topic 1. Fiscal stance under the external bonanza: generalized improvement in the first half of the decade, more disparate performances in the second half Considering Table 6, the first thing to remark is the comfortable situation all countries in the region experience regarding their public debts. Regardless of the specific reasons in each country, it is a fact that Public Debt/GDP ratio substantially decline in all of them throughout the decade under analysis, with the only exception of Ecuador – which had already undergone a debt restructuring which significantly reduced its debt burden in the late 1990s. As a matter of fact, in 2003 the ratio varied from 140% in Argentina to levels between 40% and 50% in Chile, Paraguay, Peru and Venezuela. By the end of the period considered, the highest ratio was slightly less than 60% in the case of Brazil and the lowest were well below 20% in Paraguay and Peru. As can be also seen in Table 6, from 2003 to 2008 the external bonanza led to a significant enhancement in the flow fiscal stance throughout the region, with the sole exception of Argentina and Ecuador. But even in the case of these countries the fiscal stance remained nevertheless quite comfortable. This picture somewhat changed in the second part of the period under analysis, from 2008 to 2013. In the case of the countries where the fiscal accounts were quite robust, both the primary and overall fiscal surpluses tended to diminish, reacting counter-cyclically to the global financial crisis: that was the case in Bolivia, Chile and Peru. Nevertheless, in these cases the trend change was far from being cause for concern. In the countries where the fiscal stance was less robust, the responses to the global crisis were not uniform. Brazil, Colombia and Uruguay decided not to significantly change their fiscal policies in face of the global crisis, in order not to deteriorate their not that strong fiscal stances..
(35) 35. A note on China’s development strategy and Latin American economies. Table 6. Fiscal stance in Latin America Argentina. Bolivia. Brazil. Chile. Colombia. 2003 Overall balance (% GDP) Primary balance (% GDP) Public debt (% GDP). 0,48 2,31 143,42. -7,88 -5,26 n,a,. -5,69 3,36 75,01. -0,80 -0,30 n,a,. -2,20 1,77 57,82. 2008 Overall balance (% GDP) Primary balance (% GDP) Public debt (% GDP). 1,14 2,53 38,52. 3,24 4,10 n,a,. -1,31 5,41 61,34. 5,00 5,50 5,80. 0,04 3,21 41,84. 2013/4 Overall balance (% GDP) Primary balance (% GDP) Public debt (% GDP). -2,71 -0,95 32,67. 0,65 1,35 n,a,. -4,50 1,50 64,80. -1,60 -1,20 12,20. -0,95 1,51 41,70. Ecuador. Paraguay. Peru. Uruguay. Venezuela. 2003 Overall balance (% GDP) Primary balance (% GDP) Public debt (% GDP). 1,40 3,52 45,86. -0,50 0,70 n,a,. -1,68 0,48 47,94. -2,63 3,07 98,38. 0,17 5,38 n,a,. 2008 Overall balance (% GDP) Primary balance (% GDP) Public debt (% GDP). 0,49 1,63 23,02. 2,30 2,80 n,a,. 2,40 3,98 26,42. -2,03 0,98 67,70. -3,51 -2,04 n,a,. 2013/4 Overall balance (% GDP) Primary balance (% GDP) Public debt (% GDP). -0,94 -0,20 27,43. -2,40 -1,60 n,a,. 0,84 0,91 18,70. -3,50 -0,40 58,23. -4,86 -1,05 n,a,. Source: Own elaboration based on ECLAC and IADB.. On the contrary, Argentina, Ecuador and Venezuela -where populist economic policies were more systematically followed- decided instead to make their fiscal policies even more expansionary. That move turned the surpluses of Argentina and Ecuador into deficits and made the primary and overall fiscal deficits of Venezuela even larger. While from a short term perspective the fiscal stance in these countries remained at the end of the period under consideration relatively under control, the fact that such a negative trend happened despite the huge increase in public revenues generated by the bonanza suggests that the longer term fiscal sustainability (even though their debt burdens are still rather low) looks flimsier, much more so acknowledging that the bonanza cannot last forever.. Topic 2. Fiscal performance under the bonanza: cautious or reckless? Dependency of public revenues from the proceeds of commodity exports is not a new phenomenon. This fiscal dependency reappeared with particular strength during the last decade, not only in oil or mineral exporters, but also in agricultural producers. Such dependency has been considered one of the most relevant factors explaining the.
(36) 36. strong pro-cyclical bias of macro policies in the region (see Gavin and Perotti, 1997). This is so because through different channels fiscal dependency tends to accentuate the adverse effects of commodity price volatility on economic performance. One of those channels works through the pressure exerted by conflicting social groups over public expenditures. As the expenditures that tend to increase during “good times” are of a recurrent nature, it is difficult to reverse the trend when “bad times” arrive, therefore forcing adjustments in the more flexible and less politically costly (at least in the short run) components of the public expenditure -typically public investment-. While it is true that, as we have already shown, during the last decade most of the counties in South America showed improvements in fiscal performance, it is also true that these improvements were mainly made possible by the positive commodity shock. Not all countries, however, showed a responsible behavior from the viewpoint of the fiscal management of the bonanza. The differences between countries can be clearly observed in Table 7, where we compare the relative evolution of primary expenditures and fiscal revenues.. Table 7. Fiscal performance 2003 Primary expenditures (% GDP) Revenues (% GDP) 2008 Primary expenditures (% GDP) Revenues (% GDP) 2013/4 Primary expenditures (% GDP) Revenues (% GDP) "Spending bias" index 2003-2013/4 2003-08 2008-2013/4 2003 Primary expenditures (% GDP) Revenues (% GDP) 2008 Primary expenditures (% GDP) Revenues (% GDP) 2013/4 Primary expenditures (% GDP) Revenues (% GDP) "Spending bias" index 2003-2013 2003-08 2008-2013. Argentina. Bolivia. Brazil. Chile. Colombia. 24,20% 26,51%. 31,00% 25,74%. 30,74% 34,10%. 21,36% 21,06%. 28,33% 30,10%. 30,97% 33,50%. 43,00% 47,10%. 30,79% 36,20%. 19,44% 24,94%. 24,29% 27,50%. 41,44% 40,49%. 48,25% 49,60%. 35,90% 37,40%. 21,91% 20,71%. 27,69% 29,20%. 0,11 0,01 0,10. -0,23 -0,29 0,06. 0,06 -0,05 0,11. 0,04 -0,23 0,28. 0,01 -0,06 0,07. Ecuador. Paraguay. Peru. Uruguay. Venezuela. 17,79% 21,31%. 13,51% 14,21%. 15,62% 16,10%. 24,53% 27,60%. 18,00% 23,38%. 34,09% 35,72%. 13,00% 15,80%. 16,85% 20,83%. 25,72% 26,70%. 26,55% 24,51%. 39,70% 39,50%. 20,40% 18,80%. 21,21% 22,12%. 30,80% 30,40%. 24,56% 23,51%. 0,17 0,12 0,05. 0,13 -0,13 0,26. -0,01 -0,16 0,15. 0,12 0,07 0,05. 0,27 0,31 -0,04. Source: Own elaboration based on ECLAC and IADB..
(37) A note on China’s development strategy and Latin American economies. 37. While Table 7 shows that both fiscal revenues as well as primary expenditures increased significantly in most countries of the region, the change in the ratio between the former and the latter can also tell us what kind of fiscal approach followed each country to face the bonanza. In fact, if the change is positive, this means that the country expanded faster their primary expenditures than their revenues, behaving as if the positive shock were “permanent”, or more precisely long-lasting. Conversely, if the opposite is true, this would mean that primary expenditures grew slower than revenues, suggesting that the country in question behaved as if the positive shock were transitory. Considering the full 2003-2013 period, it is possible to distinguish in the region three patterns of behavior. On the one hand, a group of prudent countries which did not bet their prospects on an unlikely “permanent” bonanza: these countries were Chile, Bolivia and Peru. On the other hand, fiscal behavior in Argentina, Ecuador, Venezuela and Paraguay showed an opposite trend: primary expenditures tended to grow faster than fiscal revenues, revealing a more reckless response to the external bonanza. Finally, the three remaining countries adopted a somewhat neutral stance. While primary expenditures and fiscal revenues grew approximately at the same rate in Brazil as well as Colombia, they both remained quite stable in Uruguay. It is also interesting to compare behaviors between the first and second half of the decade. As a matter of fact, the “prudence” indicator in the three “risk averse” countries –Bolivia, Chile and Peru- switched from negative to slightly positive, probably reacting anti-cyclically to the worsening of the global economy. The same change happened in “neutral” Uruguay and “risk lover” Paraguay. In the case of Uruguay it was probably a reaction -even though quiet modest- to the global crisis. In the case of Paraguay the reversal was instead rather large, suggesting that the change was not only an answer to the international crisis. In the case of the other three less “prudent” countries, their ratios remained positive in the two sub-periods, but while both Argentina and Venezuela moved to riskier stances, Ecuador did the opposite, becoming somewhat less reckless in the second half of the decade.. Topic 3.The evolution of monetary variables during the bonanza As happened to be the case with fiscal policy, the management of monetary variables showed clear differences between countries as well. These differences between countries can be clearly seen in Table 8 (Ecuador is not included in the table because is a dollarized economy and therefore does not have monetary autonomy). Chile and Peru, the countries with more prudent fiscal policies, were also the ones with a better performance in terms of inflation, as a result of sound monetary.
Figure


+7


Documento similar