Transcriptomic analysis of the hepatic
response to stress in the red cusk-eel
(Genypterus chilensis): Insights into lipid
metabolism, oxidative stress and liver
steatosis
Sebastian Naour1,2☯, Brisa M. Espinoza1,2☯, Jorge E. Aedo1,2, Rodrigo Zuloaga1,2, Jonathan Maldonado3, Macarena Bastias-Molina4, Herman Silva3, Claudio Meneses4, Cristian Gallardo-Escarate2,5, Alfredo Molina1,2,6*, Juan Antonio Valde´s1,2,6*
1 Universidad Andres Bello, Laboratorio de Biotecnologı´a Molecular, Facultad Ciencias Biolo´gicas, Santiago, Chile, 2 Interdisciplinary Center for Aquaculture Research (INCAR), Concepcio´n, Chile, 3 Universidad de Chile, Facultad de Ciencias Agrono´micas, Departamento de Produccio´n Agrı´cola, Laboratorio de Geno´mica Funcional & Bioinforma´tica, Av. Santa Rosa, La Pintana, Santiago, Chile, 4 Universidad Andres Bello, Centro de Biotecnologı´a Vegetal, FONDAP Center for Genome Regulation, Facultad de Ciencias Biolo´gicas, Santiago, Chile, 5 Universidad de Concepcio´n, Laboratory of Biotechnology and Aquatic Genomics, Concepcio´n, Chile, 6 Universidad Andres Bello, Centro de Investigacio´n Marina Quintay (CIMARQ), Facultad de Ecologı´a y Recursos Naturales, Valparaı´so, Chile
☯These authors contributed equally to this work.
*[email protected](AM);[email protected](JAV)
Abstract
Teleosts exhibit a broad divergence in their adaptive response to stress, depending on the magnitude, duration, and frequency of stressors and the species receiving the stimulus. We have previously reported that the red cusk-eel (Genypterus chilensis), an important marine farmed fish, shows a physiological response to stress that results in increased skeletal mus-cle atrophy mediated by over-expression of components of the ubiquitin proteasome and autophagy-lysosomal systems. To better understand the systemic effects of stress on the red cusk-eel metabolism, the present study assessed the transcriptomic hepatic response to repetitive handling-stress. Using high-throughput RNA-seq, 259 up-regulated transcripts were found, mostly associated with angiogenesis, gluconeogenesis, and triacylglyceride catabolism. Conversely, 293 transcripts were down-regulated, associated to cholesterol bio-synthesis, PPARαsignaling, fatty acid biosynthesis, and glycolysis. This gene signature was concordant with hepatic metabolite levels and hepatic oxidative damage. Moreover, the increased plasmatic levels of AST (aspartate aminotransferase), ALT (alanine aminotrans-ferase) and AP (alkaline phosphatase), as well as liver histology suggest stress-induced liver steatosis. This study offers an integrative molecular and biochemical analysis of the hepatic response to handling-stress, and reveals unknown aspects of lipid metabolism in a non-model teleost.
Citation: Naour S, Espinoza BM, Aedo JE, Zuloaga
R, Maldonado J, Bastias-Molina M, et al. (2017) Transcriptomic analysis of the hepatic response to stress in the red cusk-eel (Genypterus chilensis): Insights into lipid metabolism, oxidative stress and liver steatosis. PLoS ONE 12(4): e0176447.https:// doi.org/10.1371/journal.pone.0176447
Editor: Tzong-Yueh Chen, National Cheng Kung
University, TAIWAN
Received: December 11, 2016
Accepted: April 10, 2017
Published: April 27, 2017
Copyright:©2017 Naour et al. This is an open access article distributed under the terms of the
Creative Commons Attribution License, which permits unrestricted use, distribution, and reproduction in any medium, provided the original author and source are credited.
Data Availability Statement: All relevant data are
within the paper and its Supporting Information files.
Funding: This work was supported by: Fondo
Introduction
Stress generated during intensive fish farming is a major factor negatively affecting animal growth and health, and results in a decline in finfish aquaculture production [1,2]. Among the main types of stressors are those induced by physical stimuli, such as transport, capture, or handling [3,4], which are unavoidable in intensive aquaculture [5]. Fish possess a set of physio-logical strategies, allowing them to respond to stressors through adaptive neuroendocrine adjustments, collectively termed the stress response [6]. In fish, this stress response is mediated by the hypothalamic-pituitary-interrenal (HPI) axis, which is responsible for promoting the cortisol synthesis and secretion through interrenal cells into the bloodstream [7].
The liver is one of the most important target organs in the adaptive response to stress, and is a fundamental metabolic tissue for energy substrate administration [8], because hepatic tis-sue can synthesizede novoglucose for non-hepatic tissues during periods of stress [9]. In addi-tion, the liver is a key tissue involved in somatic growth regulaaddi-tion, the immune response, and detoxification [10–13]. Recent advances in transcriptomic technologies now allow a compre-hensive understanding of how physical disturbances modulate metabolic adaptations to stress [14,15]. While early studies were conducted on a limited number of species using microarray technology [16–18], it is now possible, thanks to progress in high-throughput sequencing tech-nologies, to study the adaptive function of liver tissue in a range of commercially important species, including channel catfish (Ictalurus punctatus) [19], rainbow trout (Oncorhynchus mykiss) [20], and large yellow croaker (Larimichthys crocea) [21], among others. Such studies demonstrate that each species has different adaptive mechanisms and molecular responses to stress, revealing particular details in their species-specific stress tolerances, meaning that cul-turing a new species requires an integrative and detailed knowledge of tissue-specific stress responses.
The red cusk-eel (Genypterus chilensis) is a new economically important marine species for the Chilean aquaculture industry [22], but low handling-stress tolerance results in high mortal-ity rates during juvenile stages [23]. Handling-stress facilitates red cusk-eel skeletal muscle atrophy through the coordinated expression of components of the ubiquitin-proteasome and autophagy-lysosome systems, revealing particularities in the compensatory response to stress [24]. Therefore, in the present study, we evaluate the hepatic response to handling-stress in the red cusk-eel using RNA-seq analysis, using a recently reported hybrid reference transcriptome [25]. This transcriptomic analysis was complemented by a quantification of hepatic metabo-lites, plasmatic enzyme activities, liver histology and oxidative stress markers. Our results strongly suggest that handling-stress has detrimental effects in this species, modulating the expression of genes associated with hepatic lipid metabolism and inducing liver steatosis.
Material and methods
Ethics statement
The study adhered to animal welfare procedures, and was approved by the bioethical commit-tees of the Universidad Andres Bello and the National Commission for Scientific and Techno-logical Research (CONICYT) of the Chilean government. The field studies did not involve endangered or protected species. The activities were performed at the Centro de Investigacio´n Marina de Quintay and authorized by the Andres Bello University.
Kit manufacturer recommendations
All kits were applied following manufacturer recommendations, unless noted.
had no role in study design, data collection and analysis, decision to publish, or preparation of the manuscript.
Competing interests: The authors have declared
Animals and experimental design
Juvenile red cusk-eels (Genypterus chilensis) with an average weight of 900±50 g and length of 55±5 cm were collected from the Centro de Investigacio´n Marina de Quintay (CIMARQ) (33˚130S 71˚380W, Valparaı´so Region, Chile). Eight fish were kept under natural temperature and light:dark photoperiod conditions (13˚C±1˚C and L:D 12:12) for the spring season. The animals were then split into control and stressed groups, placed in separate 90 L tanks, and acclimated for two weeks before the handling-stress protocol. Fish were fed once daily with 6-mm commercial pellets, containing 60% protein, 6% lipids, 11% carbohydrates, 15% ashes, and 8% humidity (Skretting, Puerto Montt, Chile). The stressed group was then subjected to a standardized handling-stress protocol consisting of netting and chasing the fish for five min-utes daily for five days. The management bias from adjacent tanks was prevented through the completely blocked by black covers on all tanks. Six hours after the final handling stimulation, the four stressed and four control fish were captured and anaesthetized (3-aminobenzoic acid ethyl ester, 100 mg/L-1). Blood was collected from the caudal vein with 1 ml heparinized (10 mg/mL) syringes and centrifuged at 5000 xg for 10 min at 4˚C to obtain plasma, frozen in liq-uid nitrogen, and stored at -80˚C. The fish were then euthanized through an overdose of anes-thetic (3-aminobenzoic acid ethyl ester, 300 mg/L). Livers were collected and immediately frozen in liquid nitrogen and stored at -80˚C.
AST, ALT and AP measurements
The plasmatic activity of AST (aspartate aminotransferase), ALT (alanine aminotransferase) and AP (alkaline phosphatase) were determined using commercially available kits from Valtek (Santiago, Chile). The enzymatic activity of AST, ALT, and AP are determined, respectively, by the production of colorimetric products from the generation of glutamate (colorimetric product: 450 nm), pyruvate (535 nm), and p-nitrophenol (405 nm).
Hepatic metabolites
The hepatic metabolite levels for glycogen, triglyceride, non-esterified free fatty acid (NEFA) and total cholesterol were determined using commercially available kits from Cell Biolabs (CA, USA). Ultrasonic disruption in PBS containing 0.5% Triton X-100 was used to homoge-nize 200 mg of liver tissue, which was centrifuged at 5000 xg for 10 minutes at 4˚C. The super-natant was collected, stored on ice, and used for glycogen and triglyceride quantification using the Glycogen Assay Kit (Cell Biolabs), and Serum Triglyceride Quantification Kit (Cell Bio-labs), respectively. For cholesterol and free fatty acid quantification [26], 10 mg of liver tissue was extracted with 200μL of a chloroform:isopropanol:NP-40 (7:11:0.1) mixture in a micro-homogenizer. The extract was centrifuged at 15,000 xg for 10 minutes, and the organic phase was transferred to a new tube and air dried at 50ºC to remove the chloroform. The dried lipids were dissolved and homogenized in 200μL of 1X Assay Diluent via vortexing. Cholesterol and NEFA were quantified using Total Cholesterol Assay Kit (Cell Biolabs) and Free Fatty Acid Assay Kit (Cell Biolabs), respectively.
Hepatic oxidative stress assays
VT, USA). Assessment of gDNA quality and visualization were performed by electrophoresis on a 1% agarose gel in TAE 1X containing ethidium bromide. In order to determine apurinic/ apyrimidinic (AP) sites, gDNA was mixed with the aldehyde reactive prove (ARP) reaction using the OxiSelect Oxidative DNA Damage Quantification Kit (Cell Biolabs, CA, USA), read-ing absorbance at 450 nm. For assessment of protein carbonylation, total proteins were extracted from 100 mg of liver in 1 ml of lysis buffer containing 50 mM Tris-HCl pH 7.4, 150 mM NaCl, 1 mM EDTA, and 1% NP-40, and solubilized at 4˚C after 12,000 xg centrifugation. Protein concentration was determined using a Pierce1BCA Protein Assay Kit (Thermo Sci-entific, IL, USA). Then, protein carbonyl content was quantified by the OxiSelect Protein Car-bonyl Spectrophotometric Assay (Cell Biolabs, CA, USA). Lipid peroxidation assessment was quantified by the formation of thydroxynonenal (HNE) protein adducts using the OxiSelect HNE Adduct Competitive ELISA Kit (Cell Biolabs, CA, USA).
Liver histology
The livers of the red cusk-eel were dissected immediately after euthanization according to the protocol described previously. The livers were fixed in 4% paraformaldehyde, embedded in paraffin, and sectioned at a 5μM thickness of three slices per liver. The samples were stained with hematoxylin/eosin, observed in a Olympus BX-61 microscope and photographed with a Leica DF300 camera.
Liver RNA sequencing
Total RNA was extracted using the RNeasy Mini Kit (Qiagen, TX, USA). RNA was quantified spectrophotometrically using NanoDrop with the Epoch Multi-Volume Spectrophotometer System (BioTek, VT, USA). Total RNA isolated from the liver was treated with DNase I to remove genomic DNA. RNA concentration was measured using a Qubit12.0 Fluorometer (Life Technology, Carlsbad, CA, USA), and RNA integrity was determined using the Fragment Analyzer™Automated CE System (Analytical Advanced Technologies, Ames, IA, USA). Equal quantities of total RNA from four fish were pooled by condition, and the total RNA was used to prepare mRNA libraries. Complementary DNA (cDNA) libraries were constructed using Tru-Seq RNA Sample Preparation kit v2 (Illumina1, USA). Libraries were sequenced (2 x 250bp) with the MiSeq (Illumina1) platform at the Centro de Biotecnologı´a Vegetal (UNAB, Chile).
Analysis and representation of differentially expressed transcripts
Raw sequencing reads were trimmed by removing adaptor sequences, low quality sequences (quality scores less than 10), and sequences with lengths less than 30 bp. To identify differen-tially expressed transcripts, the reads from control and stressed conditions were mapped to the
G.chilensisreference transcriptome [25], using CLC Genomics Workbench, v.7.0.3 (http:// www.clcbio.com), with the following parameters: mismatches = 2, minimum fraction length = 0.9, minimum fraction similarity = 0.8, and maximum hits per read = 5. Gene expressions were based on reads per kilobase of exon model per million mapped read (RPKM) values. Transcripts with absolute fold-change values>2.0 and FDR corrected P value<0.05 were included in the GO and KEGG enrichment analyses.
RNA-seq validation by real-time qPCR
All quantitative real-time polymerase chain reaction (qPCR) assays were carried out comply-ing with the MIQE guidelines [28]. Total RNA was extracted from liver tissue using the RNeasy Mini Kit (Qiagen, TX, USA). RNA was quantified by spectrophotometry using Nano-Drop with the Epoch Multi-Volume Spectrophotometer System (BioTek, VT, USA). Only RNA with an A260/280 ratio between 1.9 and 2.1 were used for cDNA synthesis. Residual genomic DNA was removed using the genomic DNA wipeout buffer included in the Quanti-tect Reverse Transcription Kit (Qiagen, TX, USA). Subsequently, 1μg of RNA was reverse transcribed into cDNA for 30 min at 42˚C.
The qPCR assessments were performed using a Stratagene MX3000P qPCR system (Strata-gene, La Jolla, CA, USA). Each reaction mixture contained 7.5μl of 2×Brilliant1II SYBR1
master mix (Stratagene, La Jolla, CA, USA), 6μl of cDNA (40-fold diluted) and 250 nM of each primer in 20μl final volume. The list of primers and amplification efficiencies are de-scribed inS1 Table. Amplifications were performed in triplicate following thermal cycling con-ditions of: initial activation of 10 minutes at 95˚C, followed by 40 cycles of 30s of denaturation at 95˚C, 30s of annealing at 54–60˚C, and 30s of elongation at 72˚C. In order to confirm the presence of a single PCR product, dissociation curve analysis of the PCR products was per-formed and evaluated by electrophoresis on a 2% agarose gel. With the purpose of calculating the assay’s efficiency, 2-fold dilution series were created from a cDNA pool. Efficiency values were estimated from the slope of the efficiency curve: E = 10(-1/slope)-1. The reference gene, 40S ribosomal protein S30 (fau), was used for gene expression normalization, and control reactions included a no-template control and a no-reverse-transcriptase control. QGene was used for analysis of gene expression [29].
Statistical analysis
Data are expressed as the mean±SEM. Differences in means between groups were determined using one-way ANOVAs, followed by a Bonferroni post hoc test. Data were accepted as signifi-cant at a value of P<0.05. Correlations between RNA-seq and qPCR data were assessed through multiple linear regression, using coefficients of determination (R2) and p-values. All statistical analyses were performed using GraphPad Prism, v.5.00 (GraphPad Software, CA, USA).
Results
Assessment of hepatic metabolites
We previously reported that plasmatic cortisol and glucose levels significantly increased after 5 days of daily handling-stress [24]. Considering how the liver plays a central role in the meta-bolic homeostasis of carbohydrates and lipids, we measured the hepatic metabolite levels of glycogen, triglyceride, cholesterol and non-esterified fatty acids (NEFA). We found decreased glycogen (Fig 1A), triglyceride (Fig 1B) and cholesterol levels (Fig 1C) in comparison to con-trol conditions. Conversely, the levels of NEFA were higher than in the concon-trol condition (Fig 1D). These results indicate a dynamic response to stress-mediated carbohydrate and lipid metabolism.
Hepatic transcriptomic responses of red cusk-eel to handling-stress
Fig 1. Hepatic metabolites levels of glycogen, triglyceride, cholesterol and non-esterified fatty acids (NEFA). All data are represented as means±SEM (n = 4). Significant differences between control and stressed groups are shown as*(P<0.05) and**(P<0.01).
reads for the control and a total of 13,669,452 paired-end reads for the stressed group. Raw reads have been deposited in the NCBI Sequence Read Archive under the study accession number SRX1056881. After sequence trimming for adapter subtraction and filtering of low quality base pairs, the data sets were reduced to 11,912,668 and 12,270,950 high-quality reads, respectively. Differentially expressed transcripts (DETs) were estimated by FPKM, mapping obtained reads to the reported reference transcriptome forG.chilensis[25], resulting in a map-ping of roughly 98.5% of the reads. A total of 552 DETs showed significant differential expres-sion between both conditions. Of these, there were 259 up-regulated transcripts and 293 down-regulated transcripts in stressed fish. A complete list of the differentially expressed tran-scripts is included inS2 Table.
GO cluster enrichment and pathway analysis
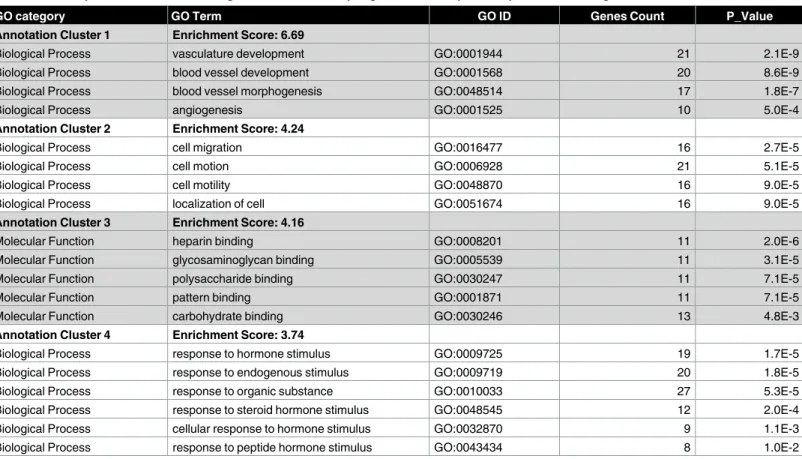
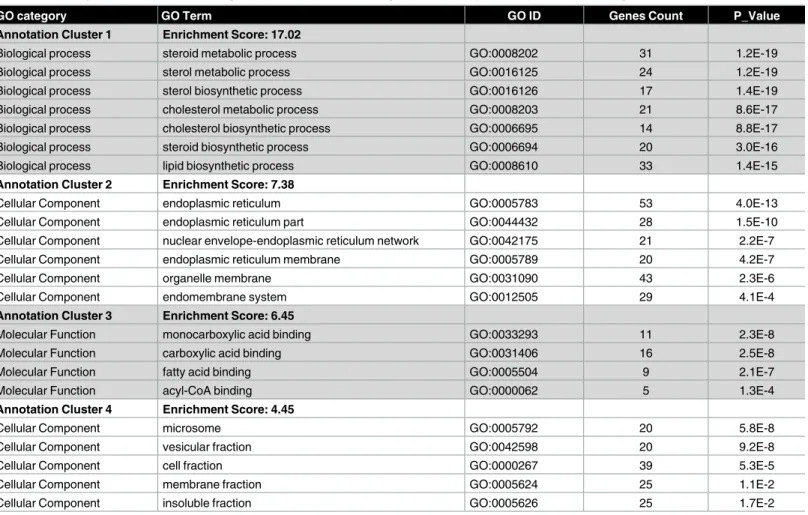
The up- and down-regulated genes were analyzed through the DAVID database and clustered based on GO terms.Table 1summarizes the top four clusters of functional categories with Enrichment Score>4 up-regulated under stress. The cluster with the highest enrichment scores (ES 6.69) includes biological processes like vasculature development, blood vessel devel-opment, blood vessel morphogenesis, and angiogenesis. Other enriched clusters up-regulated by stress included biological processes like cell migration, molecular function like heparin binding and biological process like response to hormone stimulus.Table 2summarizes the top four clusters of functional categories with Enrichment Score>4 down-regulated under stress. The cluster with the highest enrichment scores (ES 17.02) includes biological processes like steroid metabolic process, sterol metabolic process, sterol biosynthetic process, cholesterol
Table 1. Over-represented functional categories in clusters of up-regulated transcripts in response to handling stress.
GO category GO Term GO ID Genes Count P_Value
Annotation Cluster 1 Enrichment Score: 6.69
Biological Process vasculature development GO:0001944 21 2.1E-9
Biological Process blood vessel development GO:0001568 20 8.6E-9
Biological Process blood vessel morphogenesis GO:0048514 17 1.8E-7
Biological Process angiogenesis GO:0001525 10 5.0E-4
Annotation Cluster 2 Enrichment Score: 4.24
Biological Process cell migration GO:0016477 16 2.7E-5
Biological Process cell motion GO:0006928 21 5.1E-5
Biological Process cell motility GO:0048870 16 9.0E-5
Biological Process localization of cell GO:0051674 16 9.0E-5
Annotation Cluster 3 Enrichment Score: 4.16
Molecular Function heparin binding GO:0008201 11 2.0E-6
Molecular Function glycosaminoglycan binding GO:0005539 11 3.1E-5
Molecular Function polysaccharide binding GO:0030247 11 7.1E-5
Molecular Function pattern binding GO:0001871 11 7.1E-5
Molecular Function carbohydrate binding GO:0030246 13 4.8E-3
Annotation Cluster 4 Enrichment Score: 3.74
Biological Process response to hormone stimulus GO:0009725 19 1.7E-5
Biological Process response to endogenous stimulus GO:0009719 20 1.8E-5
Biological Process response to organic substance GO:0010033 27 5.3E-5
Biological Process response to steroid hormone stimulus GO:0048545 12 2.0E-4
Biological Process cellular response to hormone stimulus GO:0032870 9 1.1E-3
Biological Process response to peptide hormone stimulus GO:0043434 8 1.0E-2
metabolic process, cholesterol biosynthetic process, steroid biosynthetic process, lipid biosyn-thetic process. Other enriched clusters down-regulated by stress included cellular component like endoplasmic reticulum, molecular function like monocarboxylic acid binding and cellular component like microsome.
Pathway analysis with a curated collection was used to visualize and integrate transcrip-tomic data. Eight transcripts associated with angiogenesis were up-regulated (S1 Fig): angio-tensin receptor type 2 (agtr2), transforming growth factor beta receptor type 3 (tgfbr3), fibroblast growth factor receptors type 2 and 4 (fgfr2andfgfr4), platelet-derived growth factor receptor type alpha (pdgfra), intracellular effectors related to hepatocyte proliferation: mito-gen-activated protein kinase 6 (mapk6), proto-oncogene c-fos (fos), and transcription factor AP-1 (jun). Seventeen transcripts associated with fatty acid and cholesterol biosynthesis were down-regulated (S2andS3Figs, respectively): ATP-citrate synthase (acly), acetyl- carboxylase 1 (acaca), fatty acid synthase (fasn), hydroxyacyl-coenzyme A dehydrogenase (hadh), peroxisomal trans-2-enoyl- reductase (pecr), stearoyl-CoA desaturase 5 (scd5), long-chain-fatty-acid-ligase 3 (acsl3), 3-hydroxy-3-methylglutaryl-coenzyme A synthase 1 (hmgcs1), 3-hydroxy-3-methylglu-taryl-CoA reductase (hmgcr), mevalonate decarboxylase (mvd), isopentenyl-diphosphate delta isomerase 1 (idi1), farnesyl diphosphate synthase (fdps), squalene epoxidase (sqle), lanosterol synthase (lss), cytochrome P450, family 51, subfamily A1 (cyp51a1), NAD(P)dependent steroid dehydrogenase-like (nsdhl), lathosterol oxidase (sc5dl), and 7-dehydrocholesterol reductase (dhcr7).
Table 2. Over-represented functional categories in clusters of down-regulated transcripts in response to handling stress.
GO category GO Term GO ID Genes Count P_Value
Annotation Cluster 1 Enrichment Score: 17.02
Biological process steroid metabolic process GO:0008202 31 1.2E-19
Biological process sterol metabolic process GO:0016125 24 1.2E-19
Biological process sterol biosynthetic process GO:0016126 17 1.4E-19
Biological process cholesterol metabolic process GO:0008203 21 8.6E-17
Biological process cholesterol biosynthetic process GO:0006695 14 8.8E-17
Biological process steroid biosynthetic process GO:0006694 20 3.0E-16
Biological process lipid biosynthetic process GO:0008610 33 1.4E-15
Annotation Cluster 2 Enrichment Score: 7.38
Cellular Component endoplasmic reticulum GO:0005783 53 4.0E-13
Cellular Component endoplasmic reticulum part GO:0044432 28 1.5E-10
Cellular Component nuclear envelope-endoplasmic reticulum network GO:0042175 21 2.2E-7
Cellular Component endoplasmic reticulum membrane GO:0005789 20 4.2E-7
Cellular Component organelle membrane GO:0031090 43 2.3E-6
Cellular Component endomembrane system GO:0012505 29 4.1E-4
Annotation Cluster 3 Enrichment Score: 6.45
Molecular Function monocarboxylic acid binding GO:0033293 11 2.3E-8
Molecular Function carboxylic acid binding GO:0031406 16 2.5E-8
Molecular Function fatty acid binding GO:0005504 9 2.1E-7
Molecular Function acyl-CoA binding GO:0000062 5 1.3E-4
Annotation Cluster 4 Enrichment Score: 4.45
Cellular Component microsome GO:0005792 20 5.8E-8
Cellular Component vesicular fraction GO:0042598 20 9.2E-8
Cellular Component cell fraction GO:0000267 39 5.3E-5
Cellular Component membrane fraction GO:0005624 25 1.1E-2
Cellular Component insoluble fraction GO:0005626 25 1.7E-2
A general down-regulation was observed in the PPARαsignaling pathway (S4 Fig), includ-ing the transcription factor, peroxisome proliferator-activated receptor alpha (ppara), and transcripts associated with ketogenesis (hydroxymethylglutaryl-CoA synthase,hmgcs1), lipid transport (apolipoprotein B-100,apob; apolipoprotein D,apod), cholesterol metabolism (sterol 26-hydroxylase,cyp27a1), fatty acid transport (fatty acid-binding protein 1,fabp1; fatty acid-binding protein 3,fabp3; long-chain-fatty-acid-CoA ligase 3,acsl3; and long-chain-fatty-acid-CoA ligase ACSBG2,acsbg2), and fatty acid beta oxidation (peroxisomal acyl-coenzyme A oxi-dase 3;acox3). An up-regulation was observed in the expression of two transcripts associated with fatty acid omega oxidation (alcohol dehydrogenase class-3,adh5, and cytochrome P450 2D6,cyp2d6). In addition, a down-regulation was observed in triglyceride synthesis (glycerol-3-phosphate acyltransferase 1,gpam; 1-acyl-sn-glycerol-3-phosphate acyltransferase gamma,
agpat3; diacylglycerol O-acyltransferase 1,dgat1; and diacylglycerol O-acyltransferase 2,dgat2) and a consequent up-regulation in transcripts associated to triglyceride degradation (lipase member H,liphand patatin-like phospholipase domain-containing protein 2,pnpla2) (S5 Fig).
Transcripts related to gluconeogenesis and glycolysis pathways showed changes in gene expression (S6 Fig), including up-regulated glucose-6-phosphatase (g6pc), fructose-bispho-sphate aldolase C (aldoc), and aspartate aminotransferase (got1) and down-regulated tran-scripts glucokinase (gck), alpha-enolase (eno1), pyruvate kinase (pklr), and dihydrolipoyl dehydrogenase (dld).
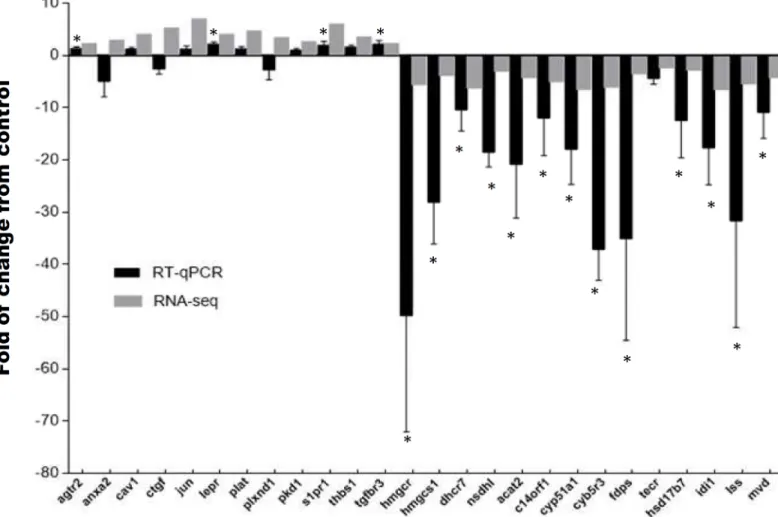
RNA-seq validation
To validate the RNA-seq analysis, we used qPCR to assay stress-associated changes in mRNA levels of 26 genes. We selected 12 transcripts from the first functional annotation up-regulated cluster (agtr2,anxa2,cav1,ctgf,jun,lepr,plat,plxnd1,pkd1,s1pr1,thbs1,tgfbr3) and 14 tran-scripts from the first functional annotation down-regulated cluster (hmgcr,hmgcs,dhcr7,
nsdhl,acat2,c14orf1,cyp51a1,cyb5r3,fdps,tecr,hsd17b7,idi1,lss). The transcript expression fold-changes measured by qPCR and RNA-seq had a high statistical correlation (R2= 0.78, P<0.001) (Fig 2).
Hepatotoxicity induced by handling-stress
To evaluate the hepatotoxicity induced by this stress, we measured cellular and plasmatic markers of liver damage. Handling-stress significantly increased the rate of lipid peroxidation (Fig 3A), protein carbonylation (Fig 3B), and DNA oxidative damage (Fig 3C) (3.4-fold, 2.8-fold, and 3.3-fold, respectively) in comparison to control conditions. Similarly, the plas-matic concentrations of alanine aminotransferase (Fig 4A), aspartate aminotransferasa (Fig 4B) and alkaline phosphatase (Fig 4C) were significantly raised in stressed animals (1.3-fold, 3.8-fold, and 1.8-fold, respectively), in comparison to control conditions. In addition, histolog-ical liver analysis reveals that hepatocytes from control conditions have the typhistolog-ical polygonal cell shape and clear cytoplasm. However hepatocytes from stressed conditions start to lose their polygonal shape and have a condensed cytoplasm characteristics of liver fibrosis (S7 Fig).
Discussion
gene expression primarily associated with biological pathways, such as angiogenesis, fatty acid biosynthesis, cholesterol biosynthesis, PPARαsignaling, triglyceride metabolism, gluconeo-genesis and glycolysis. The results obtained by thisin silicoapproach were validated by qPCR analysis of representative cholesterol and angiogenesis pathway genes, as well as the assessment of hepatic metabolites and markers of hepatic damage.
Stress and glucose metabolism
Numerous studies in teleost demonstrate that stress is intimately related to glucose metabo-lism, because its oxidation meets the increased energy demand needed to cope with stress [30,31]. Studies in rainbow trout (O.mykiss)have determined that handling-stress induces an elevation in the expression of key enzymes involved in gluconeogenesis during the recovery
Fig 2. Quantitative real time PCR validation of differentially expressed transcripts. Expression of fold changes measured by RNA-seq and qPCR are indicated in the grey and black columns, respectively. agtr2 (type-2 angiotensin ii receptor), anxa2 (annexin a2), cav1 (caveolin-1), ctgf (connective tissue growth factor precursor), jun (transcription factor ap-1), lepr (leptin receptor precursor), plat (tissue-type plasminogen activator precursor), plxnd1 (plexin-b2 precursor), pkd1 (polycystin-1 precursor), s1pr1 (sphingosine 1-phosphate receptor 1), thbs1 (thrombospondin-2 precursor), tgfbr3 (transforming growth factor beta receptor type 3 precursor), hmgcr (3-hydroxy-3-methylglutaryl-coenzyme a reductase), hmgcs1 (hydroxymethylglutaryl- cytoplasmic), dhcr7 (7-dehydrocholesterol reductase), nsdhl (sterol-4-alpha-carboxylate 3- decarboxylating), acat2 (acetyl-CoA acetyltransferase), c14orf1 (ergosterol biosynthetic protein), cyp51a1 (lanosterol 14-alpha demethylase), cyb5r3 (nadh-cytochrome b5 reductase 3), fdps (farnesyl pyrophosphate synthase),
tecr (trans- enoyl- reductase), hsd17b7 (3-keto-steroid reductase), idi1 (isopentenyl-diphosphate delta-isomerase 1), lss (lanosterol synthase), mvd
(diphosphomevalonate decarboxylase), fau (40S ribosomal protein). Significant differences between the control and stressed groups are shown as*
(P<0.05) and**(P<0.01).
Fig 3. Hepatic levels of lipid peroxidation, protein carbonylation and DNA oxidative damage. All data are represented as means±SEM (n = 4). Significant differences between control and stressed groups are shown as*(P<0.05) and**(P<0.01).
phase, including phosphoenolpryruvate carboxykinase (pck1) and glucose-6-phosphatase (g6pc), as well as a decrease in the expression of pyruvate kinase (pklr) and glucokinase (gck) involved in glycolisis [32,33]. Most expressions of these genes are directly regulated by the glu-cocorticoid receptor [9,14]. Consistent with these observations, handling-stress in the red cusk-eel induced an up-regulation in the expression of gluconeogenic geneg6pcand a down-regulation of glycolitic genespklrandgck. These results are similar to those of juvenile carp (Cyprinus carpio) and Mozambique tilapia (Oreochromis mossambicus), for which the adminis-tration of a high dose of cortisol significantly increased glucose serum levels and glucose-6 phosphatase activity, revealing a major role for cortisol in gluconeogenesis [34,35]. Similar to our observations, chronic cortisol administration in gilthead sea bream (Sparus aurata), induces a down-regulation of enolase 1 (eno1) [18], a glycolitic gene. In addition, in Senegalese sole (Solea senegalensis), repeated handling-stress induces a decrease of enolase 1 protein expression [36]. Therefore, we hypothesize that the increase in plasma glucose levels seen in the red cusk-eel after stress may be associated with enhanced muscle protein catabolism neces-sary for liver gluconeogenesis, even though increases in plasmatic levels of lactate during stress were not found [24]. The increase in plasmatic glucose levels can also be related to glycogen hydrolysis (glycogenolysis), evidenced by its decrease in the liver. Indeed, stress and cortisol have been demonstrated to play a fundamental role in glycogen metabolism in rainbow trout [37,38], although we did not find changes in the expression of genes associated with such catabolism.
Stress and lipid metabolism
The liver also plays a central role in lipid metabolism [39], and in the current study, handling-stress induced a general down-regulation in the cholesterol and fatty acid biosynthesis path-ways. The stress-induced inhibition of cholesterol biosynthesis is in line with previous data on rainbow trout, where plasma cholesterol levels decreased after 30 days of high stocking den-sities [40]. Additionally, the down-regulation in fatty acid biosynthesis is concordant with observations of rainbow trout following handling-stress, in which fatty acid synthase (fasn) expression and activity decreased [37].
It is well known that under stressful conditions another metabolic fuel, ketone bodies, is generated through NEFA beta oxidation[40]. A major NEFA source is the hydrolysis of liver and adipose tissue triglycerides through lipase-catalyzed lipolysis [41]. Consistent with this, handling-stress induced an increase in the expression ofliphandpnpla2lipases as well as, a general down-regulation in the expression of genes associated with triglyceride synthesis. Lipase H (LIPH) is an evolutionary conserved phospholipase which catalyzes the production of fatty acids and lysophosphatidic acid (LPA) [42]. PNPLA2 is a member of the patatin-like phospholipase domain-containing protein family, which catalyzes the initial step in triglycer-ide hydrolysis [43]. Although there are reports of the over-expression of both genes in mam-mal tissues under pathophysiological conditions [44], no reports exist linking these genes to a stress response in teleosts. Consistent with the over-expression ofliphandpnpla2under stressful conditions, there was a decrease in triglyceride levels and an increase in NEFA hepatic levels. The dramatic increases in hepatic NEFA levels may be associated with enhanced triglyc-eride hydrolysis and impaired fatty acid beta oxidation, similar to decreases seen in hepatic tri-glyceride levels in rainbow trout caused by acute handling-stress [37]. It is therefore probable
Fig 4. Plasmatic levels of ALT (alanine aminotransferase), AST (aspartate aminotransferasa), and AP (alkaline phosphatase). All data are represented as means±SEM (n = 4). Significant differences between control and stressed groups are shown as*(P<0.05) and**(P<0.01).
that increased hepatic fatty acid accumulation is related with the development of liver steatosis [45].
Stress and liver steatosis
Liver steatosis is defined as an accumulation of excessive triglycerides and other fats inside liver cells [46], although fish that are fed diets rich in unsaturated fatty acids are known to develop this condition [47], there are no reports relating this condition to stress. A direct relationship between glucocorticoids and fatty liver disease is described in mammals, with glu-cocorticoids acting as a promoter of lipid accumulation, leading to inflammation, and the potential for fibrosis [45]. This accumulation in hepatocyte diminishes mitochondrial oxida-tive capacity, further reducing the state of the electron transport chain complexes and sti-mulating peroxisomal and microsomal pathways for omega oxidation [45]. The consequent increased generation of reactive oxygen species (ROS) and reactive aldehydic derivatives causes oxidative stress [46].
We found increased expressions of cytochrome P450 2D6 (cyp2d6) and alcohol dehydroge-nase class-3 (adh5), genes related to fatty acid omega oxidation and a consistent increase in lipid peroxidation, protein carbonylation, and DNA oxidation induced by stress. While there are no reports in teleost that link the fatty acid accumulation in liver to oxidative damage, it has been recently reported in tapertail anchovy (Coilia nasus) that loading stress induces lipid peroxidation, expression of apoptosis-associated markers, and increased plasmatic levels of ALT and AST [48]. While the authors associated the liver damage to TNFα-induced apoptosis, interestingly they also reported an increase of lipid metabolic genes, similar to our observations.
Recently, a study developed with a mammalian model of hepatocellular steatosis established the effects of free fatty acid and the mechanism associated to oxidative stress [49]. The authors reported that high concentration of free fatty acid induced excessive lipid accumulation and oxidative stress by down-regulating thepparaexpression, similar to our observations [49]. PPARαis nuclear hormone receptors, and regulates the expression of many genes involved in fatty acid oxidation, ketogenesis, gluconeogenesis, cholesterol catabolism, among others. In fish, PPARαhave been identified and characterized in several species however there are no direct reports that associate changes in its expression during stress response[50]. However, the systemic administration of the PPARαantagonist, WY-14643, has been shown to induce a decrease in NEFA plasmatic levels associated to increased fatty acid beta oxidation in turbot (Scophthalmus maximus) [51]. Therefore, we speculate that stress-impaired PPARαexpression should induce an increase in NEFA overload and cytochrome P450-dependent-omega oxida-tion. Consistent with these observations, a direct role for glucocorticoids in the increase of TG hydrolysis, as well as in the inhibition of beta oxidation and cholesterol biosynthesis, has been demonstrated in mammals throughin vitroandin vivotrials [52,53].
Conclusions
Supporting information
S1 Table. Primer sequences for qPCR assay, amplicon size, and PCR efficiencies for genes used in the study. Sequences were derived from the red cusk-eel reference transcriptome.
(XLSX)
S2 Table. Complete list of up-regulated and down-regulated hepatic transcripts in response to handling-stress.
(XLSX)
S1 Fig. Illustration created using Pathvisio v3 of the angiogenesis pathway involved in the hepatic stress response based on RNA-seq expression analysis. The red colors indicate an
increase in any of the components of the pathways. (TIF)
S2 Fig. Illustration created using Pathvisio v3 of the fatty acid biosynthesis pathway involved in the hepatic stress response, based on RNA-seq expression analysis. The green
colors indicate a decrease in any of the components of the pathways. (TIF)
S3 Fig. Illustration created using Pathvisio v3 of the cholesterol biosynthesis pathway involved in the hepatic stress response, based on RNA-seq expression analysis. The green
colors indicate a decrease in any of the components of the pathways. (TIF)
S4 Fig. Illustration created using Pathvisio v3 of the PPARαpathway involved in the hepatic stress response, based on RNA-seq expression analysis. The green and red colors
indicate a decrease and increase in any of the components of the pathways, respectively. (TIF)
S5 Fig. Illustration created using Pathvisio v3 of the triglyceride pathway involved in the hepatic stress response, based on RNA-seq expression analysis. The green and red colors
indicate a decrease and increase in any of the components of the pathways, respectively. (TIF)
S6 Fig. Illustration created using Pathvisio v3 of the glycolisis and gluconeogenesis path-ways involved in the hepatic stress response, based on RNA-seq expression analysis. The
green and red colors indicate a decrease and increase in any of the components of the path-ways, respectively.
(TIF)
S7 Fig. Histology of red cusk-eel liver at A) control and B) stressed conditions (n = 4, per
group). The samples were stained with hematoxylin/eosin, observed in an Olympus BX-61 microscope at 100X and photographed with a Leica DF300 camera.
(TIF)
Acknowledgments
The authors thank Dr. Juan Manuel Estrada (Universidad Andres Bello) for advice on red cusk-eel manipulation and BioPub (http://www.biopub.cl/) for improving and correcting the English of the manuscript.
Author Contributions
Data curation: JA JM.
Formal analysis: RZ.
Funding acquisition: JAV AM.
Investigation: SN BE.
Methodology: CM MBM.
Project administration: JAV.
Resources: JAV.
Software: HS.
Supervision: JAV CGE.
Validation: JAV.
Visualization: JAV.
Writing – original draft: JAV.
Writing – review & editing: JAV.
References
1. Barton BA. Stress in fishes: a diversity of responses with particular reference to changes in circulating corticosteroids. Integr Comp Biol. 2002; 42: 517–525.https://doi.org/10.1093/icb/42.3.517PMID:
21708747
2. Eissa N, Wang H-P. Transcriptional stress responses to environmental and husbandry stressors in aquaculture species. Rev Aquac. 2016; 8: 61–88.
3. Hosoya S, Johnson SC, Iwama GK, Gamperl AK, Afonso LOB. Changes in free and total plasma corti-sol levels in juvenile haddock (Melanogrammus aeglefinus) exposed to long-term handling stress. Comp Biochem Physiol A Mol Integr Physiol. 2007; 146: 78–86.https://doi.org/10.1016/j.cbpa.2006.09. 003PMID:17045829
4. Acerete L, Balasch J., Espinosa E, Josa A, Tort L. Physiological responses in Eurasian perch (Perca flu-viatilis, L.) subjected to stress by transport and handling. Aquaculture. 2004; 237: 167–178.
5. Harper C, Wolf JC. Morphologic effects of the stress response in fish. ILAR J Natl Res Counc Inst Lab Anim Resour. 2009; 50: 387–396.
6. Pankhurst NW. The endocrinology of stress in fish: an environmental perspective. Gen Comp Endocri-nol. 2011; 170: 265–275.https://doi.org/10.1016/j.ygcen.2010.07.017PMID:20688064
7. Ellis T, Yildiz HY, Lo´pez-Olmeda J, Spedicato MT, Tort L,ØverliØ, et al. Cortisol and finfish welfare. Fish Physiol Biochem. 2012; 38: 163–188.https://doi.org/10.1007/s10695-011-9568-yPMID:
22113503
8. Moon TW. Hormones and fish hepatocyte metabolism: “the good, the bad and the ugly!” Comp Biochem Physiol B Biochem Mol Biol. 2004; 139: 335–345.https://doi.org/10.1016/j.cbpc.2004.06.003PMID:
15544959
9. Faught E, Vijayan MM. Mechanisms of cortisol action in fish hepatocytes. Comp Biochem Physiol B Bio-chem Mol Biol. 2016
10. Madison BN, Tavakoli S, Kramer S, Bernier NJ. Chronic cortisol and the regulation of food intake and the endocrine growth axis in rainbow trout. J Endocrinol. 2015; 226: 103–119.https://doi.org/10.1530/ JOE-15-0186PMID:26101374
11. Nakano T, Afonso LOB, Beckman BR, Iwama GK, Devlin RH. Acute physiological stress down-regu-lates mRNA expressions of growth-related genes in coho salmon. PloS One. 2013; 8: e71421.https:// doi.org/10.1371/journal.pone.0071421PMID:23990952
12. Olivares-Rubio HF, Vega-Lo´pez A. Fatty acid metabolism in fish species as a biomarker for environ-mental monitoring. Environ Pollut. 2016; 218: 297–312.https://doi.org/10.1016/j.envpol.2016.07.005
13. Philip AM, Vijayan MM. Stress-Immune-Growth Interactions: Cortisol Modulates Suppressors of Cyto-kine Signaling and JAK/STAT Pathway in Rainbow Trout Liver. PloS One. 2015; 10: e0129299.https:// doi.org/10.1371/journal.pone.0129299PMID:26083490
14. Aluru N, Vijayan MM. Stress transcriptomics in fish: A role for genomic cortisol signaling. Gen Comp Endocrinol. 2009; 164: 142–150.https://doi.org/10.1016/j.ygcen.2009.03.020PMID:19341738
15. Prunet P,Øverliø., Douxfils J, Bernardini G, Kestemont P, Baron D. Fish welfare and genomics. Fish Physiol Biochem. 2012; 38: 43–60.https://doi.org/10.1007/s10695-011-9522-zPMID:21671026
16. Calduch-Giner JA, Davey G, Saera-Vila A, Houeix B, Talbot A, Prunet P, et al. Use of microarray tech-nology to assess the time course of liver stress response after confinement exposure in gilthead sea bream (Sparus aurata L.). BMC Genomics. 2010; 11: 193.https://doi.org/10.1186/1471-2164-11-193
PMID:20307314
17. Dhanasiri AKS, Fernandes JMO, Kiron V. Liver Transcriptome Changes in Zebrafish during Acclimation to Transport-Associated Stress. Brody JP, editor. PLoS ONE. 2013; 8: e65028.https://doi.org/10.1371/ journal.pone.0065028PMID:23762281
18. Teles M, Boltaña S, Reyes-Lo´pez F, Santos MA, Mackenzie S, Tort L. Effects of chronic cortisol admin-istration on global expression of GR and the liver transcriptome in Sparus aurata. Mar Biotechnol N Y N. 2013; 15: 104–114.
19. Liu S, Wang X, Sun F, Zhang J, Feng J, Liu H, et al. RNA-Seq reveals expression signatures of genes involved in oxygen transport, protein synthesis, folding, and degradation in response to heat stress in catfish. Physiol Genomics. 2013; 45: 462–476.https://doi.org/10.1152/physiolgenomics.00026.2013
PMID:23632418
20. Liu S, Gao G, Palti Y, Cleveland BM, Weber GM, Rexroad CE. RNA-seq analysis of early hepatic response to handling and confinement stress in rainbow trout. PloS One. 2014; 9: e88492.https://doi. org/10.1371/journal.pone.0088492PMID:24558395
21. Qian B, Xue L, Huang H. Liver Transcriptome Analysis of the Large Yellow Croaker (Larimichthys cro-cea) during Fasting by Using RNA-Seq. Buratti E, editor. PLOS ONE. 2016; 11: e0150240.https://doi. org/10.1371/journal.pone.0150240PMID:26967898
22. Vega R, Pradenas M, Estrada JM, Ramirez D, Valdebenito I, Mardones A, et al. Evaluacion y compara-cion de la eficiencia de dos sistemas de incubacompara-cion de huevos de Genypterus chilensis (Guichenot, 1848). Lat Am J Aquat Res. 2012; 40: 187–200.
23. Vega R, Estrada JM, Ramirez D, Flores C, Zamorano J, Encina F, et al. Crecimiento de juveniles de congrio colorado Genypterus chilensis en condiciones de cultivo. Lat Am J Aquat Res. 2015; 344–350. 24. Aedo JE, Maldonado J, Aballai V, Estrada JM, Bastias-Molina M., Meneses C, et al. mRNA-seq reveals
skeletal muscle atrophy in response to handling stress in a marine teleost, the red cusk-eel (Genypterus chilensis). BMC Genomics. 2015; 16:1024.https://doi.org/10.1186/s12864-015-2232-7PMID:26626593
25. Aedo JE, Maldonado J, Estrada JM, Fuentes EN, Silva H, Gallardo-Escarate C, et al. Sequencing and de novo assembly of the red cusk-eel (Genypterus chilensis) transcriptome. Mar Genomics. 2014; 18: 105–107.https://doi.org/10.1016/j.margen.2014.08.001PMID:25139027
26. Rodrı´guez-Sureda V, Peinado-Onsurbe J. A procedure for measuring triacylglyceride and cholesterol content using a small amount of tissue. Anal Biochem. 2005; 343: 277–282.https://doi.org/10.1016/j. ab.2005.05.009PMID:15993372
27. Huang DW, Sherman BT, Lempicki RA. Systematic and integrative analysis of large gene lists using DAVID bioinformatics resources. Nat Protoc. 2008; 4: 44–57.
28. Bustin SA, Benes V, Garson JA, Hellemans J, Huggett J, Kubista M, et al. The MIQE guidelines: mini-mum information for publication of quantitative real-time PCR experiments. Clin Chem. 2009; 55: 611– 622.https://doi.org/10.1373/clinchem.2008.112797PMID:19246619
29. Simon P. Q-Gene: processing quantitative real-time RT-PCR data. Bioinforma Oxf Engl. 2003; 19: 1439–1440.
30. Gilmour KM, Kirkpatrick S, Massarsky A, Pearce B, Saliba S, Stephany C-E´ , et al. The Influence of Social Status on Hepatic Glucose Metabolism in Rainbow Trout Oncorhynchus mykiss. Physiol Bio-chem Zool. 2012; 85: 309–320.https://doi.org/10.1086/666497PMID:22705482
31. Polakof S, Panserat S, Soengas JL, Moon TW. Glucose metabolism in fish: a review. J Comp Physiol B. 2012; 182: 1015–1045.https://doi.org/10.1007/s00360-012-0658-7PMID:22476584
32. Momoda TS, Schwindt AR, Feist GW, Gerwick L, Bayne CJ, Schreck CB. Gene expression in the liver of rainbow trout, Oncorhynchus mykiss, during the stress response. Comp Biochem Physiol Part D Genomics Proteomics. 2007; 2: 303–315.https://doi.org/10.1016/j.cbd.2007.06.002PMID:20483302
34. Sunny F, Jacob A, Oommen OV. Genomic Effect of Glucocorticoids on Enzymes of Intermediary Metabolism in Oreochromis mossambicus. Endocr Res. 2003; 29: 119–131. PMID:12856799
35. Dziewulska-Szwajkowska D, Łozińska-Gabska M, Adamowicz A, Wojtaszek J, Dzugaj A. The effect of high dose of cortisol on glucose-6-phosphatase and fructose-1,6-bisphosphatase activity, and glucose and fructose-2,6-bisphosphate concentration in carp tissues (Cyprinus carpio L.). Comp Biochem Phy-siol B Biochem Mol Biol. 2003; 135: 485–491. PMID:12831768
36. Cordeiro OD, Silva TS, Alves RN, Costas B, Wulff T, Richard N, et al. Changes in liver proteome expression of Senegalese sole (Solea senegalensis) in response to repeated handling stress. Mar Bio-technol N Y N. 2012; 14: 714–729.
37. Lo´pez-Patiño MA, Herna´ndez-Pe´rez J, Gesto M, Libra´n-Pe´rez M, Mı´guez JM, Soengas JL. Short-term time course of liver metabolic response to acute handling stress in rainbow trout, Oncorhynchus mykiss. Comp Biochem Physiol A Mol Integr Physiol. 2014; 168: 40–49.https://doi.org/10.1016/j.cbpa.2013.10. 027PMID:24239669
38. Milligan CL. A regulatory role for cortisol in muscle glycogen metabolism in rainbow trout Oncorhynchus mykiss Walbaum. J Exp Biol. 2003; 206: 3167–3173. PMID:12909698
39. Tocher DR. Metabolism and Functions of Lipids and Fatty Acids in Teleost Fish. Rev Fish Sci. 2003; 11: 107–184.
40. Yarahmadi P, Miandare HK, Hoseinifar SH, Gheysvandi N, Akbarzadeh A. The effects of stocking den-sity on hemato-immunological and serum biochemical parameters of rainbow trout (Oncorhynchus mykiss). Aquac Int. 2015; 23: 55–63.
41. Rui L. Energy Metabolism in the Liver. In: Terjung R, editor. Comprehensive Physiology. Hoboken, NJ, USA: John Wiley & Sons, Inc.; 2014. pp. 177–197.https://doi.org/10.1002/cphy.c130024PMID:
24692138
42. Holmes RS, Cox LA. Comparative structures and evolution of vertebrate lipase H (LIPH) genes and pro-teins: a relative of the phospholipase A1 gene families. 3 Biotech. 2012; 2: 263–275.
43. Sun J, Ji H, Li X-X, Shi X-C, Du Z-Y, Chen L-Q. Lipolytic enzymes involving lipolysis in Teleost: Synteny, structure, tissue distribution, and expression in grass carp (Ctenopharyngodon idella). Comp Biochem Physiol B Biochem Mol Biol. 2016; 198: 110–118.https://doi.org/10.1016/j.cbpb.2016.04.008PMID:
27131420
44. Fuchs CD, Claudel T, Trauner M. Role of metabolic lipases and lipolytic metabolites in the pathogenesis of NAFLD. Trends Endocrinol Metab. 2014; 25: 576–585.https://doi.org/10.1016/j.tem.2014.08.001
PMID:25183341
45. Woods CP, Hazlehurst JM, Tomlinson JW. Glucocorticoids and non-alcoholic fatty liver disease. J Ste-roid Biochem Mol Biol. 2015; 154: 94–103.https://doi.org/10.1016/j.jsbmb.2015.07.020PMID:
26241028
46. Bechmann LP, Hannivoort RA, Gerken G, Hotamisligil GS, Trauner M, Canbay A. The interaction of hepatic lipid and glucose metabolism in liver diseases. J Hepatol. 2012; 56: 952–964.https://doi.org/10. 1016/j.jhep.2011.08.025PMID:22173168
47. Spisni E, Tugnoli M, Ponticelli A, Mordenti T, Tomasi V. Hepatic steatosis in artificially fed marine tele-osts. J Fish Dis. 1998; 21: 177–184.https://doi.org/10.1046/j.1365-2761.1998.00089.xPMID:
21361972
48. Du F, Xu G, Nie Z, Xu P, Gu R. Transcriptome analysis gene expression in the liver of Coilia nasus dur-ing the stress response. BMC Genomics. 2014; 15: 558.https://doi.org/10.1186/1471-2164-15-558
PMID:24996224
49. Qin S, Yin J, Huang K. Free Fatty Acids Increase Intracellular Lipid Accumulation and Oxidative Stress by Modulating PPARαand SREBP-1c in L-02 Cells. Lipids. 2016; 51: 797–805.https://doi.org/10.1007/ s11745-016-4160-yPMID:27270405
50. Den Broeder MJ, Kopylova VA, Kamminga LM, Legler J. Zebrafish as a Model to Study the Role of Per-oxisome Proliferating-Activated Receptors in Adipogenesis and Obesity. PPAR Res. 2015; 2015: 1–11. 51. Urbatzka R, Galante-Oliveira S, Rocha E, Lobo-da-Cunha A, Castro LFC, Cunha I. Effects of the
PPARαagonist WY-14,643 on plasma lipids, enzymatic activities and mRNA expression of lipid metab-olism genes in a marine flatfish, Scophthalmus maximus. Aquat Toxicol. 2015; 164: 155–162.https:// doi.org/10.1016/j.aquatox.2015.05.004PMID:25974001
52. Giudetti AM, Gnoni GV. Short-term effect of dexamethasone on fatty acid and cholesterol synthesis in isolated rat hepatocytes. Biochem Mol Biol Int. 1998; 44: 515–521. PMID:9556212