DOI:10.1051/0004-6361/201628662 c
ESO 2016
Astronomy
&
Astrophysics
Near-infrared photometry of WISE J085510.74
−
071442.5
M. R. Zapatero Osorio
1, N. Lodieu
2,3, V. J. S. Béjar
2,3, E. L. Martín
1, V. D. Ivanov
4, A. Bayo
5, H. M. J. Bo
ffi
n
4,
K. Muži´c
6, D. Minniti
7,8,9, and J. C. Beamín
5,81 Centro de Astrobiología (CSIC-INTA), Carretera de Ajalvir km 4, 28850 Torrejón de Ardoz, Madrid, Spain e-mail:[email protected]
2 Instituto de Astrofísica de Canarias, C/. Vía Láctea s/n, 38205 La Laguna, Tenerife, Spain 3 Departamento de Astrofísica, Universidad de La Laguna, 38206 La Laguna, Tenerife, Spain 4 European Southern Observatory, Alonso de Córdova 3107, Vitacura, Santiago, Chile
5 Instituto de Física y Astronomía, Facultad de Ciencias, Univ.de Valparaíso, Av. Gran Bretaña 1111, Valparaíso, Chile 6 Núcleo de Astronomía, Facultad de Ingeniería, Univ. Diego Portales, Av. Ejercito 441, Santiago, Chile
7 Dpt.Ciencias Físicas, Univ.Andrés Bello, Campus La Casona, Fernández Concha 700, Santiago, Chile 8 The Millennium Institute of Astrophysics, Santiago, Chile
9 Vatican Observatory, 00120 Vatican City State, Italy
Received 7 April 2016/Accepted 26 May 2016
ABSTRACT
Aims. We aim at obtaining near-infrared photometry and deriving the mass, age, temperature, and surface gravity of WISE J085510.74−071442.5 (J0855−0714), which is the coolest object beyond the solar system currently known.
Methods.We used publicly available data from the archives of theHubbleSpace Telescope (HST) and the Very Large Telescope (VLT) to determine the emission of this source at 1.153µm (F110W) and 1.575µm (CH4-off). J0855−0714 was detected at both wavelengths with a signal-to-noise ratio of≈10 (F110W) and≈4 (CH4-off) at the peak of the corresponding point-spread-functions. Results.This is the first detection of J0855−0714 in theH-band wavelengths. We measured 26.31±0.10 and 23.22±0.35 mag in F110Wand CH4-off(Vega system). J0855−0714 remains unresolved in the HST images that have a spatial resolution of 0.2200
. Com-panions at separations of 0.5 AU (similar mass and brightness) and at∼1 AU (≈1 mag fainter in theF110Wfilter) are discarded. By combining the new data with published photometry, including non-detections, we build the spectral energy distribution of J0855−0714 from 0.89 through 22.09µm, and contrast it against current solar-metallicity models of planetary atmospheres. We determine that the best spectral fit yields a temperature of 225−250 K, a bolometric luminosity of logL/L = −8.57, and a high surface gravity of
logg=5.0 (cm s−2), which suggests an old age although a gravity this high is not fully compatible with evolutionary models. After comparing our data with the cooling theory for brown dwarfs and planets, we infer a mass in the interval 2−10 MJupfor ages of 1−12 Gyr and high atmospheric gravities of logg ' 3.5 (cm s−2). If it had the age of the Sun, J0855−0714 would be a≈5-M
Jup free-floating planetary-mass object.
Conclusions.J0855−0714 meets the mass values previously determined for free-floating planetary-mass objects discovered in star-forming regions and young stellar clusters. Based on extrapolations of the substellar mass functions of young clusters to the field, as many J0855−0714-like objects as M5–L2 stars may be expected to populate the solar neighborhood.
Key words. brown dwarfs – stars: late-type – stars: low-mass – planetary systems
1. Introduction
Free-floating, planetary-mass objects with masses near and be-low the deuterium-burning limit at 13 Jupiter masses (MJup) and temperatures below ∼2200 K are established in several star-forming regions and open clusters younger than ∼150 Myr, including Orion (Lucas & Roche 2000; Lucas et al. 2001; Zapatero Osorio et al. 2000; Barrado y Navascués et al. 2001; Weights et al. 2009;Bayo et al. 2011),ρOphiucus (Marsh et al. 2010), Upper Scorpius (Lodieu et al. 2013), Chamaeleon-I (Muži´c et al. 2015, and references therein), and the Pleiades (Zapatero Osorio et al. 2014c,a). At the age of a few Gyr, sub-stellar evolutionary models predict extremely low temperatures (typically ≤500 K), similar to the planets of our solar system, for these isolated planetary-mass objects (Chabrier et al. 2000; Burrows et al. 2003). To date, only one unique object of this type is known, WISE J085510.83−071442.5, which was discovered byLuhman(2014, hereafter J0855−0714); it probably represents
the cold and old version of the young, free-floating planetary-mass objects.
F110W CH4-off F110W
2014 Nov 25 2015 Jan 16,18,20 2015 Mar 03 2015 Apr 11
F110W
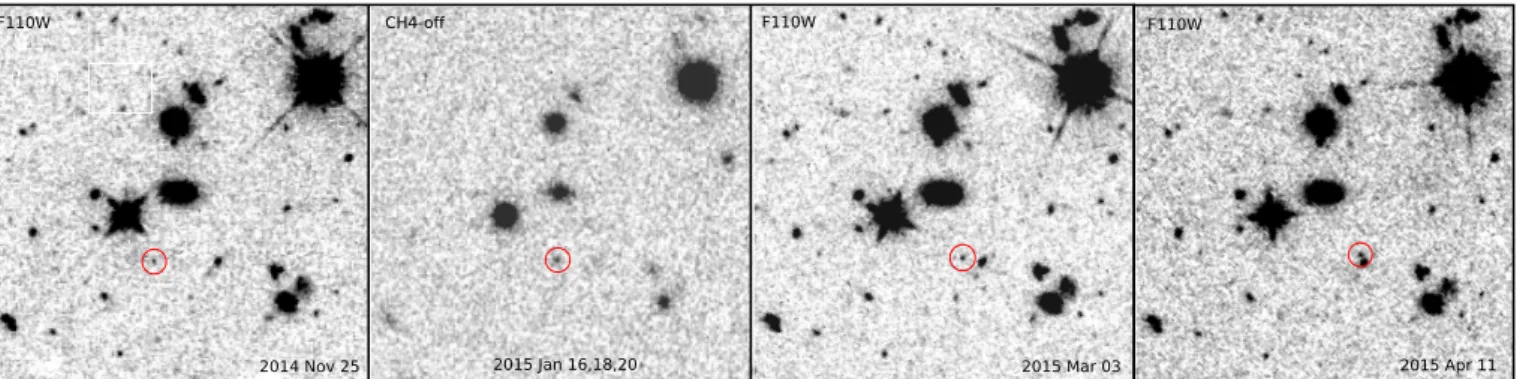
Fig. 1.Identification of WISE J085510.74−071442.5 (at the center of the red circles) on the WFC3 and Hawk-I images sized 2400×
2400
. The observing dates and filters are indicated. North is up and east is to the left.
Y-, andH-bands, respectively, while theK-band upper limit of 18.6 mag comes from the Visible and Infrared Survey Telescope for Astronomy (VISTA,Emerson et al. 2006) Hemisphere Sur-vey (McMahon et al. 2013) using the VISTA Infrared Camera (VIRCAM,Dalton 2006). The only ground-based reported ten-tative detection is in the J band (J=25.0±0.5 mag), but only has a modest signal-to-noise ratio of 2.6σ(Faherty et al. 2014). With all these photometric measurements in hand, current mod-els predict temperatures well below∼500 K and masses in the planetary domain for J0855−0714 (seeLeggett et al. 2015). As a reference, the temperature of Jupiter’s atmosphere at 1 bar is 165 K.
Here, we report the first clear near-infrared detections of J0855−0714 at 1.153 and 1.575 µm using public archival data from the European Southern Observatory (ESO) and theHubble Space Telescope (HST). We employed these data together with published photometry to improve the derivation of the spectral energy distribution and constrain the properties of this intrigu-ing planetary-mass object. The same data are also presented in Luhman & Esplin(2016), where these authors discuss the new near-infrared photometry of J0855−0714 in comparison with other Y dwarfs and model atmospheres.
2. Observations
J0855−0714 was observed with theF110W filter (centered on 1.1534 µm, passband of 0.5 µm) and the Wide-Field Cam-era 3 (WFC3) onboard the HST on three different occasions (2014 Nov. 25, 2015 Mar. 03, and 2015 Apr. 11) under pro-gram number 13802 (PI: K.Luhman). We downloaded the re-duced WFC3 frames from the Mikulski Archive for Space Tele-scopes1, which include flux-calibrated, geometrically corrected, and dither-combined images processed with the CALWF3 code version 3.3. The total exposure time was 5417.6 s per observing epoch. The released images have a plate scale of 0.128500pixel−1 and a spatial resolution of 0.2200as measured from the full-width at half-maximum (FWHM). The three public epochs are sepa-rated by 98 d (first and second) and 38.3 d (second and third) and have a field of view of approximately 20×20. Because of its high motion and significant parallax, J0855−0714 displaced itself by∼20 and∼10 WFC3 pixels between the first and second and the second and third HST images, respectively. J0855−0714 is detected in the broadband F110W filter on the three occa-sions with a signal-to-noise ratio of about 10 at the peak flux. Figure 1 shows a portion of the WFC3 images in which our 1 https://archive.stsci.edu/hst/
Table 1.New photometry and astrometry of J0855−0714.
Instrument MJD RA (J2000) Dec (J2000) Photometry (h m s) (o0 00) (mag)
Notes. Right ascension (RA) and declination (Dec) coordinates are given with a precision of±0.0500
. Photometry is in the Vega system. (a)Only the modified Julian date corresponding to the 2015 Jan 18 epoch is given. These data are not astrometrically calibrated.
target is identified. Using the photpackage within IRAF2, we obtained theF110Wphotometry for an aperture of 6 pixels (or 0.800), a sky annulus between 8 and 15 pixels, and a zero-point of 26.0628 mag (as of the instrument calibration3 of 2012 Mar 06, Vega photometric system). The photometry of the third HST epoch was obtained with a small aperture radius of 2 WFC3 pix-els because J0855−0714 lies very close to another source (see Fig. 1). An aperture correction was later applied to bring the derived instrumental photometry to the apparent value used in this paper. The WFC3 frames are astrometrically calibrated; the coordinates of J0855−0714 were determined from the centroids given by phot. The derived magnitudes and the astrometry of J0855−0714 as a function of observing date are given in Table1. J0855−0714 was also observed with the methane filter (CH4 -off, centered on 1.575µm, passband of 0.112µm) of the High Acuity Wide fieldK-band Imager (HAWK-I;Pirard et al. 2004; Casali et al. 2006;Kissler-Patig et al. 2008;Siebenmorgen et al. 2011) mounted on the Nasmyth A focus of the European South-ern Observatory Very Large Telescope (VLT) unit 4. The on-sky field of view is 56.25 arcmin2 with a cross-shaped gap of 1500 between the four HAWAII 2RG 2048 × 2048 pixels de-tectors. The expected location of J0855−0714 is in the north-west detector. The pixel scale is 0.10600. We downloaded the public raw data obtained on different occasions as part of pro-gram 094.C-0048 (PI: K. Luhman) and reduced the data for each date separately using theesorexpipeline (version 3.12). The tasks performed by the HAWK-I pipeline included the cre-ation of a master dark and master twilight flat-field as well as the reduction of the jitter observations up to the final reduction 2 The Image Reduction and Analysis Facility (IRAF) is distributed by National Optical Astronomy Observatories, whcih is operated by the Association of Universities for Research in Astronomy, Inc., under con-tract with the National Science Foundation.
stage, which incorporated the alignement and combination of sky-subtracted individual images. We did not run the recipe that handles the zero-point magnitude because it is not available for the methane filter. Of all publicly available images, only three epochs provided the deepest data, which we used here: 2015 Jan. 16, 18, and 20. The seeing was 0.400−0.500, and on-source exposure times were 2500 s (Jan. 16) and 5000 s (Jan. 18 and 20). These observing dates are bracketed by the HST dates, which allowed us to predict the position of J0855−0714 with a high accuracy. Our target is detected with a weak signal at the expected location in each individual date. Over the period of four days, J0855−0714 moves by less than one HAWK-I pixel. To improve the quality of the detection without de-grading the spatial resolution of the original data, we therefore combined the three images into one, a portion of which is il-lustrated in Fig. 1. J0855−0714 is unambiguously seen with a signal-to-noise ratio of 4 at the peak flux. This is the first time that J0855−0714 is detected at the H-band wavelengths from the ground. We performed the photometric calibration of the methane images by adopting a null (neutral) H−CH4-offcolor for three 2MASS stars (Skrutskie et al. 2006) that are not sat-urated in the field covered by the fourth detector. We then ob-tained the point-spread-function photometry of J0855−0714 de-riving CH4-off =23.22±0.35 mag (Table1), where the error bar accounts for the photon noise of the target and the uncertainty of the photometric calibration. The obtainedF110W and CH4-off photometry is compatible with theF125W andF160Wdata re-cently reported bySchneider et al.(2016a). The HST and VLT observing journal is provided in TableA.1.
3. Variability, astrometry, and search for companions
J0855−0714 does not show evidence of photometric variability with amplitudes larger than∼0.1 mag atF110W. However, we caution that the small difference between the three HST detec-tions may not mean low-amplitude variability. Very low-mass dwarfs are known to be fast rotators at nearly all ages. For ex-ample, the∼10-Myr planet 2M1207b (Chauvin et al. 2005) ro-tates with a period of 10.7+1.2
−0.6h (Zhou et al. 2016), and the two older brown dwarf components of the Luhman 16AB system (the closest known brown dwarfs, Luhman 2013) rotate with a pe-riod of 5.1±0.1 h (the B component) and 4−8 h (A) (Burgasser 2014;Buenzli et al. 2015;Mancini et al. 2015). As a reference, Jupiter has a sidereal rotation period of 9.925 h4. Even faster ro-tations of≈2 h have been reported in the literature for several brown dwarfs (e.g.,Clarke & Tinney 2002;Williams & Berger 2015). The HST observations of J0855−0714 cover 2.35, 3.72, and 5.17 h on the three observing epochs (TableA.1). If the ro-tation of our target is of the order of hours, then theF110Wdata would have averaged the object flux over a significant fraction of the rotational period, which could smooth the variability to a small magnitude difference.
Using the published astrometry of J0855−0714 (Luhman & Esplin 2014) and the new measurements from the WFC3 data (Table1), we determined a new parallax follow-ing the procedure described in Zapatero Osorio et al. (2014b). The values obtained, including nine epochs of observations between 2010.34 and 2015.28, areµα=−8.16±0.05 arcsec yr−1,
µδ= +0.66 ±0.05 arcsec yr−1, and π=0.464 ±0.020 arcsec, which translates into a distance of d=2.16±0.10 pc. These 4 Jupiter fact sheet: http://nssdc.gsfc.nasa.gov/planetary/
factsheet/jupiterfact.html
measurements are consistent within 1σthe quoted uncertainties with those ofLuhman & Esplin(2014), thus confirming that the distance to J0855−0714 is solidly established.
The excellent spatial resolution of the WFC3 images allowed us to constrain the multiplicity nature of J0855−0714 at separa-tions≥0.5 AU (provided the trigonometric distance of 2.2 pc). We investigated the presence of any comoving object within a radius of 50 AU (or≈2200). At the shortest separations of 0.5 AU, J0855−0714 appears unresolved; therefore, companions of sim-ilar brightness (or mass) are discarded. At distances of≥1 AU from the central object, no other source shows a high proper mo-tion similar to that of our target; hence, companions withF110W brightness up to≈1 mag fainter (4σ) than J0855−0714 can also be ruled out. If J0855−0714 has any companion, it would lie on a projected orbit with a semi-major axis of most likely less than 0.5 AU. Very accurate astrometry may reveal disturbances in the coordinates of J0855−0714 that might be due to close compan-ions (other planet-hunter techniques such as radial velocity stud-ies are not applicable to J0855−0714 because of its intrinsically faint luminosity and the lack of stable high-resolution spectro-graphs operating at mid-infrared wavelengths). From the paral-lax and proper motion solution, we obtained astrometric resid-uals (i.e., observed minus computed values) that are typically within 3σof the quoted astrometric uncertainties. A more pre-cise astrometric study can be carried out by considering the rel-ative phase that is artificially introduced by the location of the different space-based observatories. We did not account for this effect here.
4. Temperature and gravity
We built the photometric spectral energy distribution (SED) of J0855−0714 by converting our photometry and the photometry available in the literature (see Sect.1) into observed flux densi-ties. We used the Vega flux densities of 1784.9 Jy (Schultz et al. 2005) and 1048.801 Jy (Cohen et al. 1992) atF110Wand CH4 -off, respectively. For the remaining filters we employed the flux densities given in Reach et al.(2005) forSpitzer,Hewett et al. (2006) for z,Y, J, K, and Jarrett et al. (2011) for WISE. The resulting SED is shown in Fig. 2, where clear detections are plotted with a solid symbol and arrows indicate upper limits on the fluxes imposed by limiting magnitudes quoted in the litera-ture. For completeness, we also included the HST photometry of Schneider et al.(2016a) in Fig.2. Even non-detections are rele-vant to studying the SED of J0855−0714. The emission of this object is highest at∼4.5µm and shows a sharp increase by about three orders of magnitude from the near-infrared wavelengths to the peak of the SED. In the near-infrared, the strongest sig-nal occurs at the CH4-offfilter because the narrow width of this passband avoids the part of theHband that is strongly absorbed by methane and only registers frequencies less affected by wa-ter vapor and methane absorption. The weakest signal is asso-ciated with theF110W broadband filter because, in contrast to CH4-off, this passband covers a wide range of wavelengths that are strongly influenced by intense water vapor, ammonia, and methane absorptions (see below).
Fig. 2. Spectral energy distribution of J0855−0714 (red and black symbols). Circles denote positive detections and arrows indicate up-per limits. The black symbols correspond to Schneider et al.(2016a) data. The horizontal error bars account for the width of the various fil-ters. The filters are labeled. The best-fit planetary model atmosphere of Morley et al.(2014) computed as the average ofTeff=225 and 250 K, logg=5.0 (cm s−2) and 50% cloudy conditions is also shown with a gray line. The blue triangles represent the theoretical flux densities as in-tegrated from the models using the corresponding filter passbands (only for the filters in red). The new detections of J0855−0714 presented here correspond toF110Wand CH4. The model is normalized to the emis-sion of J0855−0714 at the wavelengths of theW2 filter.
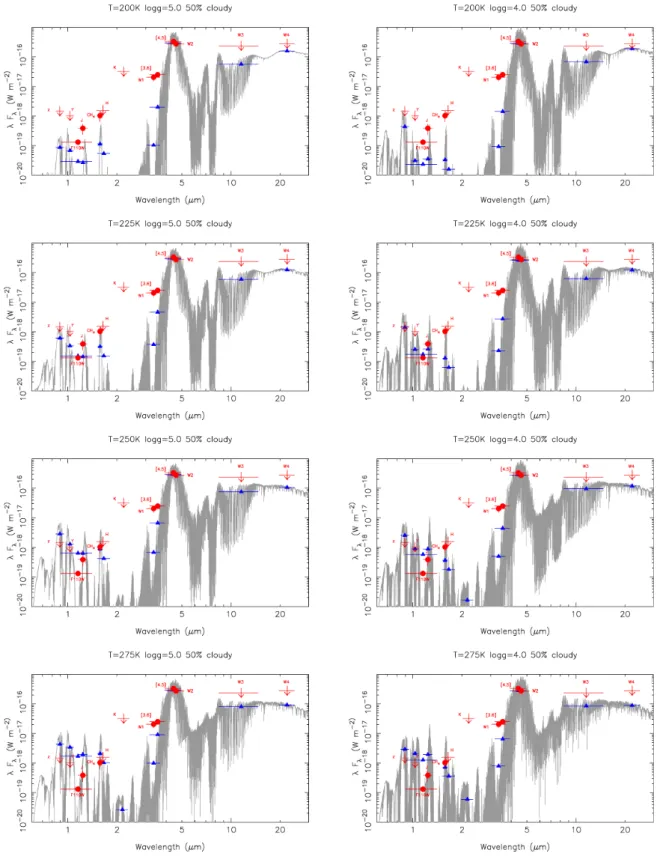
200−450 K and 3.0−5.0 (cm s−2) with increments of 25−50 K and 0.5 dex, respectively. For all theoretical spectra used here, Morley et al.(2014) adopted fsed=5 andh=0.5, where fsedis a parameter that describes the efficiency of sedimentation in the at-mospheres andhrepresents the fractional atmospheric area cov-ered in cloud holes. The models also incorporate the salt and sul-fide clouds (Na2S, KCl, ZnS, MnS, Cr) and water-ice clouds. In Fig.A.1, various of these theoretical spectra are shown together with the SED of J0855−0714. The models show that the near-infrared fluxes dramatically decline with decreasing tempera-ture. At the coolest temperature of the computations (200 K), nearly all flux emerges in the mid-infrared.
To facilitate the comparison between observed and theoreti-cal data, we computed the model photometric SED for each tem-perature and gravity using the filter passbands corresponding to the various observations of J0855−0714. The resulting theoret-ical photometric SEDs are also shown normalized to the target W2-band emission in Figs.2andA.1. The spectra reported by Morley et al.(2014) describe the SED of J0855−0714 reason-ably well. To find the best-fit temperature and gravity, we mini-mized the following expression:
where f stands for the observed and modeled fluxes for each wavelengthiin which there is a detection of J0855−0714 (n=7, F110W,J, CH4-off,W1, [3.6], [4.5], andW2). The best fit (low-est value of ψ2) is found for the theoretical computation with Teff=225 K and high gravity logg=5.0 (cm s−2). In the mini-mization process, the most strongly deviating point corresponds toF110W (see next); models ofTeff > 225 K and theF110W observation differ by one and two orders of magnitude. Only the 225-K model provides a good match to this data point (see Fig.A.1). IfF110Wis removed from Eq. (1), then the best-fit so-lution is found for a temperature intermediate between 225 and 250 K and logg=5.0 (cm s−2). A temperature this low agrees
with the estimates made for J0855−0714 by Luhman (2014), Wright et al.(2014),Faherty et al.(2014),Beamín et al.(2014), Kopytova et al. (2014), andLeggett et al. (2015). In Fig.2 we plot an intermediate model spectrum (by averaging the 225-K and 250-K data) along with its computed photometry. The strongest absorption features are due to water, methane, and am-monia, with some tiny contribution from PH3in the mid-infrared at 4.3µm.
Figure 2 shows that the J, CH4-off and [4.5] data of J0855−0714 are reproduced by the model within 1.5σthe quoted uncertainties (all data are normalized to theW2 emission of the target). Additionally, the observed flux upper limits at wave-lengths≥1.4µm are consistent with the model predictions (this includesH,K,W3, andW4). However, there are discrepancies between the theory and the observations at certain wavelengths. It appears that the models envision a very strong methane ab-sorption at 3−4 µm (see also Fig. A.1), which disagrees with the observations (W1 and [3.6]). At shorter wavelengths, nei-ther F110W nor the bluer filters z and Y are matched by the 225−250 K model. The synthetic spectra warmer than 225 K pre-dict too much emission (or too less absorption) than expected at these wavelengths.F110Wincludes the non-detection atF105W (Schneider et al. 2016a), and the two detections atF125W- and Jbands, the latter of which is reasonably reproduced. This in-dicates that the models overpredict the flux emission at wave-lengths blueward of∼1.1µm. These mismatches may indicate an incorrect or incomplete treatment of methane in current mod-els. It appears that non-equilibrium carbon chemistry in cool atmospheres, possibly related to vertical flows of material, is required to explain the spectra of L and T dwarfs and the gi-ant planets of the solar system (e.g.,Oppenheimer et al. 1998; Visscher & Moses 2011;Currie et al. 2014).
As illustrated in Fig. A.1, the low gravity models envision more flux below ∼1 µm than the high-gravity models for a given temperature because of the weaker potassium absorption at low-pressure atmospheres. At the same time, CH4-offbecomes fainter at low gravities relative to theJ-band fluxes. These two properties (as predicted by theMorley et al. 2014 models) are not compatible with the SED of J0855−0714, for which we find that CH4-offemission is stronger than theJ-band fluxes in the units displayed in Fig.2. This supports the high-gravity nature of J0855−0714.
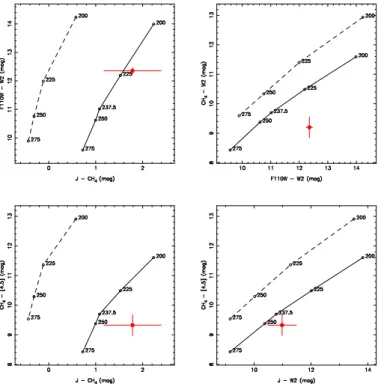
Figure 3shows various color−color diagrams in which the location of J0855−0714 is compared with the synthetic indices computed from the spectra ofMorley et al.(2014). This figure summarizes part of the discussion above. We note that accord-ing to these theoretical spectra, the effect of gravity is great in the low-temperature regime, with notorious differences of about 1−1.5 mag (for a given temperature) in the near-infrared wave-lengths. The inversion of the fluxes atJand CH4-offbands be-tween the two gravities considered here is revealed by the blue (negative) and red (positive)J−CH4-offcolors displayed in the left panels of Fig.3. The two bottom panels of the figure, which considerJ, CH4-off, [4.5], andW2, are useful to distinguishTeff and gravity for future J0855−0714-like discoveries. Neverthe-less, the (large) differences observed between J0855−0714 and the theory in Figs.2,3,A.1, and5(see below) indicate that some improvements in models of planetary atmosphers and evolution are necessary to better characterize this object.
Fig. 3.Color−color diagrams of J0855−0714 (red dot) including the synthetic indices (open circles) computed from theMorley et al.(2014) theoretical spectra. The high-gravity colors (logg= 5.0 cm s−2) are joined by a solid line, and the dashed line stands for the low gravity indices (logg=4.0 cm s−2). All synthetic colors are labeled with their correspondingTeff(K). (CH4stands for the CH4-offfilter.)
below∼1.1µm given by the model does not have a significant effect on this determination because most of the emission occurs at∼4.5µm. The luminosity value reported here strongly depends on the models used. The true luminosity of J0855−0714 might be higher if its methane absorption at∼3.5µm is not as intense as predicted by the model.
5. Mass and age
We also compared the observed photometry and the derived Teff and surface gravity with the models for cool brown dwarfs and extrasolar giant planets ofBaraffe et al. (2003) to set con-straints on the mass and age of J0855−0714. These models di-rectly provide the magnitudes in the filters of interest (except for CH4-off) by integrating over the theoretical spectra computed by Allard et al.(2001). Figure4 displays the absoluteW2 magni-tudes as a function of age and planetary mass. We also show the Teff and logg theoretical values of the models in Fig.4 to aid the discussion below. The flux emission of objects as cool as our target peaks in this band. We relied onW2 to determine the most likely mass and age for J0855−0714. The high gravity obtained in Sect.4indicates that this dwarf has a small radius that is com-patible with an old age (young objects are undergoing a self-collapse process and have large radii, e.g., Lodieu et al. 2015; Kraus et al. 2015, and references therein). However, the value of logg=5 (cm s−2) exceeds the gravity predicted by the evolution-ary models ofBaraffe et al. (2003) for objects as cool as a few hundred K at the age of the Galaxy (∼12 Gyr) by at least 0.5 dex. We found the same mismatch when using the evolutionary mod-els ofSaumon & Marley(2008). We overcame this discrepancy by qualitatively accepting that J0855−0714 has contracted suffi -ciently and that it likely has an age typical of the solar neighbor-hood (Holmberg et al. 2009). The age distribution of the solar
Fig. 4.Evolution of the absoluteW2 magnitude is shown for masses between 1 and 10MJup(COND models;Baraffe et al. 2003). Each mass track is labeled with theTeff/loggpair values (K, cm s−2) corresponding to the different ages tabulated in the models. The J0855−0714 absolute W2 magnitude is bracketed by the two horizontal red lines (1σ). The blue shaded area indicates the most likely position of J0855−0714 based on its high surface gravity [logg'3.5 (cm s−2)].
vicinity peaks at 1−3 Gyr and rapidly declines toward higher ages (Nordstrom et al. 2004). For these ages, and according to the substellar cooling models shown in Fig.4, high-gravity val-ues may be defined by logg'3.5 (cm s−2) for dwarfs with low planetary-mass.
The absoluteW2 magnitude of J0855−0714 and its associ-ated 1σ uncertainty [M(W2) = 17.30 ± 0.17 mag], which in-cludes the errors in the observed photometry and the distance determination, is shown in Fig.4 with a band marked by two horizontal red lines. Interestingly, and in contrast to the gravity parameter, theTeffs inferred for the target dwarf from the evolu-tionary model agree with that obtained from the spectral fitting in Sect.4. We note, however, that for all planetary masses and a givenW2 magnitude the models give a similarTefffor any of the ages illustrated in the figure. This degeneracy probably arises because the change in the planets’ radius with age (≥0.1 Gyr) is relatively small (lower than 25%); this means that the size of the planets does not strongly depend on mass. To break this ambiguity, the surface gravity is useful. The blue shaded re-gion depicted in Fig.4 considers high gravities in the interval logg = 3.6−4.5 (cm s−2), from which we determined the mass of J0855−0714 to be 2−10MJupfor the age interval 1−12 Gyr. J0855−0714 would have a mass of≈3MJupat 2 Gyr and a mass of ≈5 MJup at the age of the solar system. Similar results are obtained from theSpitzer[4.5] data.
Fig. 5.Color-magnitude diagram considering theF110WandW2 fil-ters. OurF110Wdata are plotted as red symbols (J0855−0714 is la-beled). Data from Burgasser et al. (2006) and Luhman et al. (2014) are shown with black circles and labeled with their spectral types. (We assumed that W2 ≈ [4.5] for the Y-dwarf WD0806−661B; Luhman et al. 2012,2014. This assumption is based on the similarity of these two magnitudes in J0855−0714). The COND 5-Gyr evolution-ary model ofBaraffe et al.(2003) is depicted with a solid line. Masses in Jovian units predicted for the ages of 1, 5, and 10 Gyr are labeled at the right side.
out as the reddest and faintest source. The 5 Gyr isochrone of Baraffe et al. (2003) is also shown. While it follows the trend pictured by the T dwarfs relatively well (despite the signifi-cant scatter in the observed data), the model is far from re-producing the extreme F110W −W2 color of cooler objects like our target, probably because of incorrect predictions for the F110W filter, which is very sensitive to water, methane, and ammonia absorption (see Fig. 2). While the massive near-infrared surveys like the VVV Survey (Minniti et al. 2010) are discovering interesting cool nearby objects (e.g., Beamín et al. 2013), the diagram of Fig. 5 reveals that the mid-infrared ob-servations become critical for searching and characterizing the coldest planetary-mass objects. The near-infrared detections of J0855−0714 reported here are brighter than the limit of what could be detected by the Euclid5mission, which is expected to reach∼24.5 mag inHband (3σ, AB system) for the wide survey (between 15 000 and 20 000 deg2) and two magnitudes fainter for the deep survey (40 deg2). The combination of Euclid and NEOWISE (Schneider et al. 2016b) data will be a very effective way of selecting brown dwarf and free-floating planet candidates as cold as J0855−0714.
Based on the mass functions of young clusters (e.g., Bayo et al. 2011;Peña Ramírez et al. 2012;Lodieu et al. 2013), we can estimate the number of J0855−0714-like objects populat-ing the solar neighborhood by assumpopulat-ing that the mass distribu-tion of stellar cluster members resembles that of the field popu-lation. In its power-law form (dN/dM∼M−α), the mass function 5 Euclid Definition Study Report (Red Book), ESA/SRE(2011)12.
has a slope that probably lies in the intervalα=0.4−1 for the low-mass stellar and substellar regimes (see review byLuhman 2012). We expect as many J0855−0714-like free-floating plan-ets as 0.075−0.15Mstars (spectral types∼M5–L2) in the solar vicinity. Considering the possible values of the mass function ex-ponent, this estimate can change by a factor of two. Discovering them is indeed challenging and will open a new window to the study of planetary atmospheres. Ground- and space-based mid-infrared instruments have the potential of playing a significant role.
6. Conclusions
J0855−0714 is detected with a signal-to-noise ratio of≈10 and ≈4 in theF110W and CH4-offbands of the WFC3 (HST) and Hawk-I (VLT) instruments. This is the first detection in the H-band wavelengths and the first>3σground-based detection at any wavelegnth. The comparison of the new photometry com-bined with the previously published data to current theoretical spectra computed for giant planets yields that J0855−0714 prob-ably has a temperature of 225−250 K and a high surface gravity [logg'5 (cm s−2)]. J0855−0714 shows a redJ−CH4-offcolor of 1.78±0.61 mag in agreement with predictions of the high-gravity models and in marked contrast with the blue (negative) indices given by the low-gravity synthetic spectra. However, the logg'5 (cm s−2) obtained from the spectral fitting is not con-sistent with the predictions of evolutionary models of low-mass brown dwarfs and planets. For ages typical of the solar neigh-borhood (older than about 1 Gyr), the substellar evolutionary models envision a mass ranging from 2 to 10 MJupand gravi-ties in the interval logg=3.5−4.5 (cm s−2). If J0855−0714 had the age of the Sun, it would be a≈5MJupfree-floating planetary-mass object. Based on the extrapolation of the stellar and sub-stellar mass functions of young clusters, there might be as many J0855−0714-like sources in the solar neighborhood as low-mass stars with spectral types M5–L2. At distances<7 pc, we estimate that 15−60 J0855−0714-like objects may be present (based on the over 30 M5–L2 sources cataloged at a related distance from the Sun by the RECONS survey6). Discovering them is indeed challenging.
Acknowledgements. Based on observations made with ESO telescopes at the La
Silla Paranal Observatory under program ID 094.C-0048(A) retrieved from the ESO Science Archive Facility. Based on observations made with the NASA/ESA
HubbleSpace Telescope, obtained from the data archive at the Space
Tele-scope Science Institute (STScI). STScI is operated by the Association of Uni-versities for Research in Astronomy, Inc. under NASA contract NAS 5-26555. This research has made use of the Simbad and Vizier databases, operated at the Centre de Données Astronomiques de Strasbourg (CDS), and of NASA’s Astrophysics Data System Bibliographic Services (ADS). Current support for RECONS comes from the National Science Foundation. Our primary observ-ing programs are carried out via the SMARTS Consortium, which operates four telescopes in the Chilean Andes under the auspices of National Optical As-tronomy Observatory and the National Science Foundation. This research has been partly supported by the Spanish Ministry of Economy and Competitive-ness (MINECO) under the grants AYA2014-54348-C3-2-R, AYA2015-69350-C3-2-P, and AYA2015-69350-C3-1. A.B.acknowledges financial support from the Proyecto Fondecyt de Iniciación 11140572. D.M.is supported by FONDE-CYT Regular No. 1130196, the BASAL CATA Center for Astrophysics and As-sociated Technologies PFB-06, and the Ministry for the Economy, Development, and Tourism’s Programa Iniciativa Científica Milenio IC120009, awarded to the Millennium Institute of Astrophysics (MAS). K.M.acknowledges the support of the ESO-Government of Chile Joint Committee. J.C.B.acknowledge support from CONICYT FONDO GEMINI – Programa de Astronomía del DRI, Fo-lio 32130012. This work results within the collaboration of the COST Action TD 1308.
References
Allard, F., Hauschildt, P. H., Alexander, D. R., Tamanai, A., & Schweitzer, A. 2001,ApJ, 556, 357
Baraffe, I., Chabrier, G., Barman, T. S., Allard, F., & Hauschildt, P. H. 2003, A&A, 402, 701
Barrado y Navascués, D., Zapatero Osorio, M. R., Béjar, V. J. S., et al. 2001, A&A, 377, L9
Bayo, A., Barrado y Navscués, D., Stauffer, J. R., et al. 2011,A&A, 536, A63 Beamín, J. C., Minniti, D., Gromadzki, M., et al. 2013,A&A, 557, L8 Beamín, J. C., Ivanov, V. D., Bayo, A., et al. 2014,A&A, 570, L8 Buenzli, E., Marley, M. S., Apai, D., et al. 2015,ApJ, 812, 163
Burgasser, A. J., Kirkpatrick, J. D., Cruz, K. L., et al. 2006,ApJS, 166, 585 Burgasser, A. J., Gillon, M., & Faherty, J. K. 2014,ApJ, 785, 48
Burrows, A., Sudarsky, D., & Lunine, J. I. 2003,ApJ, 596, 587 Burrows, A., Sudarsky, D., & Hubeny, I. 2004,ApJ, 609, 407 Casali, M., Pirard, J.-F., Kissler-Patig, M., et al. 2006,SPIE, 6269, 29 Chabrier, G., Baraffe, I., Allard, F., & Hauschildt, P. H. 2000,ApJ, 542, 464 Chauvin, G., Lagrange, A.-M., Dumas, C., et al. 2005,A&A, 438, L25 Clarke, F. J., & Tinney, C. G., & Covey, K. R. 2002,MNRAS, 332, 361 Cohen, M., Walker, R. G., Barlow, M. J., & Deacon, J. R. 1992,AJ, 104,
1650
Currie, T., Burrows, A., Girard, J. H., et al. 2014,ApJ, 795, 133
Dalton, G. B., Caldwell, M., Ward, A. K., 2006,SPIE Conf. Ser., 6269, 30 Emerson, J., McPherson, A., & Sutherland, W. 2006,The Messenger, 126, 41 Faherty, J. K., Burgasser, A. J., Walter, F. M., et al. 2012,ApJ, 752, 56 Faherty, J. K., Tinney, C. G., Skemer, A., & Monson, A. J. 2014,ApJ, 793, L16 Hewett, P. C., Warren, S. J., Leggett, S. K., & Hodgkin, S. T. 2006,MNRAS,
367, 454
Holmberg, J., Nordstrom, B., & Andersen, J. 2009,A&A, 501, 941 Jarrett, T. H., Cohen, M., Masci, F., et al. 2011,ApJ, 735, 112 Kissler-Patig, M., Pirard, J.-F., Casali, M., et al. 2008,A&A, 491, 941 Kopytova, T. G., Crossfield, I. J. M., Deacon, N. R., et al. 2014,ApJ, 797, 3 Kraus, A. L., Cody, A. M., Covey, K. R., et al. 2015,ApJ, 807, 3
Leggett, S. K., Morley, C. V., Marley, M. S., & Saumon, D. 2015,ApJ, 799, 37 Lodieu, N., Dobbie, P. D., Cross, N. J. G., et al. 2013,MNRAS, 435, 2474 Lodieu, N., Alonso, R., González Hernández, J. I., et al. 2015,A&A, 584, A128 Lucas, P. W., & Roche, P. F. 2000,MNRAS, 314, 858
Lucas, P. W., Roche, P. F., Allard, F., & Hauschildt, P. H. 2001,MNRAS, 326, 695
Luhman, K. L. 2012,ARA&A, 50, 65 Luhman, K. 2013,ApJ, 767, L1 Luhman, K. L. 2014,ApJ, 786, L18
Luhman, K. L., & Esplin, T. L. 2014,ApJ, 796, 6 Luhman, K. L., & Esplin, T. L. 2016, AJ, in press
Luhman, K. L., Burgasser, A. K., Labbé, I., et al. 2012,ApJ, 744, 135 Luhman, K. L., Morley, C. V., Burgasser, A. J., Esplin, T. L., & Bochanski, J. J.
2014,ApJ, 794, 16
Mancini, L., Giacobbe, O., Littlefair, S. P., et al. 2015,A&A, 584, A104 Marsh, K. A., Kirkpatrick, J. D., & Plavchan, P. 2010,ApJ, 709, L158 McMahon, R. G., Banerji, M., González, E., et al. 2013,The Messenger, 154, 34 Minniti, D., Lucas, P. W., Emerson, J. P., et al. 2010,New Astron., 15, 433 Morley, C. V., Marley, M. S., Fortney, J. J., et al. 2014,ApJ, 787, 78 Muži´c, K., Scholz, A., Geers, V. C., & Jayawardhana, R. 2015,ApJ, 810, 159 Nordstrom, B., Mayor, M., Andersen, J., et al. 2004,A&A, 418, 989
Oppenheimer, B. R., Kulkarni, S. R., Matthews, K., & van Kerkwijk, M. H. 1998, ApJ, 502, 932
Peña Ramírez, K., Béjar, V. J. S., Zapatero Osorio, M. R., Petr-Gotzens, M. G., & Martín, E. L. 2012,ApJ, 754, 30
Pirard, J.-F., Kissler-Patig, M., Moorwood, A., et al. 2004,SPIE, 5492, 1763 Reach, W. T., Megeath, S. T., Cohen, M., et al. 2005,PASP, 117, 978 Saumon, D., & Marley, M. R. 2008,ApJ, 689, 1327
Schneider, A. C., Cushing, M. C., Kirkpatrick, J. D., & Gelino, C. R. 2016a,ApJ, 823, L35
Schneider, A. C., Greco, J., Cushing, M. C., et al. 2016b,ApJ, 817, 112 Schultz, A., Noll, K., Barker, E., et al. 2005, NICMOS Instrument Handbook,
Version 8.0 (Baltimore: STScI)
Siebenmorgen, R., Carraro, G., Valenti, E., et al. 2011,The Messenger, 144, 9 Skrutskie, M. F., Cutri, R. M., Stiening, R., et al. 2006,AJ, 131, 1163 Sudarsky, D., Burrows, A., Hubeny, I., & Li, A. 2005,ApJ, 627, 520 Tinney, C. G., Faherty, J. K., Kirkpatrick, J. D., et al. 2014,ApJ, 796, 39 Visscher, C., & Moses, J. I. 2011,ApJ, 738, 72
Weights, D. J., Lucas, P. W., Roche, P. F., Pinfield, D. J., & Riddick, F. 2009, MNRAS, 392, 817
Williams, P. K. G., & Berger, E. 2015,ApJ, 808, 189
Wright, E. L., Mainzer, A., Kirkpatrick, J. D., et al. 2014,AJ, 148, 82 Zapatero Osorio, M. R., Béjar, V. J. S., Martín, E. L., et al. 2000,Science, 290,
103
Zapatero Osorio, M. R., Béjar, V. J. S., Martín, E. L., et al. 2014a,A&A, 572, A67
Zapatero Osorio, M. R., Béjar, V. J. S., Miles-Páez, P. A., et al. 2014b,A&A, 568, A6
Zapatero Osorio, M. R., Gálvez Ortiz, M. C., Bihain, G., et al. 2014c,A&A, 568, A77
Appendix A: Additional material
TableA.1provides the journal of the HST and VLT observations of J0855−0714 that are publicly available.
FigureA.1displays the comparison of the J0855−0714 pho-tometric SED with the theoretical spectra ofMorley et al.(2014) computed for fsed=5,h=0.5 (half of the cloudy atmosphere is covered in holes), temperatures of 200−275 K, and two surface gravities (logg=4.0 and 5.0 cm s−2). The best fit is given by the 225 K and logg=5.0 cm s−2model.
We searched for public data of≥T8 and Y-type dwarfs ob-served with the F110W filter and the WFC3 instrument on-board the HST to complement the color-magnitude diagram of Fig. 5. Several observations are available. In addition, we se-lected the ultra-cool dwarfs with trigonometric parallaxes avail-able in the literature (Faherty et al. 2012;Tinney et al. 2014) and with a clear detection in the WFC3 data. Our search resulted in three T8–T9 dwarfs listed in TableA.2, for which we measured theirF110Wphotometry in the same manner as for J0855−0714 (Sect.2).
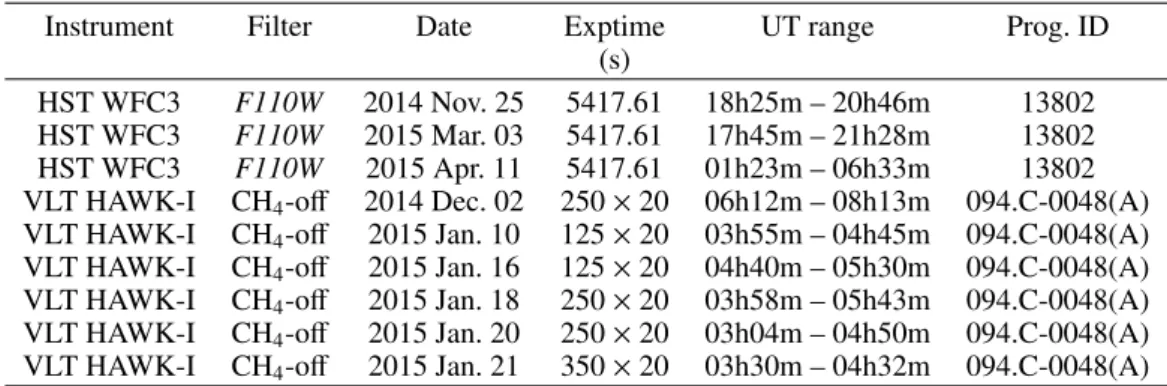
Table A.1.Journal of HST and VLT observations downloaded from their respective archives.
Instrument Filter Date Exptime UT range Prog. ID
(s)
HST WFC3 F110W 2014 Nov. 25 5417.61 18h25m – 20h46m 13802 HST WFC3 F110W 2015 Mar. 03 5417.61 17h45m – 21h28m 13802 HST WFC3 F110W 2015 Apr. 11 5417.61 01h23m – 06h33m 13802 VLT HAWK-I CH4-off 2014 Dec. 02 250×20 06h12m – 08h13m 094.C-0048(A) VLT HAWK-I CH4-off 2015 Jan. 10 125×20 03h55m – 04h45m 094.C-0048(A) VLT HAWK-I CH4-off 2015 Jan. 16 125×20 04h40m – 05h30m 094.C-0048(A) VLT HAWK-I CH4-off 2015 Jan. 18 250×20 03h58m – 05h43m 094.C-0048(A) VLT HAWK-I CH4-off 2015 Jan. 20 250×20 03h04m – 04h50m 094.C-0048(A) VLT HAWK-I CH4-off 2015 Jan. 21 350×20 03h30m – 04h32m 094.C-0048(A)
Table A.2.AdditionalF110Wphotometry.
Object SpT F110W W2 Date Prog. ID Exp.time
(mag) (mag) (s)