Synthetic wind data series for the Chilean wind park analysis : study of variability, wind energy generation and capacity factor estimation
Texto completo
Figure


Documento similar
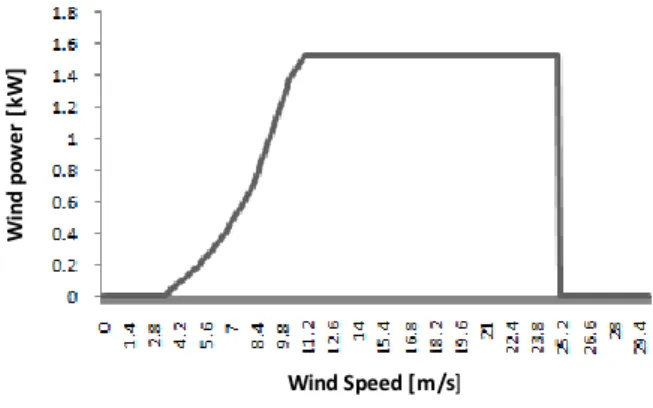
8-10, are depicted wind speed sequence, the simulated rotor speed and the output power, respectively, for the wind turbine simulated. The characteristics of the wind turbine
A new processing methodology of wind profiler Doppler spectra called UBWPP (Method 2) has been described, addressing the computation of horizontal and vertical wind components,
X2100 Power Board consitis on different parts (Inrush/VDE, PFC, 3 phase driver).. Inrush/ VDE schema. The module includes all the full bridge diode that rectify the line
Thus, the simplest approach to build specific predictors is to define a wind speed threshold value and to construct different energy prediction models for NWP forecasts whose
And in those fluctuations the importance of the spatial correlation of the wind speed in that time frame is shown by the fact that the power fluctuations of the 160 MW Wind Farm
[r]
Coherence measured in Nysted Wind Farm in the longitudinal situation and an exponential curve fitted to the data. Distance (m)
In particular, the reduction in both radiation load (net radiation) and wind speed due to the presence of the cover material leads to
